- What's in This Guide
- Using the Cisco TelePresence System Administration
- Device Information
- Configuring the Cisco TelePresence System
- Troubleshooting the CTS 500
- Troubleshooting the CTS 500-32
- Troubleshooting the CTS 1000
- Troubleshooting the CTS 1100
- Troubleshooting the CTS 1300
- Troubleshooting the TX1300 47
- Troubleshooting the TX1310 65
- Troubleshooting the CTS 3000 and CTS 3200
- Troubleshooting the CTS 3010 and CTS 3210
- Troubleshooting the TX9000 and TX9200
- Monitoring the Cisco TelePresence System
- Satellite Licenses for the Cisco TelePresence System
- Glossary
- Index
Contents
This chapter contains the following sections:
Figure 1-1 shows the tools that are available in the Monitoring window:
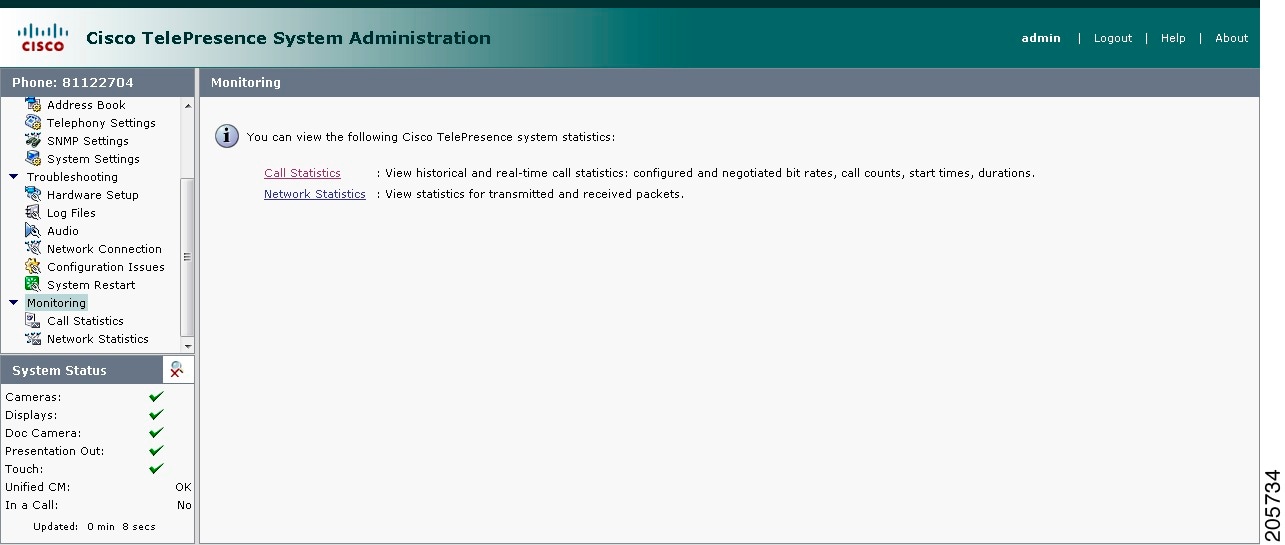
Call Statistics
Use the Call Statistics window to view audio and video statistics collected by the codecs. The reports include descriptions to help you understand the type of information that is being collected.
Step 1![]() Choose Monitoring > Call Statistics.
Choose Monitoring > Call Statistics.
You can view the following Cisco TelePresence system statistics:
- Audio/Video Call—Lists details about the audio and video of an in-progress call, including the following:
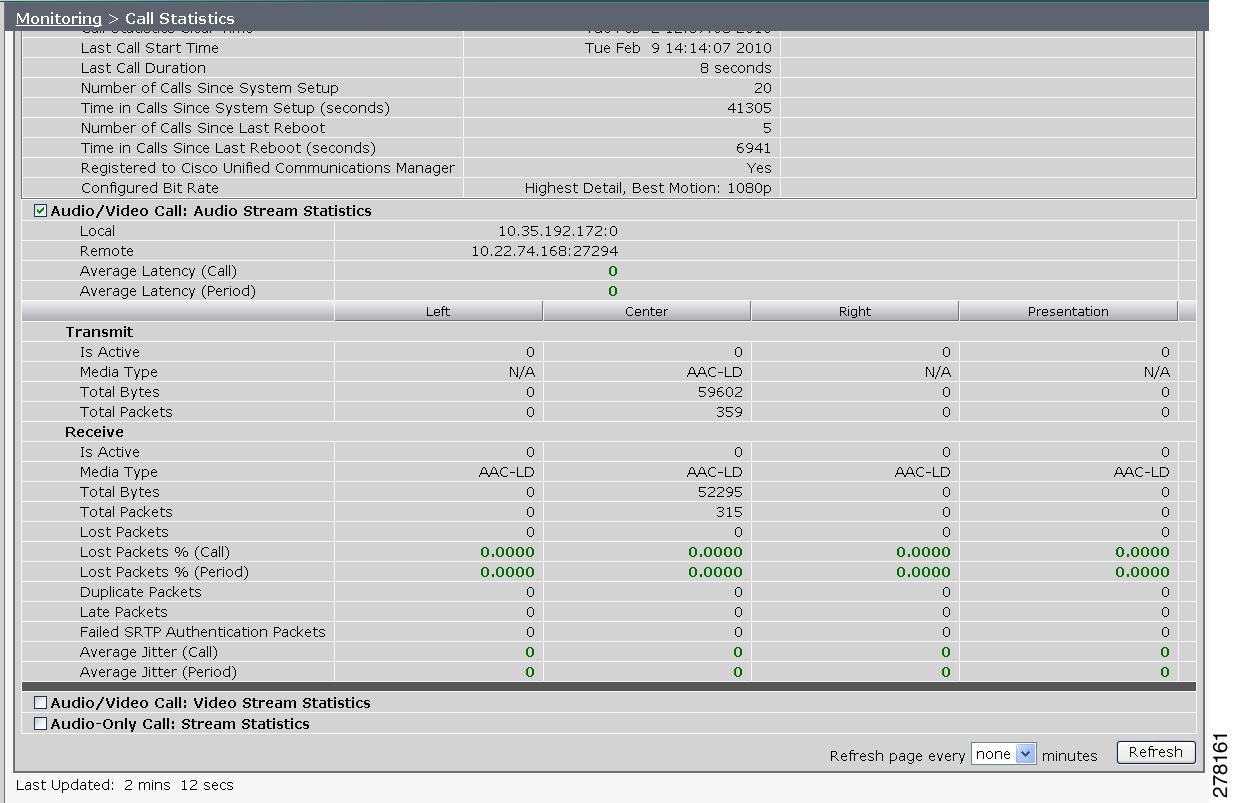
- Historical Call Statistics (not including current call, if any) —Lists historical information about calls including the following:
–![]() Number of Calls Since System Setup
Number of Calls Since System Setup
–![]() Time in Calls Since System Setup (seconds)
Time in Calls Since System Setup (seconds)
–![]() Number of Calls Since Last Reboot
Number of Calls Since Last Reboot
–![]() Time in Calls Since Last Reboot (seconds)
Time in Calls Since Last Reboot (seconds)
–![]() Registered to Cisco Unified Communications Manager
Registered to Cisco Unified Communications Manager
Step 2![]() For more specific audio and video statistics, click the check-box next to the following selections.:
For more specific audio and video statistics, click the check-box next to the following selections.:
- Audio/Video Call: Audio Stream Statistics
- Audio/Video Call: Video Stream Statistics
- Audio-Only Call: Stream Statistics
Audio/Video Call: Audio Stream Statistics
a.![]() Click once to select. Additional statistics fields appear.
Click once to select. Additional statistics fields appear.
b.![]() Click once to de-select. Additional fields are hidden.
Click once to de-select. Additional fields are hidden.
See Figure 1-2.
Audio/Video Call: Video Stream Statistics
a.![]() Click once to select. Additional statistics fields appear.
Click once to select. Additional statistics fields appear.
b.![]() Click once to de-select. Additional fields are hidden.
Click once to de-select. Additional fields are hidden.
Audio-Only Call: Stream Statistics
a.![]() Click once to select. Additional statistics fields appear.
Click once to select. Additional statistics fields appear.
b.![]() Click once to de-select. Additional fields are hidden.
Click once to de-select. Additional fields are hidden.
Statistics are listed in columns labeled as if you were looking at the front of the system sitting at the conference table. For example, on a CTS 3000 or CTS 3200, the labels indicate statistics from the left, center, and right codecs (and presentation codec, if installed), and from auxiliary devices (when connected).
When you select one of the choices above, additional statistics fields appear with the following status information listed, as shown in Figure 1-2:
Figure 1-2 Audio/Video Call: Audio Stream Statistics
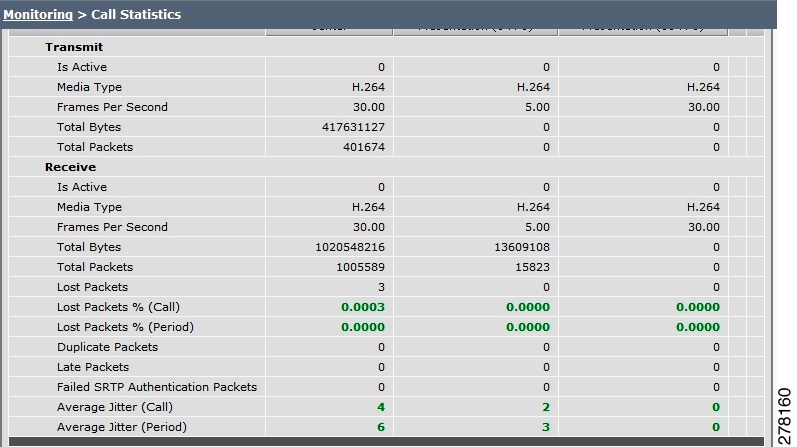
Additional statistics are listed for the following, as shown in Figure 1-3:
- Is Active
- Media Type
- Total Bytes
- Total Packets
- Lost Packets
- Lost Packets % (Call)
- Lost Packets % (Period)
- Duplicate Packets
- Late Packets
- Failed SRTP Authentication Packets
- Average Jitter (Call) (see jitter call)
- Average Jitter (Period) (see jitter period)

Note For more information about jitter and packet loss, see the Understanding Jitter and Packet Loss Reporting section of the Cisco TelePresence System Message Guide on Cisco.com.
Figure 1-3 Call Statistics - Transmit and Receive
Step 3![]() Set an interval for updating these reports by choosing the time from the
Refresh
drop-down menu. Choices, in minutes, include the following:
Set an interval for updating these reports by choosing the time from the
Refresh
drop-down menu. Choices, in minutes, include the following:
Step 4![]() Click
Refresh
to update the statistics immediately.
Click
Refresh
to update the statistics immediately.
Network Statistics
Use Network Statistics to view packet transmission statistics collected from the network. Statistics are listed in columns labeled as if you were looking at the back of the system. For example, on a CTS 3000 or CTS 3200, the labels would indicate statistics from the left, center, and right codecs.
To monitor network statistics:
Step 1![]() Choose Monitoring > Network Statistics. Statistics for your system appear, as shown in Figure 1-4.
Choose Monitoring > Network Statistics. Statistics for your system appear, as shown in Figure 1-4.
Figure 1-4 Network Statistics Window
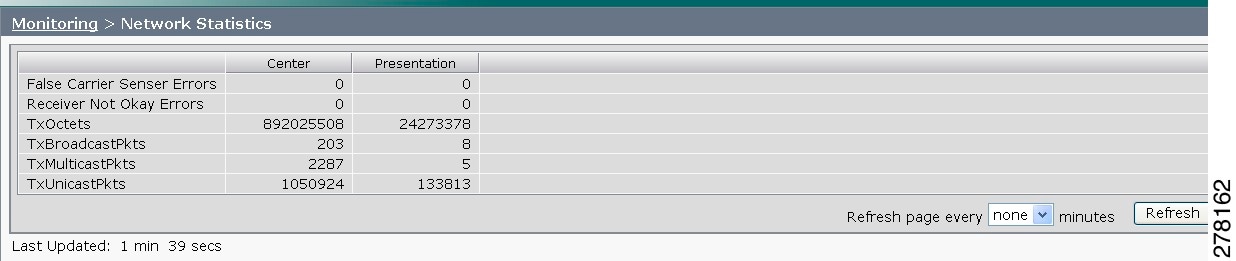
Step 2![]() Look for error counters that have been incremented since the last time you viewed these statistics. Statistic types include the following:
Look for error counters that have been incremented since the last time you viewed these statistics. Statistic types include the following:
- False Carrier Sensor Errors
- Receiver Not Okay Errors
- Number of TxOctets
- Number of TxBroadcastPkts
- Number of TxMulticastPkts
- Number of TxUnicastPkts
Step 3![]() Set an interval for updating these reports by choosing the time from the
Refresh
drop-down menu. Choices, in minutes, include the following:
Set an interval for updating these reports by choosing the time from the
Refresh
drop-down menu. Choices, in minutes, include the following:
Step 4![]() Click
Refresh
to update the statistics immediately.
Click
Refresh
to update the statistics immediately.
Where to Go Next
For more information about system statistics and messages, including System Operations (Sysop) Log messages see the Cisco TelePresence System Message Guide on Cisco.com.
 Feedback