- Preface
- Introduction to Cisco EnergyWise Orchestrator
- Managing Administrative Groups
- Security and Permissions in the Orchestrator System
- Managing and Viewing Devices
- Managing Policies
- Waking Computers
- Viewing Reports
- Getting Diagnostic Information from Event Logs
- Sustainability Dashboard
- Troubleshooting
- Important Notice
Getting Diagnostic Information from Event Logs
Clients report end-user and power-state actions in log files, which you can display from the Administrator console. Each logged action is referred to as an event. You can use event logs to determine whether policies are effective and to detect and resolve errors.
•![]() Specifying Server Logging Levels and File Sizes
Specifying Server Logging Levels and File Sizes
•![]() Displaying Event Data in the Administrator Console
Displaying Event Data in the Administrator Console
Data Tention in Device Logs
Event Categories and Types
When you see data logged from system or user activity, you can filter it to select a specific event category. The view is broken down by event types for the selected category. Event types represent the specific actions or errors that occurred, such as power-state changes to sleep or wake, a user action that delayed a power-state change, and so on.
The following table lists the event categories and describes the event types logged under each.
If you want to make the event report display more detail, you can combine the event category filter with any of the other standard filters for searching. For example, see successful transitions for a particular policy or user actions in a particular device group or subnet.
Data Retention
The historical period for which you can report on events depends upon a variety of system factors: the number of devices being managed, the reporting interval, the database server hardware, and so on. They determine the rate at which events are generated and the speed at which the database processes large numbers of events.
Under reasonable circumstances, you should be able to see events for 2 to 7 months in the past. However, you might need to trim the data sooner to achieve acceptable performance.
The Orchestrator database contains a table for all events and a separate table for PC power state and user activity events. The latter events are kept for a longer time than error events. Error events are generally used for troubleshooting and resolved relatively shortly after a problem occurs.
Log File Locations
The PC client agent logs event data to a file called PwrMgrService.log in the Orchestrator program directory on the client computer C:\Program Files\Cisco Systems\EnergyWise Orchestrator Agent\Logs.
On 64-bit versions of Windows, Orchestrator Agent folders and files are under Program Files (x86).
Server File Locations
Table 8-2 lists the locations in which you can find log files that contain status and diagnostic information for the Orchestrator server components.
When a new log file is created, the date is appended to the existing log file name, for example, PMPWebService.yyyy.mm.dd.log. The most current log takes the base file name.

Note ![]() The Sustainability Dashboard does not create log files.
The Sustainability Dashboard does not create log files.
Specifying Server Logging Levels and File Sizes
This procedure contains steps for settings for server logging level and log file size, to set policy default settings or override the defaults in individual policies.
Step 1 ![]() In the Administrator console, click the Policies menu button bar.
In the Administrator console, click the Policies menu button bar.
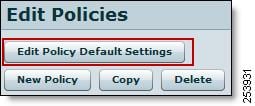
Step 2 ![]() On the Manage Policies page, click Edit Policy Default Settings.
On the Manage Policies page, click Edit Policy Default Settings.
Step 3 ![]() On the Data Collection tab, select the default logging level that you want for all policies that you create.
On the Data Collection tab, select the default logging level that you want for all policies that you create.
•![]() Info—Informational messages, warning messages, and error messages
Info—Informational messages, warning messages, and error messages
•![]() Warning—Warning and error messages
Warning—Warning and error messages
•![]() Error—Only error messages
Error—Only error messages
•![]() Trace—The most verbose and frequent logging
Trace—The most verbose and frequent logging
•![]() Debug—A level of logging to use to troubleshoot a particular issue. Only use this on a small set of clients at a time and only under the direction of a Technical Support representative.
Debug—A level of logging to use to troubleshoot a particular issue. Only use this on a small set of clients at a time and only under the direction of a Technical Support representative.
Step 4 ![]() Select the remaining device log file and data settings.
Select the remaining device log file and data settings.
To access these settings in an individual policy, on the Policies menu, choose Manage Policies, and click the Data Collection tab (Figure 8-1). Clear the Inherit policy default settings check box, and specify the log settings.
Figure 8-1 Data Collection Tab

When you change policy default settings, all policies that you create after the change inherit those settings by default. If you want a policy to have its own wake or data collection settings, you can change those settings within the policy itself.
Note ![]() If you change these settings in an individual policy, it does not inherit future changes that you make to the policy defaults.
If you change these settings in an individual policy, it does not inherit future changes that you make to the policy defaults.
Displaying Event Data in the Administrator Console
You can see client agent activity in a summary report, see a list of devices by event, or see events by event type. You can use search filters to fine-tune the data, for example, to see events only in a particular administration group, events to which a particular policy is assigned, and so on.
1. ![]() In the Administrator console, on the Reports menu, click Events Summary Report.
In the Administrator console, on the Reports menu, click Events Summary Report.
A chart appears, showing events from all event categories, by hour, over the past day. Charts represent the event categories, graphs represent the number of events, and lines represent event categories.

2. ![]() To fine-tune the data shown or see the same data differently, choose any process or a combination:
To fine-tune the data shown or see the same data differently, choose any process or a combination:
Variations and Tips
To analyze power-state transitions for one specific device, enter the device name in the Search box, and enter the start and end dates.
See changes by day for a larger set of devices or for longer date ranges. Click column headings to sort by other parameters.
Search Phrase Tips
Search phrases that you enter are not case sensitive.
Orchestrator returns results that contain the search string. Wildcard characters * and ? are processed as text characters, not as wildcards.
For information about seeing devices in the Administrator console, see the "Viewing Devices and Attributes" section on page 4-14.
 Feedback