- New and Changed Information
- Preface
- Overview
- Installing and Launching the DCNM Server
- Installing and Launching the DCNM Client
- Using the DCNM Client
- Administering DCNM Authentication Settings
- Administering Device Discovery
- Administering Devices and Credentials
- Administering DCNM Licensed Devices
- Working with Topology
- Managing Events
- Working with Inventory
- Configuring SPAN
- Managing Device Operating Systems
- Working with Configuration Change Management
- Administering Auto-Synchronization with Devices
- Administering Statistical Data Collection
- Administering DCNM Server Log Settings
- Maintaining the DCNM Database
- Troubleshooting DCNM
Managing Events
This chapter describes how to use the Event Browser and feature-specific Events tabs in Cisco Data Center Network Manager (DCNM).
Information About Events
Cisco DCNM allows you to view and manage recent status events. An event can be either of the following:
- A status-related system message that Cisco DCNM retrieves from managed devices. For more information, see the “Logfile Requirements” section.
- A message generated by the Cisco DCNM server.
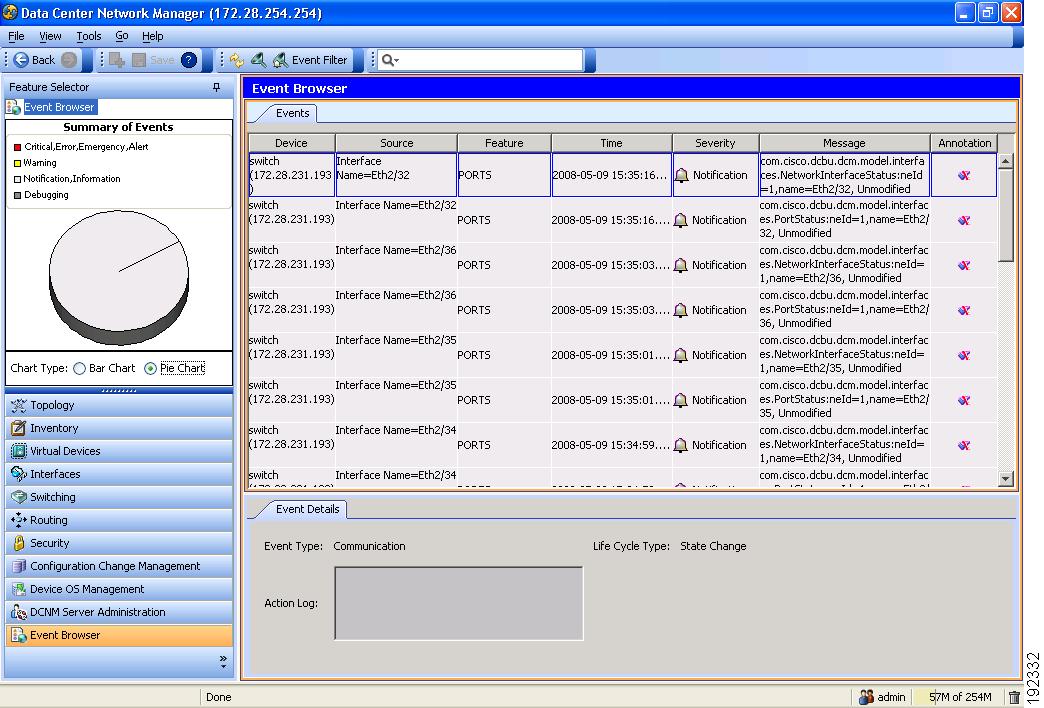
The Cisco DCNM client includes the Event Browser and feature-specific Events tabs that appears in the Details pane for features that can have events. The Event Browser shows all recent status events while a feature-specific Events tab shows recent status events that pertain to the feature. The Cisco DCNM client updates the Event Browser and Events tabs dynamically when it receives new events from the server.
In the Event Browser and on Events tabs, you can change the status of an event, add notes to an event, or delete an event.
In addition, the Event Browser provides a pie chart and a bar chart of events separated by the event severity. You can also delete individual events from the events database.
To control the minimum severity of event messages, you configure the logging level for Cisco NX-OS features and for Cisco DCNM server features. For more information, see the “Cisco NX-OS System-Message Logging Requirements” section.

Note Cisco DCNM has minimum logging level requirements for managed Cisco NX-OS devices. Logging levels on a managed device should never be lower than the minimum requirements.
For more information about Cisco DCNM server logging levels, see Chapter17, “Administering DCNM Server Log Settings”
Note Configuring Cisco DCNM server log settings does not affect logging levels on managed Cisco NX-OS devices.
Licensing Requirements for the Event Browser
The following table shows the licensing requirements for this feature:
The Event Browser requires no license. Any feature not included in a license package is bundled with the Cisco DCNM and is provided at no charge to you. For information about obtaining and installing a Cisco DCNM LAN Enterprise license, see the “Installing Licenses” section. |
Guidelines and Limitations
The Event Browser has the following configuration guidelines and limitations:
- The Event Browser and feature-specific Events tabs display only status events, which are events generated when the status of a feature or object changes. For example, configuration events do not appear in the Event Browser or on an Events tab.
- The Event Browser can display event messages that are no older than 24 hours when you start the Cisco DCNM client. By default, the Cisco DCNM client fetches from the server messages that are no older than 1 hour.
- The Event Browser can display up to 2000 events. The events database is limited by the amount of space available to the database.
- You cannot use Cisco DCNM to control the logging levels of managed Cisco NX-OS devices. For more information, see the “Cisco NX-OS System-Message Logging Requirements” section.
- We recommend that you delete events that you no longer need or that you have resolved. For information about deleting old events from the events database, see the “Deleting Data from the Events Database” section.
Using the Event Browser and Events Tabs
Figure 10-1 shows the Event Browser content pane.
Figure 10-1 Event Browser Content Pane
This section includes the following topics:
- Viewing the Event Browser
- Applying and Removing an Event Filter
- Viewing Events on an Events Tab
- Changing the Status of an Event
- Adding a Note to One or More Events
- Deleting an Event
Viewing the Event Browser
You can use the Event Browser to view recent events and a summary chart of those events. By default, the Event Browser shows events that occurred up to 1 hour prior to starting the Cisco DCNM client. For more information, see the “Configuring the Maximum Age of Events Fetched from the Server” section.
DETAILED STEPS
To view the Event Browser, follow these steps:
Step 1 From the Feature Selector pane, choose Event Browser .
The event table appears in the Contents pane. A summary chart appears above the Feature Selector pane.
Step 2 (Optional) If you want to change the summary chart that appears, above the Feature Selector, choose one of the following Chart Type options, as needed:
The colors of the chart correspond to event severity levels, as indicated in the legend that appears above the chart.
Step 3 (Optional) If you want to sort or filter events, you can use one or more of the filtering features as described in the following table:
Step 4 (Optional) If you want to view details about a specific event, follow these steps:
a. Find the event in the event list.
c. Expand the Details pane, if necessary.
Details about the selected event appear in the Details pane.
d. (Optional) To read notes and messages about status changes to the event, read the information in the Action Log field.
Applying and Removing an Event Filter
You can filter events in the Event Browser by the following criteria:
- Event date and time—By default, the Cisco DCNM client displays all events received after you started the Cisco DCNM client and for a configurable number of hours prior to starting the Cisco DCNM client (for more information, see the “Configuring the Maximum Age of Events Fetched from the Server” section).
- Event severity—By default, the Cisco DCNM client displays events of all severities.
Note When you apply an event filter, the Events tab continues to display events when the Cisco DCNM server receives them. The filter criteria that you select only affect the Filtered Events tab.
BEFORE YOU BEGIN
If the message “Filter Applied” appears at the top of the Contents pane, the Cisco DCNM client is applying an event filter to the Event Browser.
DETAILED STEPS
To apply or remove an event filter in the Event Browser, follow these steps:
Step 1 View events in the Event Browser (see the “Viewing the Event Browser” section).
Step 2 If you want to apply an event filter, follow these steps:
a. From the menu bar, choose View > Event Filter .
b. Check the Apply Filter check box.
c. Configure the filter criteria.
A Filtered Events tab appears in the Event Browser. The tab displays the events that match the filtering criteria that you specified. The message “Filter Applied” appears at the top of the Contents pane.
Step 3 If you want to remove an event filter, follow these steps:
a. From the menu bar, choose View > Event Filter .
b. Uncheck the Apply Filter check box.
The Filtered Events tab disappears. No message appears at the top of the Contents pane.
Viewing Events on an Events Tab
You can view feature-specific events on the Events tab that appears in the Details pane for a feature. By default, an Events tab shows events received up to 1 hour prior to starting the Cisco DCNM client. For more information, see the “Configuring the Maximum Age of Events Fetched from the Server” section.
BEFORE YOU BEGIN
Typically, the Events tab appears when, in the Summary pane, you select an object that can have events associated with it. For example, if you select Interfaces > Physical > Ethernet from the Feature Selector pane, the Summary pane displays devices. Devices contain slots, and slots contain Ethernet ports. When you select a device, slot, or port, the Details pane displays an Events tab.
What you select in the Summary pane affects which events are shown in the tab. Continuing the Ethernet interface example, the scope of the events in the Events tab depends on what you select, as follows:
DETAILED STEPS
To view an event on an Events tab, follow these steps:
Step 1 From the Feature Selector pane, choose the feature for which you want to view events.
For example, choose Interfaces > Physical > Ethernet .
Step 2 From the Summary pane, select an object.
The Events tab appears in the Details pane. In the Events tab, the events table appears.
Note If no Events tab appears, then Cisco DCNM cannot display events for the object you selected.
Step 3 (Optional) If you want to sort or filter events, you can use one or more of the filtering features as described in the following table:
Step 4 (Optional) If you want to view details about a specific event, follow these steps:
a. Find the event in the event list.
c. Expand the Details pane, if necessary.
Details about the selected event appear in the Details pane.
d. (Optional) To read notes and messages about status changes to the event, read the information in the Action Log field.
Changing the Status of an Event
You can change the status of an event to one of the following statuses:
By default, the status of new event is Open, which is indicated in the Annotation column by a green check mark with a red slash across it.
BEFORE YOU BEGIN
Select an event in the Event Browser or on an Events tab for a specific feature. For more information, see the “Viewing the Event Browser” section or the “Viewing Events on an Events Tab” section.
DETAILED STEPS
Step 1 In the event table, right-click the selected event.
Step 2 Choose Acknowledge or Open , as needed.
The new status appears in the Annotation column for the selected event.
In the Details pane, the message about the status change appears in the Action Log field.
Adding a Note to One or More Events
You can add a note to one or more events. Notes can contain 1 to 1000 characters.
BEFORE YOU BEGIN
Find the events to which you want to add a note. For more information, see the “Viewing the Event Browser” section or the “Viewing Events on an Events Tab” section.
DETAILED STEPS
To add a note to one or more events, follow these steps:
Step 1 Select one or more events. Do one of the following:
Step 2 On one of the selected events, right-click and then choose Add Notes .
Step 3 Enter the note. You can enter up to 1000 case-sensitive, alphanumeric characters.
The note appears in the Action Log field for each selected event.
Deleting an Event
You can delete one or more events from the Event Browser or a feature-specific Events tab. A deleted event no longer appears in the Event Browser or on a feature-specific Events tab; however, the event remains in the events database.
For information about deleting old events from the events database, see the “Deleting Data from the Events Database” section.
BEFORE YOU BEGIN
Select an event in the Event Browser or on an Events tab for a specific feature. For more information, see the “Viewing the Event Browser” section or the “Viewing Events on an Events Tab” section.
DETAILED STEPS
Step 1 In the event table, select one or more events that you want to delete.
Note To select more than one event, you can click and drag across the events or you can press and hold Ctrl and click each event.
Step 2 Right-click a selected event.
The selected events disappear from the Event Browser.
Field Descriptions for Events
This section includes the following field descriptions for Events:
Events Table
The events table appears in the Event Browser and on feature-specific Events tabs.
Event Details
Event details appear below the events table in the Event Browser and on feature-specific Events tabs.
Feature History for the Event Browser and Events Tabs
Table 10-3 lists the release history for this feature.
 Feedback