-
Cisco MDS 9000 Family Fabric Manager User Guide, Release 1.0(2a)
-
Index
-
Preface
-
Getting Started with Cisco Fabric Manager
-
Using Cisco MDS 9000 Family Fabric Manager Views
-
Managing Zones and Zone Sets
-
Managing VSANs
-
Managing Administrator Access
-
Managing Software and Configuration Files
-
Managing Interfaces
-
Managing the System and Components
-
Managing Fibre Channel Routing and FSPF
-
Managing Advanced Features
-
Managing Events and Alarms
-
Business Reply Thing
-
 Feedback
Table Of Contents
Configuring Event Destinations
Enabling RMON Alarms for VSANs
Enabling RMON Alarms for Physical Components
Managing RMON Alarms and Events
Managing RMON Event Severity Levels
Configuring the Call Home Feature
Configuring Call Home Attributes
Configuring Call Home Destination Attributes
Configuring Call Home E-Mail Addresses
Configuring Call Home Profiles
Managing Events and Alarms
By configuring how events are reported, you can monitor those events more effectively and take corrective action, if necessary. Cisco Fabric Manager provides the following features for reporting and responding to network events:
•
SNMP events—These are preconfigured notifications, including SNMPv2 traps and SNMPv3 informs.
•
•
•
Note
This chapter describes how to configure events using the Fabric Manager and Device Manager. For information about events and configuring them using the command-line interface (CLI), refer to the Cisco 9000 Family Configuration Guide.
This chapter includes the following sections:
•
•
Managing Events
This section describes how to manage events and includes the following topics:
•
Viewing the Events Log
To view the events log from the Device Manager, choose SNMP Log from the Events menu. The Events Log dialog box displays a log of events for a single switch and shows the display-only information described in Table 8-1.
To manage the SNMP log, choose SNMP Log from the Events menu and click the Controls tab. The Controls tab provides summary statistics about the SNMP log and allows you to change the default settings for the log.
The dialog box shows the display-only information described in Table 8-2.
Table 8-3 describes the configurable attributes for the SNMP log.
Caution
Configuring Event Destinations
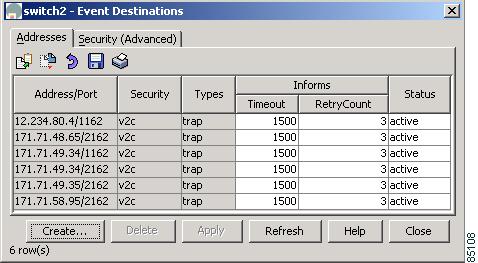
Cisco MDS 9000 Family switches, like other SNMP-enabled devices, send events (traps and informs) to configurable destinations, called trap receivers in SNMPv2. To configure event destinations from the Fabric Manager, choose Events > Destinations on the menu tree. To configure event destinations from the Device Manager, choose Destinations from the Events menu.
The dialog box from the Fabric Manager displays event destination information for multiple switches. Figure 8-1 shows the dialog box with the Addresses tab selected from the Device Manager. This dialog box displays event destinations for a single switch.
Figure 8-1 Events > Destinations Dialog Box, Device Manager
Both dialog boxes show the display-only information described in Table 8-4.
Table 8-5 describes the configurable attributes for event destinations.
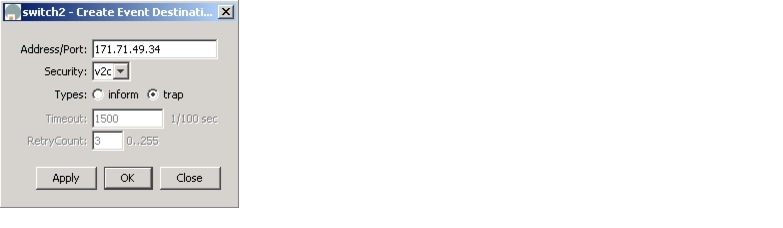
To create an event destination, click Create on the Device Manager dialog box or click the Create Row button on the Fabric Manager toolbar.
From Device Manager, you see the dialog box shown in Figure 8-2.
Figure 8-2 Create Destinations Dialog Box, Device Manager
The dialog box from the Fabric Manager lets you select a switch.
The Timeout option lets you specify the length of time in 1/100 seconds that the system should wait to make a connection. The Retry Count option lets you specify how many times the system should retry.
See Table 8-4 for information about the other fields on this dialog box.
Complete the fields and click Apply to create the event destination or click OK to create the destination and close the window.
Configuring Event Security
Caution
To configure event security from the Fabric Manager, choose Events > Security on the menu tree. To configure event security from the Device Manager, choose Destinations from the Events menu and click the Security tab.
The dialog box from the Fabric Manager displays event security information for multiple switches. The dialog box from Device Manager displays event security for a single switch.
Both dialog boxes show the display-only information described in Table 8-6.
Table 8-7 describes the configurable security attributes for event destinations.
Configuring Event Filters
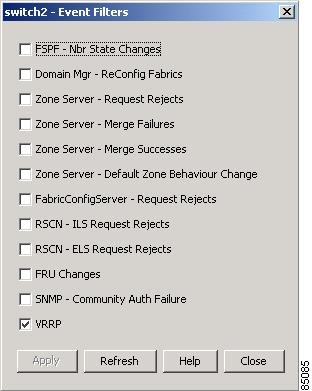
To configure event filters from the Fabric Manager, choose Events > FC Filters or Other Filters on the menu tree. To configure event filters from the Device Manager, choose Filters from the Events menu.
Figure 8-3 shows the Event Filters dialog box from the Device Manager, which displays event filters for a single switch. Fabric Manager displays two different dialog boxes, which list the same event filters for multiple switches, in different order.
Figure 8-3 Event Filters Dialog Box
To configure event filters, check the check box next to the appropriate filter name. The event filters are described in Table 8-8.
Enabling RMON Alarms
This section describes how to define and enable preconfigured RMON alarms and includes the following topics:
•
•
The "Managing RMON Alarms and Events" section provides information about changing the default controls for RMON alarms, viewing the alarm events that have been defined, defining custom event severity levels, and viewing the event log.
Enabling RMON Alarms by Port
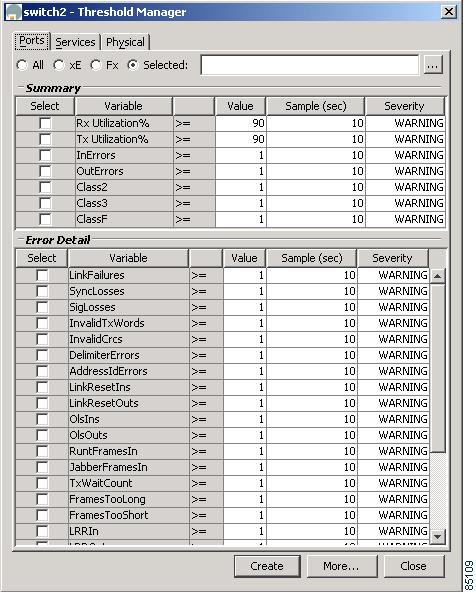
To enable alarm notifications by port from the Device Manager, choose Threshold Manager from the Events menu and click the Ports tab. (See Figure 8-4.)
Figure 8-4 RMON Threshold Manager, Ports Tab
To configure an RMON alarm for one or more ports, follow these steps:
Step 1
a.
b.
c.
Alternatively, click the appropriate radio button to select ports by type:
•
•
•
Step 2
Step 3
Step 4
Step 5
•
•
•
•
•
Step 6
Step 7
If you do not confirm the operation, the system only defines a log event.
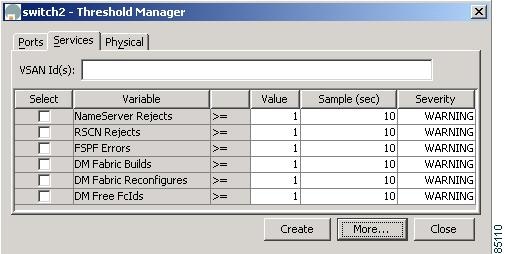
Enabling RMON Alarms for VSANs
To manage RMON alarm service attributes for selected VSANs from the Device Manager, choose Threshold Manager from the Events menu and click the Services tab. Figure 8-5 shows the Threshold Manager dialog box with the Services tab selected.
Figure 8-5 Threshold Manager, Services Tab
To enable an RMON alarm for one or more VSANs, follow these steps:
Step 1
Step 2
Step 3
Step 4
Step 5
Step 6
Step 7
If you do not confirm the operation, the system only defines a log event.
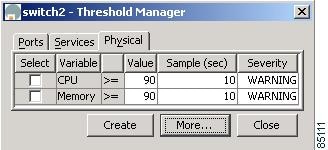
Enabling RMON Alarms for Physical Components
To configure RMON alarm physical attributes from the Device Manager, choose Threshold Manager from the Events menu and click the Physical tab. Figure 8-6 shows the Create RMON Alarms dialog box with the Physical tab selected.
Figure 8-6 Threshold Manager, Physical Tab
To configure an RMON alarm for a physical component, follow these steps:
Step 1
Step 2
Step 3
Step 4
•
•
•
•
•
Step 5
Step 6
If you do not confirm the operation, the system only defines a log event.
Managing RMON Alarms and Events
This section describes changing the default controls for RMON alarms, viewing the alarm events that have been defined, defining custom event severity levels, and viewing the event log. It includes the following topics:
•
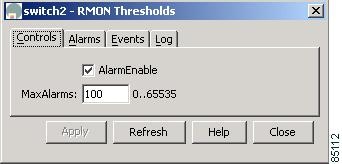
Configuring RMON Controls
To change the default controls for RMON alarms, choose Threshold Manager from the Device Manager menu. You see the Threshold Manager window shown earlier in Figure 8-4.
Click More on the Threshold Manager window. You see the dialog box shown in Figure 8-7.
Figure 8-7 RMON Thresholds Controls Dialog Box
Table 8-9 describes the configurable attributes for RMON controls.
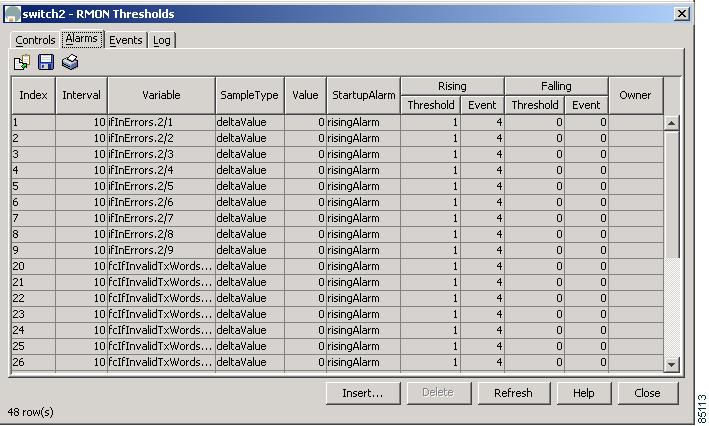
Managing RMON Alarms
To view the alarms that have already been enabled, choose Threshold Manager from the Events menu and click the More button on the Threshold Manager dialog box. Then click the Alarms tab. You see the dialog box shown in Figure 8-8.
Figure 8-8 RMON Thresholds—Alarms Tab
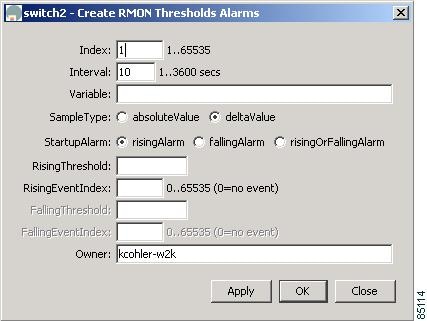
To create a customized threshold entry, click the Create button. You see the dialog box shown in Figure 8-9.
Figure 8-9 Create RMON Thresholds Alarms
The dialog boxes show the display-only information described in Table 8-10.
Table 8-11 describes the configurable attributes for RMON alarm thresholds.
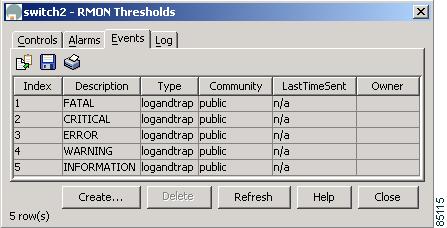
Managing RMON Event Severity Levels
To define customized RMON event severity levels, select Threshold Manager from the Events menu and click More on the Threshold Manager dialog box. Then click the Events tab on the RMON Thresholds dialog box. You see the dialog box shown in Figure 8-10.
Figure 8-10 RMON Thresholds Events Tab
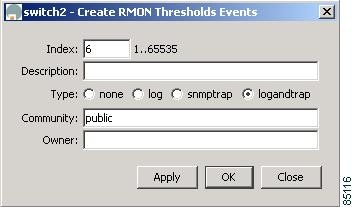
To create a new threshold entry, click the Create button. You see the dialog box shown in Figure 8-11.
Figure 8-11 Create RMON Thresholds Events
Table 8-12 describes the attributes for RMON event thresholds.
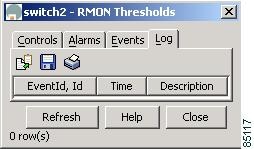
Viewing the RMON Log
To view the RMON log from the Device Manager, select Threshold Manager from the Events menu and click More on the Threshold Manager dialog box. Then click the Log tab on the RMON Thresholds dialog box. You see the dialog box shown in Figure 8-12.
Figure 8-12 Events > RMON Alarms > Logs Dialog Box, Fabric Manager
The RMON Log dialog box shows the display-only information described in Table 8-13.
Configuring the Call Home Feature
This section describes how to configure the Call Home feature, which automatically sends e-mail notifications in response to configurable events. This section includes the following topics:
•
•
•
•
Overview of Features
You can use Call Home for direct paging of a network support engineer, E-mail notification to a Network Operations Center, and utilization of Cisco AutoNotify services for direct case generation with the Technical Assistance Center. Call Home provides the following features:
•
•
•
–
–
–
•
•
Configuration Overview
When configuring Call Home, keep the following points in mind:
•
•
•
•
To configure Call Home, use the different tabs on the Call Home dialog box, as summarized below:
Step 1
Step 2
Step 3
Step 4
Configuring Call Home Attributes
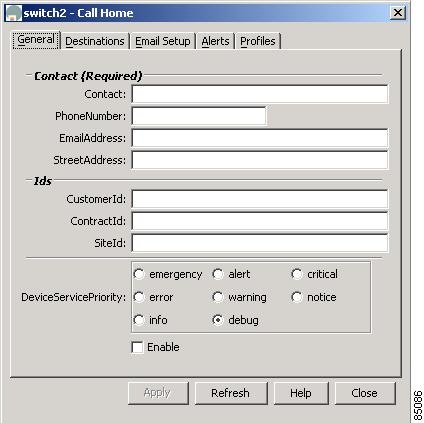
To assign contact information and enable the Call Home feature from the Fabric Manager, choose Events > Call Home > General on the menu tree. To assign contact information and enable the Call Home feature from the Device Manager, choose Call Home from the Events menu and click the General tab.
Figure 8-13 shows the dialog box with the General tab selected from the Device Manager. This view displays Call Home attributes for a single switch. The dialog box from the Fabric Manager displays Call Home information for multiple switches.
Figure 8-13 Events > Call Home Dialog Box, Device Manager
Both dialog boxes provide the display-only information described in Table 8-14.
Table 8-14 describes the attributes for the Call Home feature.
Configuring Call Home Destination Attributes
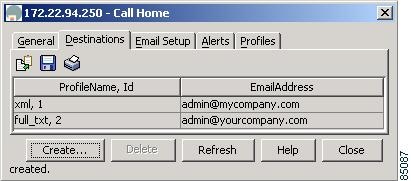
To configure the destination e-mail addresses for Call Home notifications, choose Events > Call Home > Destinations on the menu tree. To configure the destination e-mail addresses from the Device Manager, choose Call Home from the Events menu and click the Destination tab.
The dialog box from the Fabric Manager displays Call Home information for multiple switches. Figure 8-14 shows the dialog box with the Destinations tab selected from the Device Manager. This view displays Call Home attributes for a single switch.
Figure 8-14 Events > Call Home > Destination Dialog Box, Device Manager
Table 8-15 describes the Destinations attributes for the Call Home feature.
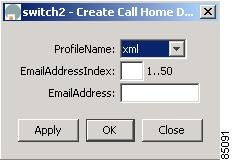
To create a new Call Home destination, follow these steps:
Step 1
From the Device Manager, you see the dialog box shown in Figure 8-15.
Figure 8-15 Create Call Home Destination
From the Fabric Manager, you can select one or more switches to which the configuration applies.
Step 2
Step 3
Step 4
Step 5
Configuring Call Home E-Mail Addresses
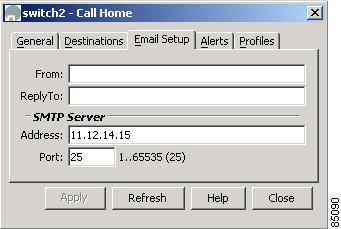
To identify your SMTP server from the Fabric Manager, choose Events > Call Home > Email Setup on the menu tree. To identify your SMTP server from the Device Manager, choose Call Home from the Events menu and click the Email Setup tab.
The dialog box from the Fabric Manager displays Call Home information for multiple switches. Figure 8-16 shows the dialog box with the EmailAddresses tab selected from the Device Manager. This view displays Call Home attributes for a single switch.
Figure 8-16 Events > Call Home > Email Setup Dialog Box, Device Manager
Table 8-16 describes the configurable e-mail setup attributes for the Call Home feature.
Configuring Call Home Alerts
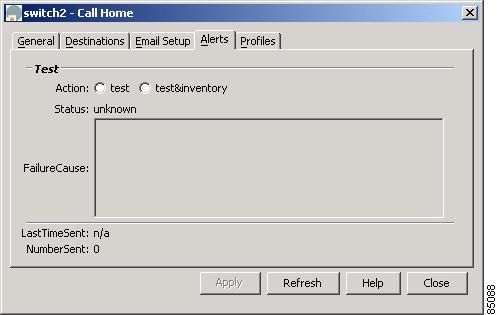
To test Call Homefrom the Fabric Manager, choose Events > Call Home > Alerts on the menu tree. To test Call Home from the Device Manager, choose Call Home from the Events menu and click the Alerts tab.
The dialog box from the Fabric Manager displays Call Home information for multiple switches. Figure 8-17 shows the dialog box with the Alerts tab selected from the Device Manager. This view displays Call Home attributes for a single switch.
Figure 8-17 Events > Call Home > Alerts Dialog Box, Device Manager
Both dialog boxes show the display-only information described in Table 8-17.
Table 8-18 describes the configurable alert attributes for the Call Home feature.
Table 8-18 Events > Call Home > Alerts—Configurable Attributes
Test
Specifies the type of test:
•
•
Configuring Call Home Profiles
To configure Call Home attributes from the Fabric Manager, choose Events > Call Home > Profiles on the menu tree. To configure Call Home attributes from the Device Manager, choose Call Home from the Events menu and click the Profiles tab.
The dialog box from the Fabric Manager displays Call Home information for multiple switches. Figure 8-18 shows the dialog box with the Alerts tab selected from the Device Manager. This view displays Call Home attributes for a single switch.
Figure 8-18 Events > Call Home > Profiles Dialog Box, Device Manager
Both dialog boxes show the display-only information described in Table 8-19.
Table 8-20 describes the configurable profile attributes for the Call Home feature.
Table 8-20 Call Home > Profiles—Configurable Attributes
MaxMsgSize
Specifies the maximum size of the Call Home message.
Configuring the Syslog
This section describes how to configure the syslog and includes the following topics:
•
•
Configuring Syslog Attributes
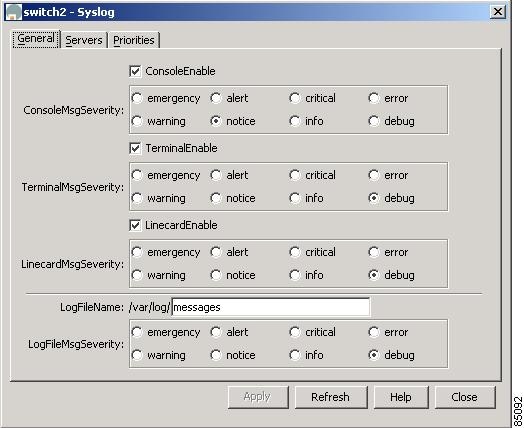
To configure syslog attributes from the Fabric Manager, choose Events > Syslog > General on the menu tree. To configure syslog attributes from the Device Manager, choose Syslog from the Events menu and click the General tab.
The dialog box from the Fabric Manager displays syslog information for multiple switches. Figure 8-19 shows the Syslog dialog box with the General tab selected from the Device Manager. This view displays syslog information for a single switch.
Figure 8-19 Events > Syslog > General Dialog Box, Device Manager
The Fabric View dialog box shows the display-only information described in Table 8-21.
Table 8-21 Events > Syslog > General—Display-Only Attributes
Switch
Displays the switch ID. This attribute is only displayed from the Fabric Manager.
Table 8-22 describes the configurable general attributes for the syslog.
Configuring Syslog Servers
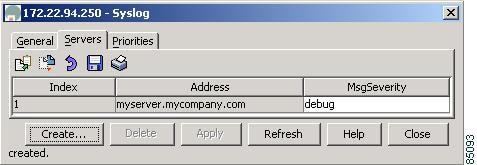
To configure syslog attributes from the Fabric Manager, choose Events > Syslog > Servers on the menu tree. To configure syslog servers from the Device Manager, choose Syslog from the Events menu and click the Servers tab.
The dialog box from the Fabric Manager displays syslog information for multiple switches. Figure 8-20 shows the Syslog dialog box with the Servers tab selected from the Device Manager. This view displays syslog information for a single switch.
Figure 8-20 Events > Syslog > Servers Dialog Box, Device Manager
Both dialog boxes show the display-only information described in Table 8-23.
Table 8-23 Events > Syslog > Servers—Display-Only Attributes
Switch
Displays the switch ID. This attribute is only displayed from the Fabric Manager.
Table 8-24 describes the configurable server attributes for the syslog.
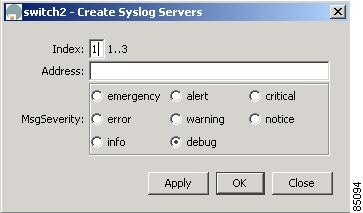
To add a syslog server, click Create. You see the dialog box shown in Figure 8-21.
Figure 8-21 Create Syslog Servers
Complete the fields on this dialog box and click OK.
Configuring Syslog Priorities
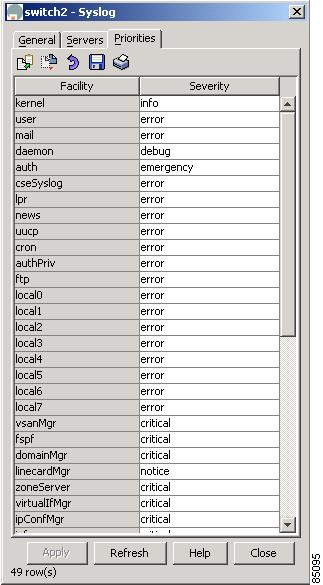
To configure syslog priorities from the Device Manager, choose Syslog from the Events menu and click the Priorities tab. To configure syslog attributes from the Fabric Manager, choose Events > Syslog > Priorities on the menu tree.
Figure 8-22 shows the Syslog dialog box with the Servers tab selected from the Device Manager. This view displays syslog information for a single switch. The dialog box from the Fabric Manager displays syslog information for multiple switches.
Figure 8-22 Events > Syslog > Priorities Dialog Box, Device Manager
Both dialog boxes show the display-only information described in Table 8-25.
Table 8-26 describes the configurable priorities for the syslog.