- Preface
- New and Changed Information in Release 4.3.x
- Preconfiguring Physical Interfaces on Cisco IOS XR Software
- Configuring ATM Interfaces on Cisco IOS XR Software
- Advanced Configuration and Modification of the Management Ethernet Interface on Cisco IOS XR Software
- Configuring Ethernet Interfaces on Cisco IOS XR Software
- Configuring Ethernet OAM on Cisco IOS XR Software
- Configuring Link Bundling on Cisco IOS XR Software
- Configuring Virtual Loopback and Null Interfaces on Cisco IOS XR Software
- Configuring Channelized SONET/SDH on Cisco IOS XR Software
- Configuring Circuit Emulation over Packet on Cisco IOS XR Software
- Configuring Clear Channel SONET Controllers on Cisco IOS XR Software
- Configuring Clear Channel T3/E3 and Channelized T3 and T1/E1 Controllers on Cisco IOS XR Software
- Configuring POS Interfaces on Cisco IOS XR Software
- Configuring Serial Interfaces on Cisco IOS XR Software
- Configuring Frame Relay on Cisco IOS XR Software
- Configuring PPP on Cisco IOS XR Software
- Configuring 802.1Q VLAN Interfaces on Cisco IOS XR Software
- Configuring Tunnel Interfaces on Cisco IOS XR Software
- Index
- Contents
- Prerequisites for Configuring Ethernet OAM
- Restrictions for Configuring Ethernet OAM
- Information About Configuring Ethernet OAM
- Configuring Ethernet Link OAM
- Configuring Ethernet CFM
- Configuring a CFM Maintenance Domain
- Configuring Services for a CFM Maintenance Domain
- Enabling and Configuring Continuity Check for a CFM Service
- Configuring Automatic MIP Creation for a CFM Service
- Configuring Cross-Check on a MEP for a CFM Service
- Configuring Other Options for a CFM Service
- Configuring CFM MEPs
- Configuring Y.1731 AIS
- Configuring EFD for a CFM Service
- Verifying the CFM Configuration
- Troubleshooting Tips
- Configuring Ethernet SLA
- Ethernet SLA Configuration Guidelines
- Configuring an SLA Operation Profile
- Configuring SLA Probe Parameters in a Profile
- Configuring SLA Statistics Measurement in a Profile
- Configuring a Schedule for an SLA Operation Probe in a Profile
- Configuring an SLA Operation
- Configuring an On-Demand SLA Operation
- Verifying SLA Configuration
- Configuration Examples for EOAM Interfaces
- Configuring an Ethernet OAM Profile Globally: Example
- Configuring Ethernet OAM Features on an Individual Interface: Example
- Configuring Ethernet OAM Features to Override the Profile on an Individual Interface: Example
- Clearing Ethernet OAM Statistics on an Interface: Example
- Enabling SNMP Server Traps on a Router: Example
- Configuration Examples for Ethernet CFM
- Ethernet CFM Domain Configuration: Example
- Ethernet CFM Service Configuration: Example
- Continuity Check for an Ethernet CFM Service Configuration: Example
- MIP Creation for an Ethernet CFM Service Configuration: Example
- Cross-check for an Ethernet CFM Service Configuration: Example
- Other Ethernet CFM Service Parameter Configuration: Example
- MEP Configuration: Example
- Ethernet CFM Show Command: Examples
- AIS for CFM Configuration: Examples
- AIS for CFM Show Commands: Examples
- EFD Configuration: Examples
- Displaying EFD Information: Examples
- Configuration Examples for Ethernet SLA
- Ethernet SLA Profile Type Configuration: Examples
- Ethernet SLA Probe Configuration: Examples
- Profile Statistics Measurement Configuration: Examples
- Scheduled SLA Operation Probe Configuration: Examples
- Ethernet SLA Operation Probe Scheduling and Aggregation Configuration: Example
- Ongoing Ethernet SLA Operation Configuration: Example
- On-Demand Ethernet SLA Operation Basic Configuration: Examples
- Ethernet SLA Show Commands: Examples
Configuring Ethernet OAM on Cisco IOS XR Software
This module describes the configuration of Ethernet Operations, Administration, and Maintenance (OAM) on the Cisco XR 12000 Series Router.
Feature History for Configuring Ethernet OAM
Contents
• Prerequisites for Configuring Ethernet OAM
•Restrictions for Configuring Ethernet OAM
•Information About Configuring Ethernet OAM
•How to Configure Ethernet OAM
•Configuration Examples for Ethernet OAM
Prerequisites for Configuring Ethernet OAM
You must be in a user group associated with a task group that includes the proper task IDs. The command reference guides include the task IDs required for each command. If you suspect user group assignment is preventing you from using a command, contact your AAA administrator for assistance.
Before configuring Ethernet OAM, confirm that at least one of the Gigabit Ethernet line cards supported on the router is installed:
•8-Port Fast Ethernet SPA
•2-Port Gigabit Ethernet SPA
•5-Port Gigabit Ethernet SPA
•8-Port Gigabit Ethernet SPA
•10-Port Gigabit Ethernet SPA
•1-Port 10-Gigabit Ethernet SPA
Restrictions for Configuring Ethernet OAM
The following functional areas of Ethernet OAM are not supported on the Cisco XR 12000 Series Router in Cisco IOS XR Release 4.1:
•Remote Loopback
•Symbol period thresholds and window for link monitoring
•Unidirectional link-fault detection
Information About Configuring Ethernet OAM
To configure Ethernet OAM, you should understand the following concepts:
•Ethernet SLA (Y.1731 Performance Monitoring)
Ethernet Link OAM
Ethernet as a Metro Area Network (MAN) or a Wide Area Network (WAN) technology benefits greatly from the implementation of Operations, Administration and Maintenance (OAM) features. Ethernet link OAM features allow Service Providers to monitor the quality of the connections on a MAN or WAN. Service providers can monitor specific events, and take actions on events. Ethernet link OAM operates on a single, physical link and it can be configured to monitor either side or both sides of that link.
Ethernet link OAM can be configured in the following ways:
•A Link OAM profile can be configured, and this profile can be used to set the parameters for multiple interfaces.
•Link OAM can be configured directly on an interface.
When an interface is also using a link OAM profile, specific parameters that are set in the profile can be overridden by configuring a different value directly on the interface.
An EOAM profile simplifies the process of configuring EOAM features on multiple interfaces. An Ethernet OAM profile, and all of its features, can be referenced by other interfaces, allowing other interfaces to inherit the features of that Ethernet OAM profile.
Individual Ethernet link OAM features can be configured on individual interfaces without being part of a profile. In these cases, the individually configured features always override the features in the profile.
The preferred method of configuring custom EOAM settings is to create an EOAM profile in Ethernet configuration mode and then attach it to an individual interface or to multiple interfaces.
The following standard Ethernet Link OAM features are supported on the router:
•Miswiring Detection (Cisco-Proprietary)
Neighbor Discovery
Neighbor discovery enables each end of a link to learn the OAM capabilities of the other end and establish an OAM peer relationship. Each end also can require that the peer have certain capabilities before it will establish a session. You can configure certain actions to be taken if there is a capabilities conflict or if a discovery process times out, using the action capabilities-conflict or action discovery-timeout commands.
Link Monitoring
Link monitoring enables an OAM peer to monitor faults that cause the quality of a link to deteriorate over time. When link monitoring is enabled, an OAM peer can be configured to take action when the configured thresholds are exceeded.
MIB Retrieval
MIB retrieval enables an OAM peer on one side of an interface to get the MIB variables from the remote side of the link. The MIB variables that are retrieved from the remote OAM peer are READ ONLY.
Miswiring Detection (Cisco-Proprietary)
Miswiring Detection is a Cisco-proprietary feature that uses the 32-bit vendor field in every Information OAMPDU to identify potential miswiring cases.
SNMP Traps
SNMP traps can be enabled or disabled on an Ethernet OAM interface.
Ethernet CFM
Ethernet Connectivity Fault Management (CFM) is a service-level OAM protocol that provides tools for monitoring and troubleshooting end-to-end Ethernet services per VLAN. This includes proactive connectivity monitoring, fault verification, and fault isolation. CFM uses standard Ethernet frames and can be run on any physical media that is capable of transporting Ethernet service frames. Unlike most other Ethernet protocols which are restricted to a single physical link, CFM frames can transmit across the entire end-to-end Ethernet network.
CFM is defined in two standards:
•IEEE 802.1ag—Defines the core features of the CFM protocol.
•ITU-T Y.1731—Redefines, but maintains compatibility with the features of IEEE 802.1ag, and defines some additional features.
Ethernet CFM on the Cisco XR 12000 Series Router supports the following functions of ITU-T Y.1731:
•ETH-CC, ETH-RDI, ETH-LB, ETH-LT—These are equivalent to the corresponding features defined in IEEE 802.1ag.

Note The Linktrace responder procedures defined in IEEE 802.1ag are used rather than the procedures defined in Y.1731; however, these are interoperable.
•ETH-AIS—The reception of ETH-LCK messages is also supported.
•ETH-DM—This is supported with the Ethernet SLA feature. For more information about Ethernet SLA, see the "Ethernet SLA (Y.1731 Performance Monitoring)" section.
To understand how the CFM maintenance model works, you need to understand the following concepts and features:
•EFD
Maintenance Domains
A maintenance domain describes a management space for the purpose of managing and administering a network. A domain is owned and operated by a single entity and defined by the set of interfaces internal to it and at its boundary, as shown in Figure 1.
Figure 1 CFM Maintenance Domain
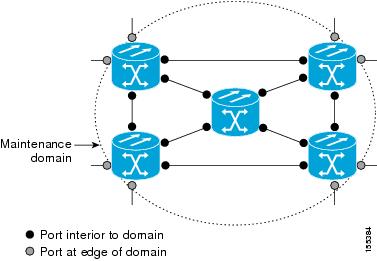
A maintenance domain is defined by the bridge ports that are provisioned within it. Domains are assigned maintenance levels, in the range of 0 to 7, by the administrator. The level of the domain is useful in defining the hierarchical relationships of multiple domains.
CFM maintenance domains allow different organizations to use CFM in the same network, but independently. For example, consider a service provider who offers a service to a customer, and to provide that service, they use two other operators in segments of the network. In this environment, CFM can be used in the following ways:
•The customer can use CFM between their CE devices, to verify and manage connectivity across the whole network.
•The service provider can use CFM between their PE devices, to verify and manage the services they are providing.
•Each operator can use CFM within their operator network, to verify and manage connectivity within their network.
Each organization uses a different CFM maintenance domain.
Figure 2 shows an example of the different levels of maintenance domains in a network.
Note In CFM diagrams, the conventions are that triangles represent MEPs, pointing in the direction that the MEP sends CFM frames, and circles represent MIPs. For more information about MEPs and MIPs, see the "Maintenance Points" section.
Figure 2 Different CFM Maintenance Domains Across a Network
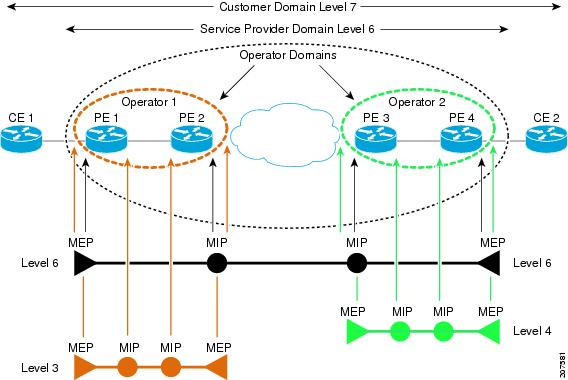
To ensure that the CFM frames for each domain do not interfere with each other, each domain is assigned a maintenance level, between 0 and 7. Where domains are nested, as in this example, the encompassing domain must have a higher level than the domain it encloses. In this case, the domain levels must be negotiated between the organizations involved. The maintenance level is carried in all CFM frames that relate to that domain.
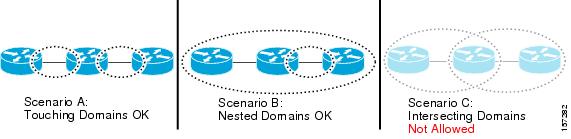
CFM maintenance domains may touch or nest, but cannot intersect. Figure 3 illustrates the supported structure for touching and nested domains, and the unsupported intersection of domains.
Figure 3 Supported CFM Maintenance Domain Structure
Services
A CFM service allows an organization to partition its CFM maintenance domain, according to the connectivity within the network. For example, if the network is divided into a number of virtual LANs (VLANs), a CFM service is created for each of these. CFM can then operate independently in each service. It is important that the CFM services match the network topology, so that CFM frames relating to one service cannot be received in a different service. For example, a service provider may use a separate CFM service for each of their customers, to verify and manage connectivity between that customer's end points.
A CFM service is always associated with the maintenance domain that it operates within, and therefore with that domain's maintenance level. All CFM frames relating to the service carry the maintenance level of the corresponding domain.
Note CFM Services are referred to as Maintenance Associations in IEEE 802.1ag and as Maintenance Entity Groups in ITU-T Y.1731.
Maintenance Points
A CFM Maintenance Point (MP) is an instance of a particular CFM service on a specific interface. CFM only operates on an interface if there is a CFM maintenance point on the interface; otherwise, CFM frames are forwarded transparently through the interface.
A maintenance point is always associated with a particular CFM service, and therefore with a particular maintenance domain at a particular level. Maintenance points generally only process CFM frames at the same level as their associated maintenance domain. Frames in the higher or lower maintenance levels are forwarded transparently. This helps enforce the maintenance domain hierarchy described in the "Maintenance Domains" section, and ensures that CFM frames for a particular domain cannot leak out beyond the boundary of the domain.
There are two types of MP:
•Maintenance End Points (MEPs)—Created at the edge of the domain. Maintenance end points (MEPs) are members of a particular service within a domain and are responsible for sourcing and sinking CFM frames. They periodically transmit continuity check messages and receive similar messages from other MEPs within their domain. They also transmit traceroute and loopback messages at the request of the administrator. MEPs are responsible for confining CFM messages within the domain.
•Maintenance Intermediate Points (MIPs)—Created in the middle of the domain. MIPs allow CFM frames to be forwarded at either lower, higher, or their own maintenance levels.
MIP Creation
Unlike MEPs, MIPs are not explicitly configured on each interface. MIPs are created automatically according to the algorithm specified in the CFM 802.1ag standard. The algorithm, in brief, operates as follows for each interface:
–The cross-connect for the interface is found, and all services associated with that cross-connect are considered for MIP auto-creation.
–The level of the highest-level MEP on the interface is found. From among the services considered above, the service in the domain with the lowest level that is higher than the highest MEP level is selected. If there are no MEPs on the interface, the service in the domain with the lowest level is selected.
–The MIP auto-creation configuration (mip auto-create command) for the selected service is examined to determine whether a MIP should be created.
Note Configuring a MIP auto-creation policy for a service does not guarantee that a MIP will automatically be created for that service. The policy is only considered if that service is selected by the algorithm first.
MEP and CFM Processing Overview
The boundary of a domain is an interface, rather than a bridge or host. Therefore, MEPs can be sub-divided into two categories:
•Down MEPs—Send CFM frames from the interface where they are configured, and process CFM frames received on that interface. Down MEPs transmit AIS messages upward (toward the cross-connect).
•Up MEPs—Send frames into the bridge relay function, as if they had been received on the interface where the MEP is configured. They process CFM frames that have been received on other interfaces, and have been switched through the bridge relay function as if they are going to be sent out of the interface where the MEP is configured. Up MEPs transmit AIS messages downward (toward the wire). However, AIS packets are only sent when there is a MIP configured on the same interface as the MEP and at the level of the MIP.
Note The terms Down MEP and Up MEP are defined in the IEEE 802.1ag and ITU-T Y.1731 standards, and refer to the direction that CFM frames are sent from the MEP. The terms should not be confused with the operational status of the MEP.
Figure 4 illustrates the monitored areas for Down and Up MEPs.
Figure 4 Monitored Areas for Down and Up MEPs
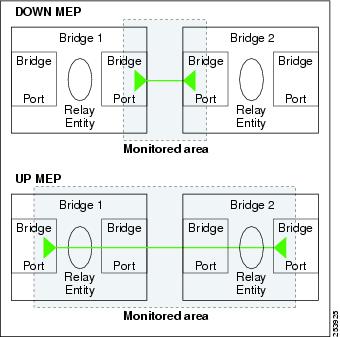
Figure 5 shows maintenance points at different levels. Because domains are allowed to nest but not intersect (see Figure 3), a MEP at a low level always corresponds with a MEP or MIP at a higher level. In addition, only a single MIP is allowed on any interface—this is generally created in the lowest domain that exists at the interface and that does not have a MEP.
Figure 5 CFM Maintenance Points at Different Levels
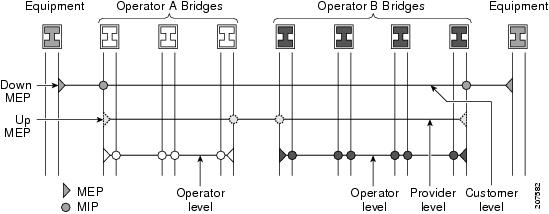
MIPs and Up MEPs can only exist on switched (Layer 2) interfaces, because they send and receive frames from the bridge relay function. Down MEPs can be created on switched (Layer 2) or routed (Layer 3) interfaces.
MEPs continue to operate normally if the interface they are created on is blocked by the Spanning Tree Protocol (STP); that is, CFM frames at the level of the MEP continue to be sent and received, according to the direction of the MEP. MEPs never allow CFM frames at the level of the MEP to be forwarded, so the STP block is maintained.
MIPs also continue to receive CFM frames at their level if the interface is STP blocked, and can respond to any received frames. However, MIPs do not allow CFM frames at the level of the MIP to be forwarded if the interface is blocked.
Note A separate set of CFM maintenance levels is created every time a VLAN tag is pushed onto the frame. Therefore, if CFM frames are received on an interface which pushes an additional tag, so as to "tunnel" the frames over part of the network, the CFM frames will not be processed by any MPs within the tunnel, even if they are at the same level. For example, if a CFM MP is created on an interface with an encapsulation that matches a single VLAN tag, any CFM frames that are received at the interface that have two VLAN tags will be forwarded transparently, regardless of the CFM level.
CFM Protocol Messages
The CFM protocol consists of a number of different message types, with different purposes. All CFM messages use the CFM EtherType, and carry the CFM maintenance level for the domain to which they apply.
This section describes the following CFM messages:
•Continuity Check (IEEE 802.1ag and ITU-T Y.1731)
•Loopback (IEEE 802.1ag and ITU-T Y.1731)
•Linktrace (IEEE 802.1ag and ITU-T Y.1731)
•Exploratory Linktrace (Cisco)
•Alarm Indication Signal (ITU-T Y.1731)
•Delay and Jitter Measurement (ITU-T Y.1731)
Continuity Check (IEEE 802.1ag and ITU-T Y.1731)
Continuity Check Messages (CCMs) are "heartbeat" messages exchanged periodically between all the MEPs in a service. Each MEP sends out multicast CCMs, and receives CCMs from all the other MEPs in the service—these are referred to as peer MEPs. This allows each MEP to discover its peer MEPs, and to verify that there is connectivity between them.
MIPs also receive CCMs. MIPs use the information to build a MAC learning database that is used when responding to Linktrace. For more information about Linktrace, see the "Linktrace (IEEE 802.1ag and ITU-T Y.1731)" section.
Figure 6 Continuity Check Message Flow
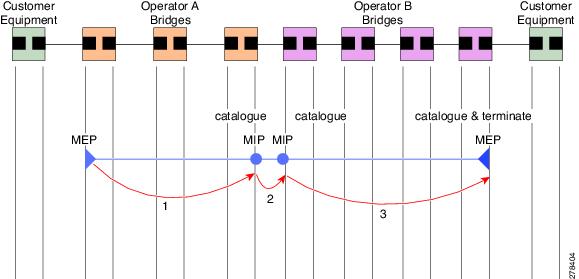
All the MEPs in a service must transmit CCMs at the same interval. IEEE 802.1ag defines 7 possible intervals that can be used:
•3.3ms
•10ms
•100ms
•1s
•10s
•1 minute
•10 minutes
A MEP detects a loss of connectivity with one of its peer MEPs when some number of CCMs have been missed. This occurs when sufficient time has passed during which a certain number of CCMs were expected, given the CCM interval. This number is called the loss threshold, and is usually set to 3.
CCM messages carry a variety of information that allows different defects to be detected in the service. This information includes:
•A configured identifier for the domain of the transmitting MEP. This is referred to as the Maintenance Domain Identifier (MDID).
•A configured identifier for the service of the transmitting MEP. This is referred to as the Short MA Name (SMAN). Together, the MDID and the SMAN make up the Maintenance Association Identifier (MAID). The MAID must be configured identically on every MEP in the service.
•A configured numeric identifier for the MEP (the MEP ID). Each MEP in the service must be configured with a different MEP ID.
•A sequence number.
•A Remote Defect Indication (RDI). Each MEP includes this in the CCMs it is sending, if it has detected a defect relating to the CCMs it is receiving. This notifies all the MEPs in the service that a defect has been detected somewhere in the service.
•The interval at which CCMs are being transmitted.
•The status of the interface where the MEP is operating—for example, whether the interface is up, down, STP blocked, and so on.
Note The status of the interface (up/down) should not be confused with the direction of any MEPs on the interface (Up MEPs/Down MEPs).
The following defects can be detected from received CCMs:
•Interval mismatch—The CCM interval in the received CCM does not match the interval that the MEP is sending CCMs.
•Level mismatch—A MEP has received a CCM carrying a lower maintenance level than the MEPs own level.
•Loop—A CCM is received with the source MAC address equal to the MAC address of the interface where the MEP is operating.
•Configuration error—A CCM is received with the same MEP ID as the MEP ID configured for the receiving MEP.
•Cross-connect—A CCM is received with an MAID that does not match the locally configured MAID. This generally indicates a VLAN misconfiguration within the network, such that CCMs from one service are leaking into a different service.
•Peer interface down—A CCM is received that indicates the interface on the peer is down.
•Remote defect indication—A CCM is received carrying a remote defect indication.
Note This defect does not cause the MEP to include a remote defect indication in the CCMs that it is sending.
Out-of-sequence CCMs can also be detected by monitoring the sequence number in the received CCMs from each peer MEP. However, this is not considered a CCM defect.
Loopback (IEEE 802.1ag and ITU-T Y.1731)
Loopback Messages (LBM) and Loopback Replies (LBR) are used to verify connectivity between a local MEP and a particular remote MP. At the request of the administrator, a local MEP sends unicast LBMs to the remote MP. On receiving each LBM, the target maintenance point sends an LBR back to the originating MEP. Loopback indicates whether the destination is reachable or not—it does not allow hop-by-hop discovery of the path. It is similar in concept to an ICMP Echo (ping). Since loopback messages are destined for unicast addresses, they are forwarded like normal data traffic, while observing the maintenance levels. At each device that the loopback reaches, if the outgoing interface is known (in the bridge's forwarding database), then the frame is sent out on that interface. If the outgoing interface is not known, then the message is flooded on all interfaces.
Figure 7 shows an example of CFM loopback message flow between a MEP and MIP.
Figure 7 Loopback Messages
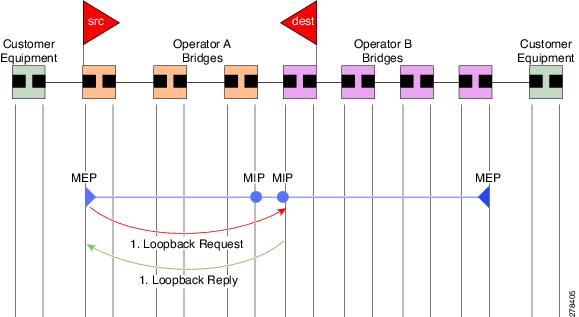
Loopback messages can be padded with user-specified data. This allows data corruption to be detected in the network. They also carry a sequence number which allows for out-of-order frames to be detected.
Linktrace (IEEE 802.1ag and ITU-T Y.1731)
Linktrace Messages (LTM) and Linktrace Replies (LTR) are used to track the path (hop-by-hop) to a unicast destination MAC address. At the request of the operator, a local MEP sends an LTM. Each hop where there is a maintenance point sends an LTR back to the originating MEP. This allows the administrator to discover connectivity data about the path. It is similar in concept to IP traceroute, although the mechanism is different. In IP traceroute, successive probes are sent, whereas CFM Linktrace uses a single LTM which is forwarded by each MP in the path. LTMs are multicast, and carry the unicast target MAC address as data within the frame. They are intercepted at each hop where there is a maintenance point, and either retransmitted or dropped to discover the unicast path to the target MAC address.
Figure 8 shows an example of CFM linktrace message flow between MEPs and MIPs.
Figure 8 Linktrace Message Flow
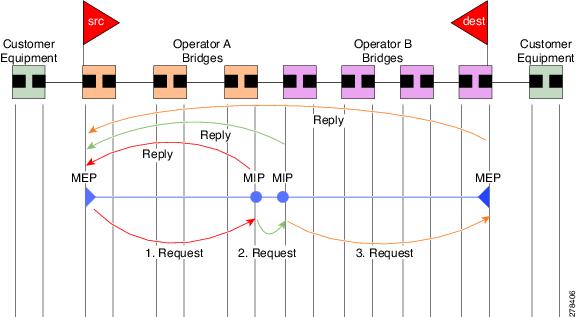
The linktrace mechanism is designed to provide useful information even after a network failure. This allows it to be used to locate failures, for example after a loss of continuity is detected. To achieve this, each MP maintains a CCM Learning Database. This maps the source MAC address for each received CCM to the interface through which the CCM was received. It is similar to a typical bridge MAC learning database, except that it is based only on CCMs and it times out much more slowly—on the order of days rather than minutes.
Note In IEEE 802.1ag, the CCM Learning Database is referred to as the MIP CCM Database. However, it applies to both MIPs and MEPs.
In IEEE 802.1ag, when an MP receives an LTM message, it determines whether to send a reply using the following steps:
1. The target MAC address in the LTM is looked up in the bridge MAC learning table. If the MAC address is known, and therefore the egress interface is known, then an LTR is sent.
2. If the MAC address is not found in the bridge MAC learning table, then it is looked up in the CCM learning database. If it is found, then an LTR is sent.
3. If the MAC address is not found, then no LTR is sent (and the LTM is not forwarded).
If the target MAC has never been seen previously in the network, the linktrace operation will not produce any results.
Note IEEE 802.1ag and ITU-T Y.1731 define slightly different linktrace mechanisms. In particular, the use of the CCM learning database and the algorithm described above for responding to LTM messages are specific to IEEE 802.1ag. IEEE 802.1ag also specifies additional information that can be included in LTRs. Regardless of the differences, the two mechanisms are interoperable.
Exploratory Linktrace (Cisco)
Exploratory Linktrace is a Cisco extension to the standard linktrace mechanism described above. It has two primary purposes:
•Provide a mechanism to locate faults in cases where standard linktrace does not work, such as when a MAC address has never been seen previously in the network. For example, if a new MEP has been provisioned but is not working, standard linktrace does not help isolate a problem because no frames will ever have been received from the new MEP. Exploratory Linktrace overcomes this problem.
•Provide a mechanism to map the complete active network topology from a single node. This can only be done currently by examining the topology (for example, the STP blocking state) on each node in the network individually, and manually combining this information to create the overall active topology map. Exploratory linktrace allows this to be done automatically from a single node.
Exploratory Linktrace is implemented using the Vendor Specific Message (VSM) and Vendor Specific Reply (VSR) frames defined in ITU-T Y.1731. These allow vendor-specific extensions to be implemented without degrading interoperability. Exploratory Linktrace can safely be deployed in a network that includes other CFM implementations because those implementations will simply ignore the Exploratory Linktrace messages.
Exploratory Linktrace is initiated at the request of the administrator, and results in the local MEP sending a multicast Exploratory Linktrace message. Each MP in the network that receives the message sends an Exploratory Linktrace reply. MIPs that receive the message also forward it on. The initiating MEP uses all the replies to create a tree of the overall network topology.
Figure 9 show an example of the Exploratory Linktrace message flow between MEPs.
Figure 9 Exploratory Linktrace Messages and Replies
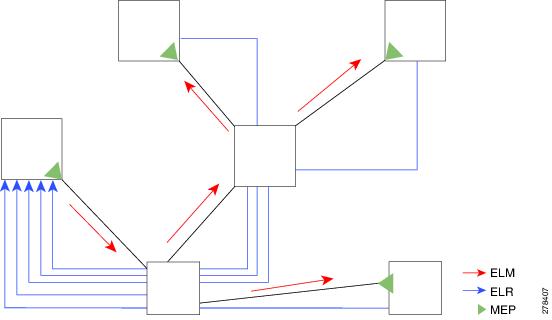
To avoid overloading the originating MEP with replies in a large network, responding MPs delay sending their replies for a random amount of time, and that time increases as the size of the network increases.
In a large network, there will be a corresponding large number of replies and the resulting topology map will be equally large. If only a part of the network is of interest, for example, because a problem has already been narrowed down to a small area, then the Exploratory Linktrace can be "directed" to start at a particular MP. Replies will thus only be received from MPs beyond that point in the network. The replies are still sent back to the originating MEP.
Alarm Indication Signal (ITU-T Y.1731)
Alarm Indication Signal (AIS) messages are used to rapidly notify MEPs when a fault is detected in the middle of a domain, in an event driven way. MEPs thereby learn of the fault much sooner than if they relied on detecting a loss of continuity, for example, failure to receive some number of consecutive CCMs.
Unlike all other CFM messages, AIS messages are injected into the middle of a domain, and sent outward toward the MEPs at the edge of the domain. Typically, AIS messages are injected by a MEP in a lower level domain. To put it another way, when a MEP sends AIS messages, they are sent in the opposite direction to other CFM messages sent by the MEP, and at a level above the MEP's own level. The AIS messages are received by the MEPs in the higher level domain, not by the peer MEPs in the same domain as the MEP sending the AIS. When a MEP receives an AIS message, it may itself send another AIS message at an even higher level.
Figure 10 show an example of AIS message flow. The maintenance domain levels are numbered at the right side of the diagram.
Figure 10 AIS Message Flow
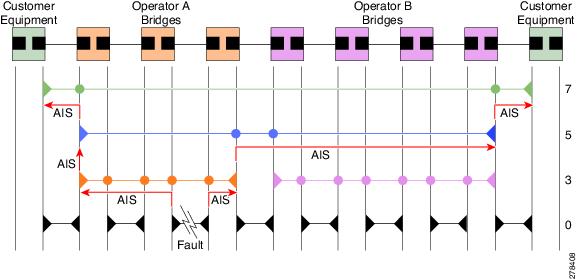
AIS is only applicable in point-to-point networks. In multipoint networks with redundant paths, a failure at a low level does not necessarily result in a failure at a higher level, as the network may reconverge so as to route around the failed link.
AIS messages are typically sent by a MEP. However, AIS messages can also be sent when there is no MEP present, if a fault is detected in the underlying transport, such as if an interface goes down. In ITU-T Y.1731 these are referred to as server MEPs.
AIS messages are sent in response to a number of failure conditions:
•Detection of CCM defects, as described "Continuity Check (IEEE 802.1ag and ITU-T Y.1731)" section.
•Loss of continuity.
•Receipt of AIS messages.
•Failure in the underlying transport, such as when an interface is down.
Received AIS messages can be used to detect and act on failures more quickly than waiting for a loss of continuity. They can also be used to suppress any failure action, on the basis that the failure has already been detected at a lower level and will be handled there. This is described in ITU-T Y.1731; however, the former is often more useful.
Delay and Jitter Measurement (ITU-T Y.1731)
The router supports one-way and two-way delay measurement using two packet types:
•Delay Measurement Message (DMM)
•Delay Measurement Response (DMR)
These packets are unicast similar to loopback messages. The packets carry timestamps generated by the system time-of-day clock to support more accurate delay measurement, and also support an SLA manageability front-end.
However, unlike loopback messages, these message types can also measure one-way delay and jitter either from destination to source, or from source to destination.
For more information about SLA, see the "Ethernet SLA (Y.1731 Performance Monitoring)" section.
MEP Cross-Check
MEP cross-check supports configuration of a set of expected peer MEPs so that errors can be detected when any of the known MEPs are missing, or if any additional peer MEPs are detected that are not in the expected group.
The set of expected MEP IDs in the service is user-defined. Optionally, the corresponding MAC addresses can also be specified. CFM monitors the set of peer MEPs from which CCMs are being received. If no CCMs are ever received from one of the specified expected peer MEPs, or if a loss of continuity is detected, then a cross-check "missing" defect is detected. Similarly, if CCMs are received from a matching MEP ID but with the wrong source MAC address, a cross-check "missing" defect is detected. If CCMs are subsequently received that match the expected MEP ID, and if specified, the expected MAC address, then the defect is cleared.
Note While loss of continuity can be detected for any peer MEP, it is only treated as a defect condition if cross-check is configured.
If cross-check is configured and CCMs are received from a peer MEP with a MEP ID that is not expected, this is detected as a cross-check "unexpected" condition. However, this is not treated as a defect condition.
Configurable Logging
CFM supports logging of various conditions to syslog. Logging can be enabled independently for each service, and when the following conditions occur:
•New peer MEPs are detected, or loss of continuity with a peer MEP occurs.
•Changes to the CCM defect conditions are detected.
•Cross-check "missing" or "unexpected" conditions are detected.
•AIS condition detected (AIS messages received) or cleared (AIS messages no longer received).
•EFD used to shut down an interface, or bring it back up.
EFD
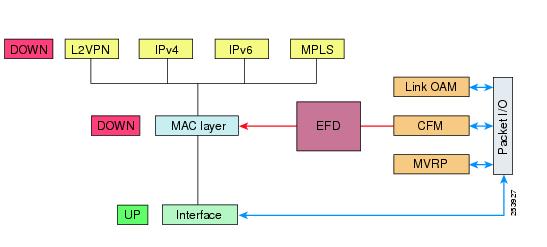
Ethernet Fault Detection (EFD) is a mechanism that allows Ethernet OAM protocols, such as CFM, to control the "line protocol" state of an interface.
Unlike many other interface types, Ethernet interfaces do not have a line protocol, whose state is independent from that of the interface. For Ethernet interfaces, this role is handled by the physical-layer Ethernet protocol itself, and therefore if the interface is physically up, then it is available and traffic can flow.
EFD changes this to allow CFM to act as the line protocol for Ethernet interfaces. This allows CFM to control the interface state so that if a CFM defect (such as AIS or loss of continuity) is detected with an expected peer MEP, the interface can be shut down. This not only stops any traffic flowing, but also triggers actions in any higher-level protocols to route around the problem. For example, in the case of Layer 2 interfaces, the MAC table would be cleared and MSTP would reconverge. For Layer 3 interfaces, the ARP cache would be cleared and potentially the IGP would reconverge.
Note EFD can only be used for down MEPs. When EFD is used to shut down the interface, the CFM frames continue to flow. This allows CFM to detect when the problem has been resolved, and thus bring the interface backup automatically.
Figure 11 shows CFM detection of an error on one of its sessions EFD signaling an error to the corresponding MAC layer for the interface. This triggers the MAC to go to a down state, which further triggers all higher level protocols (Layer 2 pseudowires, IP protocols, and so on) to go down and also trigger a reconvergence where possible. As soon as CFM detects there is no longer any error, it can signal to EFD and all protocols will once again go active.
Figure 11 CFM Error Detection and EFD Trigger
Ethernet SLA (Y.1731 Performance Monitoring)
Customers require their service providers to conform to a Service Level Agreement (SLA). Consequently, service providers must be able to monitor the performance characteristics of their networks. Likewise, customers also want to monitor the performance characteristics of their networks. Cisco provides Y.1731 performance monitoring using the Cisco Ethernet SLA feature.
An SLA defines a set of criteria that guarantees a minimum level of service for customers using a service provider network. The criteria can cover many different areas, including latency, jitter, frame loss, and availability.
The Cisco Ethernet SLA feature conforms to the following standards:
•IEEE 802.1ag
•ITU-T Y.1731
The Cisco Ethernet SLA feature provides the architecture to monitor a network at Layer 2. This architecture provides functions such as collecting, storing, displaying, and analyzing SLA statistics. These SLA statistics can be stored and displayed in various ways, so that statistical analysis can be performed.
Ethernet SLA provides the framework for performing the following major functions of performance monitoring:
•Sending probes consisting of one or more packets to measure performance
Ethernet SLA provides a flexible mechanism for sending SLA probes to measure performance. Probes can consist of either CFM loopback or CFM delay measurement packets. Options are available to modify how often the packets are sent, and to specify the attributes of the probe packets such as the size and priority.
•Scheduling of operations consisting of periodic probes.
A flexible mechanism is provided by Ethernet SLA to specify how often each probe should be executed, how long it should last, and when the first probe should start. Probes can be scheduled to run back-to-back to provide continuous measurements, or at a defined interval ranging from once a minute to once a week.
•Collecting and storing results.
Ethernet SLA provides flexibility to specify which performance parameters should be collected and stored for each measurement probe. Performance parameters include frame delay and jitter (inter-frame delay variation). For each performance parameter, either each individual result can be stored, or the results can be aggregated by storing a counter of the number of results that fall within a particular range. A configurable amount of historical data can also be stored as well as the latest results.
•Analyzing and displaying results.
Ethernet SLA performs some basic statistical analysis on the collected results, such as calculating the minimum, maximum, mean and standard deviation. It also records whether any of the probe packets were lost or misordered, or if there is any reason why the results may not be a true reflection of the performance (for example if a big jump in the local time-of-day clock was detected during the time when the measurements were being made).
Ethernet SLA Concepts
To successfully configure the Cisco Ethernet SLA feature, you should understand the following concepts:
•Ethernet SLA Measurement Packet
•Ethernet SLA Operation Profile
•Ethernet SLA On-Demand Operation
Ethernet SLA Statistic
A statistic in Ethernet SLA is a single performance parameter. The following statistics can be measured by Ethernet SLA:
•Round-trip delay
•Round-trip jitter
•One-way delay from source to destination
•One-way jitter from source to destination
•One-way delay from destination to source
•One-way jitter from destination to source
Note Not all statistics can be measured by all types of packet. For example, one-way statistics cannot be measured when using CFM loopback packets.
Ethernet SLA Measurement Packet
An Ethernet SLA measurement packet is a single protocol message and corresponding reply that is sent on the network for the purpose of making SLA measurements. The following types of measurement packet are supported:
•CFM Delay Measurement (Y.1731 DMM/DMR packets)—CFM delay measurement packets contain timestamps within the packet data that can be used for accurate measurement of frame delay and jitter. These packets can be used to measure round-trip or one-way statistics; however, the size of the DMM/DMR packets cannot be modified.
•CFM loopback (LBM/LBR)—CFM loopback packets are less accurate, but can be used if the peer device does not support DMM/DMR packets. Only round-trip statistics can be measured because these packets do not contain timestamps. However, loopback packets can be padded, so measurements can be made using frames of a specific size.
Ethernet SLA Sample
A sample is a single result—a number—that relates to a given statistic. For some statistics such as round-trip delay, a sample can be measured using a single measurement packet. For other statistics such as jitter, obtaining a sample requires two measurement packets.
Ethernet SLA Probe
A probe is a sequence of measurement packets used to gather SLA samples for a specific set of statistics. The measurement packets in a probe are of a specific type (for example, CFM delay measurement or CFM loopback) and have specific attributes, such as the frame size and priority.
Note A single probe can collect data for different statistics at the same time, using the same measurement packets (for example, one-way delay and round-trip jitter).
Ethernet SLA Burst
Within a probe, measurement packets can either be sent individually, or in bursts. A burst contains two or more packets sent within a short interval apart. Each burst can last up to one minute, and bursts can follow each other immediately to provide continuous measurement within the probe.
For statistics that require two measurement packets for each sample (such as jitter), samples are only calculated based on measurement packets in the same burst. For all statistics, it is more efficient to use bursts than to send individual packets.
Ethernet SLA Schedule
An Ethernet SLA schedule describes how often probes are sent, how long each probe lasts, and at what time the first probe starts.
Ethernet SLA Bucket
For a particular statistic, a bucket is a collection of results that were gathered during a particular period of time. All of the samples for measurements that were initiated during the period of time represented by a bucket are stored in that bucket. Buckets allow results from different periods of time to be compared (for example, peak traffic to off-peak traffic).
By default, a separate bucket is created for each probe; that is, the bucket represents the period of time starting at the same time as the probe started, and continuing for the duration of the probe. The bucket will therefore contain all the results relating to measurements made by that probe.
Ethernet SLA Aggregation Bin
Rather than storing each sample separately within a bucket, an alternative is to aggregate the samples into bins. An aggregation bin is a range of sample values, and contains a counter of the number of samples that were received that fall within that range. The set of bins forms a histogram. When aggregation is enabled, each bucket contains a separate set of bins. See Figure 12.
Ethernet SLA Operation Profile
An operation profile is a configuration entity that defines the following aspects of an operation:
•What packet types to send and in what quantities (probe and burst configuration)
•What statistics to measure, and how to aggregate them
•When to schedule the probes
An operation profile by itself does not cause any packets to be sent or statistics collected, but is used to create operation instances.
Ethernet SLA Operation
An operation is an instance of a given operation profile that is actively collecting performance data. Operation instances are created by associating an operation profile with a given source (an interface and MEP) and with a given destination (a MEP ID or MAC address). Operation instances exist for as long as the configuration is applied, and they run for an indefinite duration on an ongoing basis.
Ethernet SLA On-Demand Operation
An on-demand operation is a method of Ethernet SLA operation that can be run on an as-needed basis for a specific and finite period of time. This can be useful in situations such as when you are starting a new service or modifying the parameters for a service to verify the impact of the changes, or if you want to run a more detailed probe when a problem is detected by an ongoing scheduled operation.
On-demand operations do not use profiles and have a finite duration. The statistics that are collected are discarded after a finite time after the operation completes (two weeks), or when you manually clear them.
On-demand operations are not persistent so they are lost during certain events such as a card reload or Minimal Disruptive Restart (MDR).
Statistics Measurement and Ethernet SLA Operations Overview
Ethernet SLA statistics measurement for network performance is performed by sending packets and storing data metrics such as:
•Round-trip delay time—The time for a packet to travel from source to destination and back to source again.
•Round-trip jitter—The variance in round-trip delay time (latency).
•One-way delay and jitter—The router also supports measurement of one-way delay or jitter from source to destination, or from destination to source.
In addition to these metrics, the following statistics are also kept for SLA probe packets:
•Packet loss count
•Packet corruption event
•Out-of-order event
Counters for packet loss, corruption and out-of-order packets are kept for each bucket, and in each case, a percentage of the total number of samples for that bucket is reported (for example, 4% packet corruption). For delay and jitter statistics, the minimum, maximum, mean and standard deviation for the whole bucket are reported, as well as the individual samples or aggregated bins.
When aggregation is enabled using the aggregate command, bins are created to store a count of the samples that fall within a certain value range, which is set by the width keyword. Only a counter of the number of results that fall within the range for each bin is stored. This uses less memory than storing individual results. When aggregation is not used, each sample is stored separately, which can provide a more accurate statistics analysis for the operation, but it is highly memory-intensive due to the independent storage of each sample.
A bucket represents a time period during which statistics are collected. All the results received during that time period are recorded in the corresponding bucket. If aggregation is enabled, each bucket has its own set of bins and counters, and only results relating to the measurements initiated during the time period represented by the bucket are included in those counters.
By default, there is a separate bucket for each probe. The time period is determined by how long the probe lasts (configured by the probe, send (SLA), and schedule (SLA) commands).You can modify the size of buckets so that you can have more buckets per probe or fewer buckets per probe (less buckets allows the results from multiple probes to be included in the same bucket). Changing the size of the buckets for a given metric clears all stored data for that metric. All existing buckets are deleted and new buckets are created.
Scheduled SLA operation profiles run indefinitely, according to a configured schedule, and the statistics that are collected are stored in a rolling buffer, where data in the oldest bucket is discarded when a new bucket needs to be recorded.
Configuration Overview of Scheduled Ethernet SLA Operations
When you configure a scheduled Ethernet SLA operation, you perform the following basic steps:
1. Configure global profiles to define how packets are sent in each probe, how the probes are scheduled, and how the results are stored.
2. Configure operations from a specific local MEP to a specific peer MEP using these profiles.
Note Certain Ethernet SLA configurations use large amounts of memory which can affect the performance of other features on the system. For more information, see the "Configuring Ethernet SLA" section.
How to Configure Ethernet OAM
This section provides the following configuration procedures:
•Configuring Ethernet Link OAM
Configuring Ethernet Link OAM
Custom EOAM settings can be configured and shared on multiple interfaces by creating an EOAM profile in Ethernet configuration mode and then attaching the profile to individual interfaces. The profile configuration does not take effect until the profile is attached to an interface. After an EOAM profile is attached to an interface, individual EOAM features can be configured separately on the interface to override the profile settings when desired.
This section describes how to configure an EOAM profile and attach it to an interface in the following procedures:
•Configuring an Ethernet OAM Profile
•Attaching an Ethernet OAM Profile to an Interface
•Configuring Ethernet OAM at an Interface and Overriding the Profile Configuration
•Verifying the Ethernet OAM Configuration
Configuring an Ethernet OAM Profile
Perform the following steps to configure an Ethernet OAM profile.
SUMMARY STEPS
1. configure
2. ethernet oam profile profile-name
3. link-monitor
4. frame window window
5. frame threshold low threshold
6. frame-period window window
7. frame-period threshold low threshold
8. frame-seconds window window
9. frame-seconds threshold low threshold
10. exit
11. mib-retrieval
12. connection timeout seconds
13. hello-interval {100ms | 1s}
14. mode {active | passive}
15. require-remote mode {active | passive}
16. require-remote link-monitoring
17. require-remote mib-retrieval
18. action capabilities-conflict {disable | efd | error-disable-interface}
19. action critical-event {disable | error-disable-interface}
20. action discovery-timeout {disable | efd | error-disable-interface }
21. action dying-gasp {disable | error-disable-interface}
22. action high-threshold {error-disable-interface | log}
23. action remote-loopback disable
24. action session-down {disable | efd | error-disable-interface}
25. action session-up disable
26. action uni-directional link-fault {disable | efd | error-disable-interface}
27. action wiring-conflict {disable | efd | log}
28. commit
29. end
DETAILED STEPS
Attaching an Ethernet OAM Profile to an Interface
Perform the following steps to attach an Ethernet OAM profile to an interface:
SUMMARY STEPS
1. configure
2. interface [FastEthernet | GigabitEthernet | TenGigE] interface-path-id
3. ethernet oam
4. profile profile-name
5. commit
6. end
DETAILED STEPS
Configuring Ethernet OAM at an Interface and Overriding the Profile Configuration
Using an EOAM profile is an efficient way of configuring multiple interfaces with a common EOAM configuration. However, if you want to use a profile but also change the behavior of certain functions for a particular interface, then you can override the profile configuration. To override certain profile settings that are applied to an interface, you can configure that command in interface Ethernet OAM configuration mode to change the behavior for that interface.
In some cases, only certain keyword options are available in interface Ethernet OAM configuration due to the default settings for the command. For example, without any configuration of the action commands, several forms of the command have a default behavior of creating a syslog entry when a profile is created and applied to an interface. Therefore, the log keyword is not available in Ethernet OAM configuration for these commands in the profile because it is the default behavior. However, the log keyword is available in Interface Ethernet OAM configuration if the default is changed in the profile configuration so you can retain the action of creating a syslog entry for a particular interface.
To see all of the default Ethernet OAM configuration settings, see the "Verifying the Ethernet OAM Configuration" section.
To configure Ethernet OAM settings at an interface and override the profile configuration, perform the following steps:
SUMMARY STEPS
1. configure
2. interface [FastEthernet | GigabitEthernet | TenGigE] interface-path-id
3. ethernet oam
4. interface-Ethernet-OAM-command
5. commit
6. end
DETAILED STEPS
Verifying the Ethernet OAM Configuration
Use the show ethernet oam configuration command to display the values for the Ethernet OAM configuration for a particular interface, or for all interfaces. The following example shows the default values for Ethernet OAM settings:
Note Some of these settings are not supported on certain platforms, but the defaults are still reported. On the Cisco XR 12000 Series Router, the following areas are unsupported:
•Remote loopback
•Symbol period window
•Symbol period thresholds
•Uni-directional link-fault detection
RP/0/0/CPU0:router# show ethernet oam configuration
Thu Aug 5 22:07:06.870 DST
GigabitEthernet0/4/0/0:
Hello interval: 1s
Link monitoring enabled: Y
Remote loopback enabled: N
Mib retrieval enabled: N
Uni-directional link-fault detection enabled: N
Configured mode: Active
Connection timeout: 5
Symbol period window: 0
Symbol period low threshold: 1
Symbol period high threshold: None
Frame window: 1000
Frame low threshold: 1
Frame high threshold: None
Frame period window: 1000
Frame period low threshold: 1
Frame period high threshold: None
Frame seconds window: 60000
Frame seconds low threshold: 1
Frame seconds high threshold: None
High threshold action: None
Link fault action: Log
Dying gasp action: Log
Critical event action: Log
Discovery timeout action: Log
Capabilities conflict action: Log
Wiring conflict action: Error-Disable
Session up action: Log
Session down action: Log
Remote loopback action: Log
Require remote mode: Ignore
Require remote MIB retrieval: N
Require remote loopback support: N
Require remote link monitoring: N
Configuring Ethernet CFM
To configure Ethernet CFM, perform the following tasks:
•Configuring a CFM Maintenance Domain (required)
•Configuring Services for a CFM Maintenance Domain (required)
•Enabling and Configuring Continuity Check for a CFM Service (optional)
•Configuring Automatic MIP Creation for a CFM Service (optional)
•Configuring Cross-Check on a MEP for a CFM Service (optional)
•Configuring Other Options for a CFM Service (optional)
•Configuring CFM MEPs (required)
•Configuring Y.1731 AIS (optional)
•Configuring EFD for a CFM Service (optional)
•Verifying the CFM Configuration
Configuring a CFM Maintenance Domain
To configure a CFM maintenance domain, perform the following steps:
SUMMARY STEPS
1. configure
2. ethernet cfm
3. domain domain-name level level-value [id [null] [dns DNS-name] [mac H.H.H] [string string] ]
4. traceroute cache hold-time minutes size entries
5. end
or
commit
DETAILED STEPS
Configuring Services for a CFM Maintenance Domain
You can configure up to 32000 CFM services for a maintenance domain.
Restrictions
When you configure services for a CFM maintenance domain, consider the following restrictions:
•VPLS configuration (L2VPN bridge groups and bridge-domains) is supported with CFM down MEPs only.
•Policy-Based Tunnel Selection (PBTS) in the core network is not supported.
To configure services for a CFM maintenance domain, perform the following steps:
SUMMARY STEPS
1. configure
2. ethernet cfm
3. domain domain-name level level-value [id [null] [dns DNS-name] [mac H.H.H] [string string]]
4. service service-name {down-meps | xconnect group xconnect-group-name p2p xconnect-name}[id [string text] | [number number] | [vlan-id id-number] | [vpn-id oui-vpnid]]
5. end
or
commit
DETAILED STEPS
Enabling and Configuring Continuity Check for a CFM Service
The Cisco XR 12000 Series Router supports Continuity Check as defined in the IEEE 802.1ag specification, and supports CCMs intervals of 100 ms and longer. The overall packet rates for CCM messages are up to 2000 CCMs-per-second sent, and up to 2000 CCMs-per-second received, per card.
Note If Ethernet SLA is configured, the overall combined packet rate for CCMs and SLA frames is 2000 frames-per-second in each direction, per card.
To configure Continuity Check for a CFM service, complete the following steps:
SUMMARY STEPS
1. configure
2. ethernet cfm
3. domain domain-name level level-value [id [null] [dns DNS-name] [mac H.H.H] [string string]]
4. service service-name {down-meps | xconnect group xconnect-group-name p2p xconnect-name}[id [string text] | [number number] | [vlan-id id-number] | [vpn-id oui-vpnid]]
5. continuity-check interval time [loss-threshold threshold ]
6. continuity-check archive hold-time minutes
7. continuity-check loss auto-traceroute
8. end
or
commit
DETAILED STEPS
Configuring Automatic MIP Creation for a CFM Service
For more information about the algorithm for creating MIPs, see the "MIP Creation" section.
To configure automatic MIP creation for a CFM service, complete the following steps:
SUMMARY STEPS
1. configure
2. ethernet cfm
3. domain domain-name level level-value [id [null] [dns DNS-name] [mac H.H.H] [string string]]
4. service service-name {down-meps | xconnect group xconnect-group-name p2p xconnect-name}[id [string text] | [number number] | [vlan-id id-number] | [vpn-id oui-vpnid]]
5. mip auto-create {all | lower-mep-only}
6. end
or
commit
DETAILED STEPS
Configuring Cross-Check on a MEP for a CFM Service
To configure cross-check on a MEP for a CFM service and specify the expected set of MEPs, complete the following steps:
SUMMARY STEPS
1. configure
2. ethernet cfm
3. domain domain-name level level-value [id [null] [dns DNS-name] [mac H.H.H] [string string]]
4. service service-name {down-meps | xconnect group xconnect-group-name p2p xconnect-name}[id [string text] | [number number] | [vlan-id id-number] | [vpn-id oui-vpnid]]
5. mep crosscheck
6. mep-id mep-id-number [mac-address mac-address]
7. end
or
commit
DETAILED STEPS
Configuring Other Options for a CFM Service
To configure other options for a CFM service, complete the following steps:
SUMMARY STEPS
1. configure
2. ethernet cfm
3. domain domain-name level level-value [id [null] [dns DNS-name] [mac H.H.H] [string string]]
4. service service-name {down-meps | xconnect group xconnect-group-name p2p xconnect-name}[id [string text] | [number number] | [vlan-id id-number] | [vpn-id oui-vpnid]]
5. maximum meps number
6. log {ais | continuity-check errors | continuity-check mep changes | crosscheck errors | efd}
7. end
or
commit
DETAILED STEPS
Configuring CFM MEPs
When you configure CFM MEPs, consider the following guidelines:
•Up to 16 MEPs are supported per interface (8 up MEPs and 8 down MEPs) or up to 15 MPs (7 up MEPs, 7 down MEPs, and 1 MIP).
•Up to 2000 maintenance points are supported per card.
•Up to 3000 maintenance points are supported per system.
•CFM maintenance points can be created on the following interface types:
–Attachment circuit (AC) Layer 2 interfaces and Layer 3 interfaces.
–Up MEPs can be configured on an AC interface, receiving messages to and from a pseudowire.
–Down MEPs can be configured on an AC or L3 interface, receiving and sending messages to and from an Ethernet interface.
–L3 interfaces can only support down MEPs.
–MIPs are only supported on an AC interface.
–Both up and down MEPs (and MIPs) can be configured on the same interface. They can be at the same or different levels.
Restrictions
When you configure MEPs, consider the following restrictions:
•Up MEPs are not supported on Layer 3 interfaces.
•MEPs are not supported on Layer 2 bundle interfaces or bundle member interfaces.
SUMMARY STEPS
1. configure
2. interface {FastEthernet | GigabitEthernet | TenGigE} interface-path-id
3. ethernet cfm
4. mep domain domain-name service service-name mep-id id-number
5. cos cos
6. end
or
commit
DETAILED STEPS
Configuring Y.1731 AIS
This section has the following step procedures:
•Configuring AIS in a CFM Domain Service
•Configuring AIS on a CFM Interface
Configuring AIS in a CFM Domain Service
Use the following procedure to configure Alarm Indication Signal (AIS) transmission for a CFM domain service and configure AIS logging.
SUMMARY STEPS
1. configure
2. ethernet cfm
3. domain name level level
4. service name xconnect group xconnect-group-name p2p xconnect-name
5. ais transmission [interval {1s | 1m}][cos cos]
6. log ais
7. end
or
commit
DETAILED STEPS
Configuring AIS on a CFM Interface
To configure AIS on a CFM interface, perform the following steps:
SUMMARY STEPS
1. configure
2. interface gigabitethernet interface-path-id
3. ethernet cfm
4. ais transmission up interval 1m cos cos
5. end
or
commit
DETAILED STEPS
Configuring EFD for a CFM Service
To configure EFD for a CFM service, complete the following steps.
Restrictions
EFD is not supported on up MEPs. It can only be configured on down MEPs, within a particular service.
SUMMARY STEPS
1. configure
2. ethernet cfm
3. domain domain-name level level-value
4. service service-name down-meps
5. efd
6. log efd
7. end
or
commit
DETAILED STEPS
Verifying the EFD Configuration
The following example shows how to display all interfaces that are shut down because of Ethernet Fault Detection (EFD):
RP/0/0/CPU0:router# show efd interfaces
Server VLAN MA
==============
Interface Clients
-------------------------
GigE0/0/0/0.0 CFM
Verifying the CFM Configuration
To verify the CFM configuration, use one or more of the following commands:
Troubleshooting Tips
To troubleshoot problems within the CFM network, perform the following steps:
Step 1 To verify connectivity to a problematic MEP, use the ping ethernet cfm command as shown in the following example:
RP/0/0/CPU0:router# ping ethernet cfm domain D1 service S1 mep-id 16 source
interface GigabitEthernet 0/0/0/0
Type escape sequence to abort.
Sending 5 CFM Loopbacks, timeout is 2 seconds -
Domain foo (level 2), Service foo
Source: MEP ID 1, interface GigabitEthernet0/0/0/0
Target: 0001.0002.0003 (MEP ID 16):
Running (5s) ...
Success rate is 60.0 percent (3/5), round-trip min/avg/max = 1251/1349/1402 ms
Out-of-sequence: 0.0 percent (0/3)
Bad data: 0.0 percent (0/3)
Received packet rate: 1.4 pps
Step 2 If the results of the ping ethernet cfm command show a problem with connectivity to the peer MEP, use the traceroute ethernet cfm command to help further isolate the location of the problem as shown in the following example:
RP/0/0/CPU0:router# traceroute ethernet cfm domain D1 service S1 mep-id 16 source
interface gigabitethernet 0/0/0/0
Traceroutes in domain D1 (level 4), service S1
Source: MEP-ID 1, interface GigabitEthernet0/0/0/0
================================================================================
Traceroute at 2009-05-18 12:09:10 to 0001.0203.0402,
TTL 64, Trans ID 2:
Hop Hostname/Last Ingress MAC/name Egress MAC/Name Relay
--- ------------------------ ---------------------- ---------------------- -----
1 ios 0001.0203.0400 [Down] FDB
0000-0001.0203.0400 Gi0/0/0/0
2 abc 0001.0203.0401 [Ok] FDB
ios Not present
3 bcd 0001.0203.0402 [Ok] Hit
abc GigE0/0
Replies dropped: 0
If the target was a MEP, verify that the last hop shows "Hit" in the Relay field to confirm connectivity to the peer MEP.
If the Relay field contains "MPDB" for any of the hops, then the target MAC address was not found in the bridge MAC learning table at that hop, and the result is relying on CCM learning. This result can occur under normal conditions, but it can also indicate a problem. If you used the ping ethernet cfm command before using the traceroute ethernet cfm command, then the MAC address should have been learned. If "MPDB" is appearing in that case, then this indicates a problem at that point in the network.
Configuring Ethernet SLA
This section describes how to configure Ethernet SLA.
Ethernet SLA Configuration Guidelines
 Certain SLA configurations can use a large amount of memory which can affect the performance of other features on the router.
Before you configure Ethernet SLA, consider the following guidelines:
•Aggregation—Use of the aggregate none command significantly increases the amount of memory required because each individual measurement is recorded, rather than just counts for each aggregation bin. When you configure aggregation, consider that more bins will require more memory.
•Buckets archive—When you configure the buckets archive command, consider that the more history that is kept, the more memory will be used.
•Measuring two statistics (such as both delay and jitter) will use approximately twice as much memory as measuring one.
•Separate statistics are stored for one-way source-to-destination and destination-to-source measurements, which consumes twice as much memory as storing a single set of round-trip statistics.
•The Cisco XR 12000 Series Router supports SLA packet of 100 ms and longer. The overall packet rates for SLA is up to 2000 CCMs-per-second sent, and up to 2000 CCMs-per-second received, per card.
The following procedure provides the steps to configure Ethernet Service Level Agreement (SLA) monitoring at Layer 2.
To configure SLA, perform the following tasks:
•Configuring an SLA Operation Profile
•Configuring SLA Probe Parameters in a Profile
•Configuring SLA Statistics Measurement in a Profile
•Configuring a Schedule for an SLA Operation Probe in a Profile
•Configuring an On-Demand SLA Operation
Configuring an SLA Operation Profile
To configure a profile, perform the following steps:
SUMMARY STEPS
1. configure
2. ethernet sla
3. profile profile-name type {cfm-delay-measurement | cfm-loopback}
4. end
or
commit
DETAILED STEPS
Configuring SLA Probe Parameters in a Profile
To configure SLA probe parameters in a profile, perform the following steps beginning in SLA profile configuration mode:
SUMMARY STEPS
1. probe
2. send burst {every number {seconds | minutes | hours}| once} packet count packets interval number {seconds | milliseconds}
or
send packet {every number {milliseconds | seconds | minutes | hours} | once}
3. packet size bytes [test pattern {hex 0xHHHHHHHH | pseudo-random}]
4. priority priority
5. end
or
commit
DETAILED STEPS
Configuring SLA Statistics Measurement in a Profile
The Ethernet SLA feature supports measurement of one-way and two-way delay and jitter statistics.
Prerequisites
To configure one-way measurements, you must first configure the profile (SLA) command using the type cfm-delay-measurement form of the command.
Restrictions
One-way delay and jitter measurements are not supported by cfm-loopback profile types.
To configure SLA statistics measurement in a profile, perform the following steps beginning in SLA profile configuration mode:
SUMMARY STEPS
1. statistics measure {one-way-delay-ds | one-way-delay-sd | one-way-jitter-ds | one-way-jitter-sd | round-trip-delay | round-trip-jitter}
2. aggregate {bins count width width | none}
3. buckets size number {per-probe | probes}
4. buckets archive number
5. end
or
commit
DETAILED STEPS
Configuring a Schedule for an SLA Operation Probe in a Profile
This section describes how to configure a schedule for an SLA operation probe on an ongoing basis within an SLA profile. For information about how to configure a schedule for a limited, on-demand SLA operation, see the "Configuring an On-Demand SLA Operation" section.
To configure a schedule for an SLA operation probe, perform the following steps beginning in SLA profile configuration mode:
SUMMARY STEPS
1. schedule every week on day [at hh:mm] [for duration {seconds | minutes | hours | days | week}]
or
schedule every day [at hh:mm] [for duration {seconds | minutes | hours | days | week}]
or
schedule every number {hours | minutes}[first at hh:mm[.ss]] [for duration {seconds | minutes | hours | days | week}]
2. end
or
commit
DETAILED STEPS
Configuring an SLA Operation
This section describes how to configure an ongoing SLA operation on a MEP using an SLA profile.
SUMMARY STEPS
1. interface [FastEthernet | GigabitEthernet | TenGigE] interface-path-id
2. ethernet cfm
3. mep domain domain-name service service-name mep-id id-number
4. sla operation profile profile-name target {mep-id id | mac-address mac-address}
5.
6. end
or
commit
DETAILED STEPS
Configuring an On-Demand SLA Operation
You can configure an on-demand SLA operation to run on an as-needed basis for a finite period of time.
This section includes the following topics:
•Configuring an On-Demand Ethernet SLA Operation for CFM Delay Measurement
•Configuring an On-Demand Ethernet SLA Operation for CFM Loopback
Configuration Guidelines
When you configure on-demand SLA operations, consider the following guidelines:
•Each MEP supports up to 50 on-demand operations.
•Each card supports up to 250 on-demand operations.
•On-demand Ethernet SLA operations can be run in addition to any other ongoing scheduled SLA operations that you might have configured, and use similar amounts of CPU and router memory. When configuring an on-demand Ethernet SLA operation, you should consider your existing SLA operation configuration and the potential impact of additional packet processing to your normal operations.
•If you do not specify a schedule for the on-demand operation, the probe defaults to running one time beginning two seconds from the execution of the command, and runs for a ten-second duration.
•If you do not specify the statistics for the probe to measure, it defaults to measuring all statistics, inlcuding the following statistics by probe type:
–CFM loopback—Two-way delay and jitter is measured by default.
–CFM delay measurement—One-way delay and jitter in both directions, in addition to two-way delay and jitter is measured by default.
•The default operation mode is synchronous, where progress of the operation is reported to the console and the output of the statistics collection is displayed.
Configuring an On-Demand Ethernet SLA Operation for CFM Delay Measurement
To configure an on-demand Ethernet SLA operation for CFM delay measurement, use the following command in privileged EXEC configuration mode:
Configuring an On-Demand Ethernet SLA Operation for CFM Loopback
To configure an on-demand Ethernet SLA operation for CFM loopback, use the following command in privileged EXEC configuration mode:
Verifying SLA Configuration
To verify SLA configuration, use one or more of the following commands:
–
Configuration Examples for Ethernet OAM
This section provides the following configuration examples:
•Configuration Examples for EOAM Interfaces
•Configuration Examples for Ethernet CFM
•Configuration Examples for Ethernet SLA
Configuration Examples for EOAM Interfaces
This section provides the following configuration examples:
•Configuring an Ethernet OAM Profile Globally: Example
•Configuring Ethernet OAM Features on an Individual Interface: Example
•Configuring Ethernet OAM Features to Override the Profile on an Individual Interface: Example
•Clearing Ethernet OAM Statistics on an Interface: Example
•Enabling SNMP Server Traps on a Router: Example
Configuring an Ethernet OAM Profile Globally: Example
The following example shows how to configure an Ethernet OAM profile globally:
configure terminal
ethernet oam profile Profile_1
link-monitor
frame window 60
frame threshold low 10000000 high 60000000
frame-period window 60000
frame-period threshold low 100 high 12000000
frame-seconds window 900000
frame-seconds threshold 3 threshold 900
exit
mib-retrieval
connection timeout 30
require-remote mode active
require-remote link-monitoring
require-remote mib-retrieval
action dying-gasp error-disable-interface
action critical-event error-disable-interface
action discovery-timeout error-disable-interface
action session-down error-disable-interface
action capabilities-conflict error-disable-interface
action wiring-conflict error-disable-interface
action remote-loopback error-disable-interface
commit
Configuring Ethernet OAM Features on an Individual Interface: Example
The following example shows how to configure Ethernet OAM features on an individual interface:
configure terminal
interface TenGigE 0/1/0/0
ethernet oam
link-monitor
frame window 60
frame threshold low 10000000 high 60000000
frame-period window 60000
frame-period threshold low 100 high 12000000
frame-seconds window 900000
frame-seconds threshold 3 threshold 900
exit
mib-retrieval
connection timeout 30
require-remote mode active
require-remote link-monitoring
require-remote mib-retrieval
action link-fault error-disable-interface
action dying-gasp error-disable-interface
action critical-event error-disable-interface
action discovery-timeout error-disable-interface
action session-down error-disable-interface
action capabilities-conflict error-disable-interface
action wiring-conflict error-disable-interface
action remote-loopback error-disable-interface
commit
Configuring Ethernet OAM Features to Override the Profile on an Individual Interface: Example
The following example shows the configuration of Ethernet OAM features in a profile followed by an override of that configuration on an interface:
configure terminal
ethernet oam profile Profile_1
mode passive
action dying-gasp disable
action critical-event disable
action discovery-timeout disable
action session-up disable
action session-down disable
action capabilities-conflict disable
action wiring-conflict disable
action remote-loopback disable
action uni-directional link-fault error-disable-interface
commit
configure terminal
interface TenGigE 0/1/0/0
ethernet oam
profile Profile_1
mode active
action dying-gasp log
action critical-event log
action discovery-timeout log
action session-up log
action session-down log
action capabilities-conflict log
action wiring-conflict log
action remote-loopback log
action uni-directional link-fault log
uni-directional link-fault detection
commit
Clearing Ethernet OAM Statistics on an Interface: Example
The following example shows how to clear Ethernet OAM statistics on an interface:
RP/0/RP0/CPU0:router# clear ethernet oam statistics interface gigabitethernet 0/1/5/1
Enabling SNMP Server Traps on a Router: Example
The following example shows how to enable SNMP server traps on a router:
configure terminal
ethernet oam profile Profile_1
snmp-server traps ethernet oam events
Configuration Examples for Ethernet CFM
This section includes the following examples:
•Ethernet CFM Domain Configuration: Example
•Ethernet CFM Service Configuration: Example
•Continuity Check for an Ethernet CFM Service Configuration: Example
•MIP Creation for an Ethernet CFM Service Configuration: Example
•Cross-check for an Ethernet CFM Service Configuration: Example
•Other Ethernet CFM Service Parameter Configuration: Example
•Ethernet CFM Show Command: Examples
•AIS for CFM Configuration: Examples
•AIS for CFM Show Commands: Examples
•Displaying EFD Information: Examples
Ethernet CFM Domain Configuration: Example
This example shows how to configure a basic domain for Ethernet CFM:
configure
ethernet cfm
traceroute cache hold-time 1 size 3000
domain Domain_One level 1 id string D1
commit
Ethernet CFM Service Configuration: Example
The following example shows how to create a service for an Ethernet CFM domain:
service Cross_Connect_1 xconnect group XG1 p2p X1
commit
Continuity Check for an Ethernet CFM Service Configuration: Example
The following example shows how to configure continuity-check options for an Ethernet CFM service:
continuity-check archive hold-time 100
continuity-check loss auto-traceroute
continuity-check interval 100ms loss-threshold 10
commit
MIP Creation for an Ethernet CFM Service Configuration: Example
The following example shows how to enable MIP auto-creation for an Ethernet CFM service:
mip auto-create all
commit
Cross-check for an Ethernet CFM Service Configuration: Example
The following example shows how to configure cross-check for MEPs in an Ethernet CFM service:
mep crosscheck
mep-id 10
mep-id 20
commit
Other Ethernet CFM Service Parameter Configuration: Example
The following example shows how to configure other Ethernet CFM service options:
maximum-meps 4000
log continuity-check errors
commit
exit
exit
exit
MEP Configuration: Example
The following example shows how to configure a MEP for Ethernet CFM on an interface:
interface gigabitethernet 0/1/0/1
ethernet cfm
mep domain Dm1 service Sv1 mep-id 1
commit
Ethernet CFM Show Command: Examples
The following examples show how to verify the configuration of Ethernet Connectivity Fault Management (CFM):
Example 1
The following example shows how to display all the maintenance points that have been created on an interface:
RP/0/0/CPU0:router# show ethernet cfm local maintenance-points
Domain/Level Service Interface Type ID MAC
-------------------- ------------------- ----------------- ------ ---- --------
fig/5 bay Gi0/10/0/12.23456 Dn MEP 2 44:55:66
fig/5 bay Gi0/0/1/0.1 MIP 55:66:77
fred/3 barney Gi0/1/0/0.1 Up MEP 5 66:77:88!
Example 2
The following example shows how to display all the CFM configuration errors on all domains:
RP/0/0/CPU0:router# show ethernet cfm configuration-errors
Domain fig (level 5), Service bay
 * An Up MEP is configured for this domain on interface GigabitEthernet0/1/2/3.234 and an
Up MEP is also configured for domain blort, which is at the same level (5).
 * A MEP is configured on interface GigabitEthernet0/3/2/1.1 for this domain/service,
which has CC interval 100ms, but the lowest interval supported on that interface is 1s
Example 3
The following example shows how to display operational state for local maintenance end points (MEPs):
RP/0/0/CPU0:router# show ethernet cfm local meps
A - AIS received I - Wrong interval
R - Remote Defect received V - Wrong Level
L - Loop (our MAC received) T - Timed out (archived)
C - Config (our ID received) M - Missing (cross-check)
X - Cross-connect (wrong MAID) U - Unexpected (cross-check)
P - Peer port down
Domain foo (level 6), Service bar
ID Interface (State) Dir MEPs/Err RD Defects AIS
----- ------------------------ --- -------- -- ------- ---
100 Gi1/1/0/1.234 (Up) Up 0/0 N A
Domain fred (level 5), Service barney
ID Interface (State) Dir MEPs/Err RD Defects AIS
----- ------------------------ --- -------- -- ------- ---
2 Gi0/1/0/0.234 (Up) Up 3/2 Y RPC
Example 4
The following example shows how to display operational state of other maintenance end points (MEPs) detected by a local MEP:
RP/0/0/CPU0:router# show ethernet cfm peer meps
Flags:
> - Ok I - Wrong interval
R - Remote Defect received V - Wrong level
L - Loop (our MAC received) T - Timed out
C - Config (our ID received) M - Missing (cross-check)
X - Cross-connect (wrong MAID) U - Unexpected (cross-check)
Domain fred (level 7), Service barney
Up MEP on GigabitEthernet0/1/0/0.234, MEP-ID 2
================================================================================
St ID MAC address Port Up/Downtime CcmRcvd SeqErr RDI Error
-- ----- -------------- ------- ----------- --------- ------ ----- -----
> 1 0011.2233.4455 Up 00:00:01 1234 0 0 0
R> 4 4455.6677.8899 Up 1d 03:04 3456 0 234 0
L 2 1122.3344.5566 Up 3w 1d 6h 3254 0 0 3254
C 2 7788.9900.1122 Test 00:13 2345 6 20 2345
X 3 2233.4455.6677 Up 00:23 30 0 0 30
I 3 3344.5566.7788 Down 00:34 12345 0 300 1234
V 3 8899.0011.2233 Blocked 00:35 45 0 0 45
T 5 5566.7788.9900 00:56 20 0 0 0
M 6 0 0 0 0
U> 7 6677.8899.0011 Up 00:02 456 0 0 0
Domain fred (level 7), Service fig
Down MEP on GigabitEthernet0/10/0/12.123, MEP-ID 3
================================================================================
St ID MAC address Port Up/Downtime CcmRcvd SeqErr RDI Error
-- ----- -------------- ------- ----------- -------- ------ ----- -----
> 1 9900.1122.3344 Up 03:45 4321 0 0 0
Example 5
The following example shows how to display operational state of other maintenance end points (MEPs) detected by a local MEP with details:
RP/0/0/CPU0:router# show ethernet cfm peer meps detail
Domain dom3 (level 5), Service ser3
Down MEP on GigabitEthernet0/0/0/0 MEP-ID 1
================================================================================
Peer MEP-ID 10, MAC 0001.0203.0403
CFM state: Wrong level, for 00:01:34
Port state: Up
CCM defects detected: V - Wrong Level
CCMs received: 5
Out-of-sequence: 0
Remote Defect received: 5
Wrong Level: 0
Cross-connect (wrong MAID): 0
Wrong Interval: 5
Loop (our MAC received): 0
Config (our ID received): 0
Last CCM received 00:00:06 ago:
Level: 4, Version: 0, Interval: 1min
Sequence number: 5, MEP-ID: 10
MAID: String: dom3, String: ser3
Port status: Up, Interface status: Up
Domain dom4 (level 2), Service ser4
Down MEP on GigabitEthernet0/0/0/0 MEP-ID 1
================================================================================
Peer MEP-ID 20, MAC 0001.0203.0402
CFM state: Ok, for 00:00:04
Port state: Up
CCMs received: 7
Out-of-sequence: 1
Remote Defect received: 0
Wrong Level: 0
Cross-connect (wrong MAID): 0
Wrong Interval: 0
Loop (our MAC received): 0
Config (our ID received): 0
Last CCM received 00:00:04 ago:
Level: 2, Version: 0, Interval: 10s
Sequence number: 1, MEP-ID: 20
MAID: String: dom4, String: ser4
Chassis ID: Local: ios; Management address: 'Not specified'
Port status: Up, Interface status: Up
Peer MEP-ID 21, MAC 0001.0203.0403
CFM state: Ok, for 00:00:05
Port state: Up
CCMs received: 6
Out-of-sequence: 0
Remote Defect received: 0
Wrong Level: 0
Cross-connect (wrong MAID): 0
Wrong Interval: 0
Loop (our MAC received): 0
Config (our ID received): 0
Last CCM received 00:00:05 ago:
Level: 2, Version: 0, Interval: 10s
Sequence number: 1, MEP-ID: 21
MAID: String: dom4, String: ser4
Port status: Up, Interface status: Up
AIS for CFM Configuration: Examples
Example 1
The following example shows how to configure Alarm Indication Signal (AIS) transmission for a CFM domain service:
RP/0/0/CPU0:router# configure
RP/0/0/CPU0:router(config)# ethernet cfm
RP/0/0/CPU0:router(config-cfm)# domain D1 level 1
RP/0/0/CPU0:router(config-cfm-dmn)# service Cross_Connect_1 xconnect group XG1 p2p
RP/0/0/CPU0:router(config-cfm-dmn-svc)# ais transmission interval 1m cos 7
Example 2
The following example shows how to configure AIS logging for a Connectivity Fault Management (CFM) domain service to indicate when AIS or LCK packets are received:
RP/0/0/CPU0:router# configure
RP/0/0/CPU0:router(config)# ethernet cfm
RP/0/0/CPU0:router(config-cfm)# domain D1 level 1
RP/0/0/CPU0:router(config-cfm-dmn)# service Cross_Connect_1 xconnect group XG1 p2p
RP/0/0/CPU0:router(config-cfm-dmn-svc)# log ais
The following example shows how to configure AIS transmission on a CFM interface.
RP/0/0/CPU0:router# configure
RP/0/0/CPU0:router(config)# interface gigabitethernet 0/1/0/2
RP/0/0/CPU0:router(config-if)# ethernet cfm
RP/0/0RP0RSP0/CPU0:router(config-if-cfm)# ais transmission up interval 1m cos 7
AIS for CFM Show Commands: Examples
This section includes the following examples:
•show ethernet cfm interfaces ais Command: Example
•show ethernet cfm local meps Command: Examples
show ethernet cfm interfaces ais Command: Example
The following example shows how to display the information published in the Interface AIS table:
RP/0/0/CPU0:router# show ethernet cfm interfaces ais
Defects (from at least one peer MEP):
A - AIS received I - Wrong interval
R - Remote Defect received V - Wrong Level
L - Loop (our MAC received) T - Timed out (archived)
C - Config (our ID received) M - Missing (cross-check)
X - Cross-connect (wrong MAID) U - Unexpected (cross-check)
P - Peer port down D - Local port down
Trigger Transmission
AIS --------- Via ---------------------------
Interface (State) Dir L Defects Levels L Int Last started Packets
------------------------ --- - ------- ------- - --- ------------ --------
Gi0/1/0/0.234 (Up) Dn 5 RPC 6 7 1s 01:32:56 ago 5576
Gi0/1/0/0.567 (Up) Up 0 M 2,3 5 1s 00:16:23 ago 983
Gi0/1/0/1.1 (Dn) Up D 7 60s 01:02:44 ago 3764
Gi0/1/0/2 (Up) Dn 0 RX 1!
show ethernet cfm local meps Command: Examples
Example 1: Default
The following example shows how to display statistics for local maintenance end points (MEPs):
RP/0/0/CPU0:router# show ethernet cfm local meps
A - AIS received I - Wrong interval
R - Remote Defect received V - Wrong Level
L - Loop (our MAC received) T - Timed out (archived)
C - Config (our ID received) M - Missing (cross-check)
X - Cross-connect (wrong MAID) U - Unexpected (cross-check)
P - Peer port down
Domain foo (level 6), Service bar
ID Interface (State) Dir MEPs/Err RD Defects AIS
----- ------------------------ --- -------- -- ------- ---
100 Gi1/1/0/1.234 (Up) Up 0/0 N A 7
Domain fred (level 5), Service barney
ID Interface (State) Dir MEPs/Err RD Defects AIS
----- ------------------------ --- -------- -- ------- ---
2 Gi0/1/0/0.234 (Up) Up 3/2 Y RPC 6
Example 2: Domain Service
The following example shows how to display statistics for MEPs in a domain service:
RP/0/RSP0RP0/CPU0:router# show ethernet cfm local meps domain foo service bar detail
Domain foo (level 6), Service bar
Up MEP on GigabitEthernet0/1/0/0.234, MEP-ID 100
================================================================================
Interface state: Up MAC address: 1122.3344.5566
Peer MEPs: 0 up, 0 with errors, 0 timed out (archived)
CCM generation enabled: No
AIS generation enabled: Yes (level: 7, interval: 1s)
Sending AIS: Yes (started 01:32:56 ago)
Receiving AIS: Yes (from lower MEP, started 01:32:56 ago)
Domain fred (level 5), Service barney
Up MEP on GigabitEthernet0/1/0/0.234, MEP-ID 2
================================================================================
Interface state: Up MAC address: 1122.3344.5566
Peer MEPs: 3 up, 2 with errors, 0 timed out (archived)
Cross-check defects: 0 missing, 0 unexpected
CCM generation enabled: Yes (Remote Defect detected: Yes)
CCM defects detected: R - Remote Defect received
P - Peer port down
C - Config (our ID received)
AIS generation enabled: Yes (level: 6, interval: 1s)
Sending AIS: Yes (to higher MEP, started 01:32:56 ago)
Receiving AIS: No
Example 3: Verbose
The following example shows how to display verbose statistics for MEPs in a domain service:
Note The Discarded CCMs field is not displayed when the number is zero (0). It is unusual for the count of discarded CCMs to be any thing other than zero, since CCMs are only discarded when the limit on the number of peer MEPs is reached.
RP/0/RSP0RP0/CPU0:router# show ethernet cfm local meps domain foo service bar verbose
Domain foo (level 6), Service bar
Up MEP on GigabitEthernet0/1/0/0.234, MEP-ID 100
================================================================================
Interface state: Up MAC address: 1122.3344.5566
Peer MEPs: 0 up, 0 with errors, 0 timed out (archived)
CCM generation enabled: No
AIS generation enabled: Yes (level: 7, interval: 1s)
Sending AIS: Yes (started 01:32:56 ago)
Receiving AIS: Yes (from lower MEP, started 01:32:56 ago)
Packet Sent Received
------ ---------- -----------------------------------------------------
CCM 0 0 (out of seq: 0)
LBM 0 0
LBR 0 0 (out of seq: 0, with bad data: 0)
AIS 5576 0
LCK - 0
Domain fred (level 5), Service barney
Up MEP on GigabitEthernet0/1/0/0.234, MEP-ID 2
================================================================================
Interface state: Up MAC address: 1122.3344.5566
Peer MEPs: 3 up, 2 with errors, 0 timed out (archived)
Cross-check defects: 0 missing, 0 unexpected
CCM generation enabled: Yes (Remote Defect detected: Yes)
CCM defects detected: R - Remote Defect received
P - Peer port down
C - Config (our ID received)
AIS generation enabled: Yes (level: 6, interval: 1s)
Sending AIS: Yes (to higher MEP, started 01:32:56 ago)
Receiving AIS: No
Packet Sent Received
------ ---------- ----------------------------------------------------------
CCM 12345 67890 (out of seq: 6, discarded: 10)
LBM 5 0
LBR 0 5 (out of seq: 0, with bad data: 0)
AIS 0 46910
LCK - 0
Example 4: Detail
The following example shows how to display detailed statistics for MEPs in a domain service:
RP/0/0/CPU0:router# show ethernet cfm local meps detail
Domain foo (level 6), Service bar
Up MEP on GigabitEthernet0/1/0/0.234, MEP-ID 100
================================================================================
Interface state: Up MAC address: 1122.3344.5566
Peer MEPs: 0 up, 0 with errors, 0 timed out (archived)
CCM generation enabled: No
AIS generation enabled: Yes (level: 7, interval: 1s)
Sending AIS: Yes (started 01:32:56 ago)
Receiving AIS: Yes (from lower MEP, started 01:32:56 ago)
Domain fred (level 5), Service barney
Up MEP on GigabitEthernet0/1/0/0.234, MEP-ID 2
================================================================================
Interface state: Up MAC address: 1122.3344.5566
Peer MEPs: 3 up, 2 with errors, 0 timed out (archived)
Cross-check defects: 0 missing, 0 unexpected
CCM generation enabled: Yes (Remote Defect detected: Yes)
CCM defects detected: R - Remote Defect received
P - Peer port down
C - Config (our ID received)
AIS generation enabled: Yes (level: 6, interval: 1s)
Sending AIS: Yes (to higher MEP, started 01:32:56 ago)
Receiving AIS: No
EFD Configuration: Examples
The following example shows how to enable EFD:
RP/0/0/CPU0:router# configure
RP/0/0/CPU0:router(config)# ethernet cfm
RP/0/0/CPU0:router(config-cfm)# domain D1 level 1
RP/0/0/CPU0:router(config-cfm-dmn)# service S1 down-meps
RP/0/0/CPU0:router(config-cfm-dmn-svc)# efd
The following example shows how to enable EFD logging:
RP/0/0/CPU0:router# configure
RP/0/0/CPU0:router(config)# ethernet cfm
RP/0/0/CPU0:router(config-cfm)# domain D1 level 1
RP/0/0/CPU0:router(config-cfm-dmn)# service S1 down-meps
RP/0/0/CPU0:router(config-cfm-dmn-svc)# log efd
Displaying EFD Information: Examples
The following examples show how to display information about EFD:
•show efd interfaces Command: Example
•show ethernet cfm local meps detail Command: Example
show efd interfaces Command: Example
The following example shows how to display all interfaces that are shut down in response to an EFD action:
RP/0/0/CPU0:router# show efd interfaces
Server VLAN MA
==============
Interface Clients
-------------------------
GigE0/0/0/0.0 CFM
show ethernet cfm local meps detail Command: Example
Use the show ethernet cfm local meps detail command to display MEP-related EFD status information. The following example shows that EFD is triggered for MEP-ID 100:
RP/0/0/CPU0:router# show ethernet cfm local meps detail
Domain foo (level 6), Service bar
Up MEP on GigabitEthernet0/1/0/0.234, MEP-ID 100
================================================================================
Interface state: Up MAC address: 1122.3344.5566
Peer MEPs: 0 up, 0 with errors, 0 timed out (archived)
Cross-check errors: 2 missing, 0 unexpected
CCM generation enabled: No
AIS generation enabled: Yes (level: 7, interval: 1s)
Sending AIS: Yes (started 01:32:56 ago)
Receiving AIS: Yes (from lower MEP, started 01:32:56 ago)
EFD triggered: Yes
Domain fred (level 5), Service barney
Up MEP on GigabitEthernet0/1/0/0.234, MEP-ID 2
================================================================================
Interface state: Up MAC address: 1122.3344.5566
Peer MEPs: 3 up, 0 with errors, 0 timed out (archived)
Cross-check errors: 0 missing, 0 unexpected
CCM generation enabled: Yes (Remote Defect detected: No)
AIS generation enabled: Yes (level: 6, interval: 1s)
Sending AIS: No
Receiving AIS: No
EFD triggered: No
Note You can also verify that EFD has been triggered on an interface using the show interfaces and show interfaces brief commands. When an EFD trigger has occurred, these commands will show the interface status as up and the line protocol state as down.
Configuration Examples for Ethernet SLA
This section includes the following examples:
•Ethernet SLA Profile Type Configuration: Examples
•Ethernet SLA Probe Configuration: Examples
•Profile Statistics Measurement Configuration: Examples
•Scheduled SLA Operation Probe Configuration: Examples
•Ethernet SLA Operation Probe Scheduling and Aggregation Configuration: Example
•Ongoing Ethernet SLA Operation Configuration: Example
•On-Demand Ethernet SLA Operation Basic Configuration: Examples
•Ethernet SLA Show Commands: Examples
Ethernet SLA Profile Type Configuration: Examples
The following examples show how to configure the different profile types supported by Ethernet SLA.
Example 1
This example configures a profile named "Prof1" for CFM loopback measurements:
configure
ethernet sla
profile Prof1 type cfm-loopback
commit
Example 2
This example configures a profile named "Prof1" for CFM delay measurements. Setting this type allows you to configure the probe to measure additional one-way delay and jitter statistics:
configure
ethernet sla
profile Prof1 type cfm-delay-measurement
commit
Ethernet SLA Probe Configuration: Examples
The following examples show how to configure some of the packet options for an Ethernet CFM loopback probe.
Example 1
This example shows how to configure sending a group of 100 packets in 100 ms intervals and repeat that burst every 60 seconds. Packets are padded to a size of 9000 bytes as needed using a hexadecimal test pattern of "abcdabcd," and with a class of service value of 7:
Note The total length of a burst (packet count multiplied by the interval) must not exceed 1 minute.
configure
ethernet sla
profile Prof1 type cfm-loopback
probe
send burst every 60 seconds packet count 100 interval 100 milliseconds
packet size 9000 test pattern hex 0xabcdabcd
priority 7
commit
Example 2
This example has the same characteristics as the configuration in Example 1, but sends a single burst of 50 packets, one second apart:
configure
ethernet sla
profile Prof1 type cfm-loopback
probe
send burst once packet count 50 interval 1 second
packet size 9000 test pattern hex 0xabcdabcd
priority 7
commit
Example 3
This example shows how to configure a continuous stream of packets at 100 ms intervals for the duration of the probe. Packets are padded to a size of 9000 bytes as needed using a pseudo-random test pattern, and with a class of service value of 7:
configure
ethernet sla
profile Prof1 type cfm-loopback
probe
send burst every 60 seconds packet count 600 interval 100 milliseconds
packet size 9000 test pattern pseudo-random
priority 7
commit
Profile Statistics Measurement Configuration: Examples
The following examples show how to configure the different types of statistics measurement.
Example 1
This example shows the two available types of statistics that can be measured by a CFM loopback SLA profile type:
configure
ethernet sla
profile Prof1 type cfm-loopback
statistics measure round-trip-delay
statistics measure round-trip-jitter
commit
Example 2
This example shows how to configure measurement of round-trip delay and one-way jitter (from destination to source) for a CFM delay measurement SLA profile type:
Note The CFM delay measurement profile type supports measurement of all round-trip and one-way delay and jitter statistics.
configure
ethernet sla
profile Prof1 type cfm-delay-measurement
statistics measure round-trip-delay
statistics measure one-way-jitter-ds
commit
Scheduled SLA Operation Probe Configuration: Examples
The following examples show how to configure different schedules for an SLA operation probe.
Example 1
This example shows how to configure a probe to run hourly for a specified duration:
configure
ethernet sla
profile Prof1 type cfm-delay-measurement
schedule every 1 hours for 15 minutes
commit
Example 2
This example shows how to configure a probe to run daily for a specified period of time:
configure
ethernet sla
profile Prof1 type cfm-delay-measurement
schedule every day at 11:30 for 5 minutes
commit
Example 3
This example shows how to configure a probe to run weekly beginning at a specified time and for a specified duration:
configure
ethernet sla
profile Prof1 type cfm-delay-measurement
schedule every week on Monday at 23:30 for 1 hour
commit
Ethernet SLA Operation Probe Scheduling and Aggregation Configuration: Example
Figure 12 shows a more comprehensive example of how some of the probe scheduling and measurement configuration works using aggregation. The following configuration supports some of the concepts shown in the figure:
configure
ethernet sla profile Prof1 type cfm-loopback
probe
send packet every 60 seconds
schedule every 6 hours for 2 hours
statistics measure round-trip-delay
aggregate bins 3 width 30
buckets size 2 per-probe
buckets archive 4
commit
Figure 12 SLA Probe Scheduling Operation With Bin Aggregation
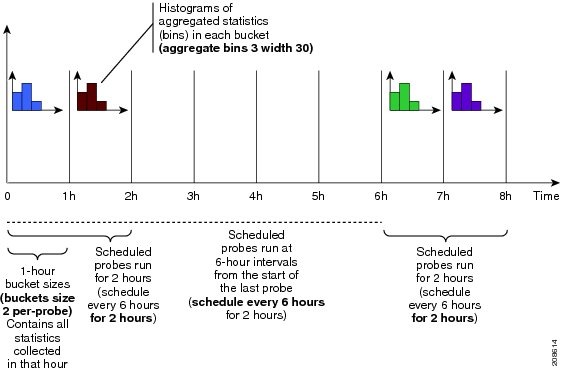
This example schedules a probe with the following characteristics:
•Sends packets 60 seconds apart (for a 2-hour probe, this results in sending 120 individual packets).
•Probe runs every 6 hours for 2 hours duration.
•Collects data into 2 buckets for every probe, so each bucket covers 1 hour of the 2-hour probe duration.
•Aggregates statistics within the buckets into 3 bins each in the following ranges:
–Bin 1 contains samples in the range 0 to < 30 ms.
–Bin 2 contains samples in the range 30 ms to < 60 ms.
–Bin 3 contains samples in the range 60 ms or greater (unbounded).
•The last 4 buckets are saved in memory.
Ongoing Ethernet SLA Operation Configuration: Example
The following example shows how to configure an ongoing Ethernet SLA operation on a MEP:
interface gigabitethernet 0/1/0/1
ethernet cfm
mep domain Dm1 service Sv1 mep-id 1
sla operation profile Profile_1 target mac-address 01:23:45:67:89:ab s
  commit
  end
On-Demand Ethernet SLA Operation Basic Configuration: Examples
The following examples show how to configure on-demand Ethernet SLA operations.
Example 1
The following example shows how to configure a basic on-demand Ethernet SLA operation for a CFM loopback probe that by default will measure round-trip delay and round-trip jitter for a one-time, 10-second operation to the target MEP:
RP/0/0/CPU0:router# ethernet sla on-demand operation type cfm-loopback probe domain D1
source interface TenGigE 0/6/1/0 target mep-id 1
Example 2
The following example shows how to configure a basic on-demand Ethernet SLA operation for a CFM delay measurement probe that by default will measure one-way delay and jitter in both directions, as well as round-trip delay and round-trip jitter for a one-time, 10-second operation to the target MEP:
RP/0/0/CPU0:router# ethernet sla on-demand operation type cfm-delay-measurement probe
domain D1 source interface TenGigE 0/6/1/0 target mep-id 1
Ethernet SLA Show Commands: Examples
The following examples show how to display information about configured SLA operations:
show ethernet sla operations Command: Example 1
RP/0/0/CPU0:router# show ethernet sla operations interface gigabitethernet 0/1/0/1.1
Interface GigabitEthernet0/1/0/1.1
Domain mydom Service myser to 00AB.CDEF.1234
-----------------------------------------------------------------------------
Profile 'business-gold'
Probe type CFM-delay-measurement:
bursts sent every 1min, each of 20 packets sent every 100ms
packets padded to 1500 bytes with zeroes
packets use priority value of 7
Measures RTT: 5 bins 20ms wide; 2 buckets/ probe; 75/100 archived
Measures Jitter (interval 1): 3 bins 40ms wide; 2 buckets/probe; 50 archived
Scheduled to run every Sunday at 4am for 2 hours:
last run at 04:00 25/05/2008
show ethernet sla configuration-errors Command: Example 2
RP/0/0/CPU0:router# show ethernet sla configuration-errors
Errors:
-------
Profile 'gold' is not defined but is used on Gi0/0/0/0.0
Profile 'red' defines a test-pattern, which is not supported by the type
The following examples show how to display the contents of buckets containing SLA metrics collected by probes:
show ethernet sla statistics current Command: Example 3
RP/0/0/CPU0:router# show ethernet sla statistics current interface GigabitEthernet
0/0/0/0.0
Interface GigabitEthernet 0/0/0/0.0
Domain mydom Service myser to 00AB.CDEF.1234
=============================================================================
Profile 'business-gold', packet type 'cfm-loopback'
Scheduled to run every Sunday at 4am for 2 hours
Round Trip Delay
~~~~~~~~~~~~~~~~
2 buckets per probe
Bucket started at 04:00 Sun 17 Feb 2008 lasting 1 hour:
Pkts sent: 2342; Lost 2 (0%); Corrupt: 0 (0%); Misordered: 0 (0%)
Min: 13ms; Max: 154ms; Mean: 28ms; StdDev: 11ms
Round Trip Jitter
~~~~~~~~~~~~~~~~~
2 buckets per probe
Bucket started at 04:00 Sun 17 Feb 2008 lasting 1 hour:
Pkts sent: 2342; Lost: 2 (0%); Corrupt: 0 (0%); Misordered: 0 (0%)
Min: -5ms; Max: 8ms; Mean: 0ms; StdDev: 3.6ms
Bucket started at 05:00 Sun 17 Feb 2008 lasting 1 hour:
Pkts sent: 2342; Lost: 2 (0%); Corrupt: 0 (0%); Misordered: 0 (0%)
Min: 0; Max: 4; Mean: 1.4; StdDev: 1
show ethernet sla statistics history detail Command: Example 4
RP/0/0/CPU0:router# show ethernet sla history detail GigabitEthernet 0/0/0/0.0
Interface GigabitEthernet 0/0/0/0.0
Domain mydom Service myser to 00AB.CDEF.1234
===============================================================================
Profile 'business-gold', packet type 'cfm-loopback'
Scheduled to run every Sunday at 4am for 2 hours
Round Trip Delay
~~~~~~~~~~~~~~~~
2 buckets per probe
Bucket started at 04:00 Sun 17 Feb 2008 lasting 1 hour:
Pkts sent: 2342; Lost: 2 (0%); Corrupt: 0 (0%); Misordered: 0 (0%)
Min: 13ms, occurred at 04:43:29 on Sun 22 Aug 2010 UTC
Max: 154ms, occurred at 05:10:32 on Sun 22 Aug 2010 UTC
Mean: 28ms; StdDev: 11ms
Results suspect as more than 10 seconds time drift detected
Results suspect as scheduling latency prevented some packets being sent
Samples:
Time sent Result Notes
------------ -------- ----------
04:00:01.324 23ms
04:00:01.425 36ms
04:00:01.525 - Timed Out
...
Round Trip Jitter
~~~~~~~~~~~~~~~~~
2 buckets per probe
Bucket started at 04:00 Sun 17 Feb 2008, lasting 1 hour:
Pkts sent: 2342; Lost: 2 (0%); Corrupt: 0 (0%); Misordered: 0 (0%)
Min: -5ms; Max: 10ms; Mean: 0ms; StdDev: 3.6ms
Samples:
Time sent Result Notes
------------ -------- ----------
04:00:01.324 -
04:00:01.425 13ms
04:00:01.525 - Timed out
...
show ethernet sla statistics history detail on-demand: Example 5
The following example shows how to display statistics for all full buckets for on-demand operations in detail:
RP/0/0/CPU0/router #show ethernet sla statistics history detail on-demand
Interface GigabitEthernet0/0/0/0.1
Domain mydom Service myser to 0123.4567.890A
=============================================================================
On-demand operation ID #1, packet type 'cfm-delay-measurement'
Started at 15:38 on 06 July 2010 UTC, runs every 1 hour for 1 hour
Round Trip Delay
~~~~~~~~~~~~~~~~
1 bucket per probe
Bucket started at 15:38 on Tue 06 Jul 2010 UTC, lasting 1 hour:
Pkts sent: 1200; Lost: 4 (0%); Corrupt: 600 (50%); Misordered: 0 (0%)
Min: 13ms, occurred at 15:43:29 on Tue 06 Jul 2010 UTC
Max: 154ms, occurred at 16:15:34 on Tue 06 Jul 2010 UTC
Mean: 28ms; StdDev: 11ms
Bins:
Range Samples Cum. Count Mean
------------ ------------ ------------ --------
0 - 20 ms 194 (16%) 194 (16%) 17ms
20 - 40 ms 735 (61%) 929 (77%) 27ms
40 - 60 ms 212 (18%) 1141 (95%) 45ms
> 60 ms 55 (5%) 1196 70ms
Bucket started at 16:38 on Tue 01 Jul 2008 UTC, lasting 1 hour:
Pkts sent: 3600; Lost: 12 (0%); Corrupt: 1800 (50%); Misordered: 0 (0%)
Min: 19ms, occurred at 17:04:08 on Tue 06 Jul 2010 UTC
Max: 70ms, occurred at 16:38:00 on Tue 06 Jul 2010 UTC
Mean: 28ms; StdDev: 11ms
Bins:
Range Samples Cum. Count Mean
------------ ------------ ------------ --------
0 - 20 ms 194 (16%) 194 (16%) 19ms
20 - 40 ms 735 (61%) 929 (77%) 27ms
40 - 60 ms 212 (18%) 1141 (95%) 45ms
> 60 ms 55 (5%) 1196 64ms
Where to Go Next
When you have configured an Ethernet interface, you can configure individual VLAN subinterfaces on that Ethernet interface.
For information about modifying Ethernet management interfaces for the shelf controller (SC), route processor (RP), and distributed RP, see the "Advanced Configuration and Modification of the Management Ethernet Interface on Cisco IOS XR Software" module later in this document.
For information about IPv6 see the Implementing Access Lists and Prefix Lists on
Cisco IOS XR Software module in the Cisco IOS XR IP Addresses and Services Configuration Guide.
Additional References
These sections provide references related to implementing Gigabit, 10-Gigabit, and Fast Ethernet interfaces.
Related Documents
Standards
MIBs
|
|
|
|---|---|
IEEE8021-CFM-MIB |
To locate and download MIBs for selected platforms using http://www.cisco.com/go/mibs |
RFCs
|
|
|
|---|---|
No new or modified RFCs are supported by this feature, and support for existing RFCs has not been modified by this feature. |
— |
 Feedback