Table Of Contents
Statistics Summary
Data Transmission Process Overview
Connection Statistics
IGX Voice Connection
IGX Data Connection
IGX Frame Relay Connection
FastPAD Voice Connection
FastPAD Switched Connection
FastPAD Data Connection
FastPAD Frame Relay Connection
UXM and URM Connection
BXM and ASI Connection
FRSM Connection
AUSM Connection
CESM Connection
PXM1 Connection
AXSM Connection
AXSM-E Connection
PXM1E Connection
FRSM12 Connection
Service Line Statistics
IGX T1 Service Line
IGX E1/J1 Service Line
BXM and ASI Service Line
CESM and FRSM E1/T1 Service Line
AUSM Service
CESM, FRSM, SRM, and SRME T3/E3 Service
SRM and SRME SONET Service Line
AXSM Line
AXSM-E Line
PXM1E Service Line
Trunk Statistics
Narrowband ATM
IPX ATM
BXM and BNI ATM Trunk
MGX Narrowband
PXM1 and BNM ATM
BNM SONET
FastPAD Trunk
UXM Trunk
Port Statistics
IGX Frame Relay Port
UXM and URM Port
BXM and ASI Port
FastPAD Port
FRSM Port
AUSM Port
IGX Voice Port
PXM1 Port
AXSM Port
BXM and ASI Virtual Port
AXSM-E Port
PXM1E Port
FRSM12 Port
AXSM Card Statistics
IMA Statistics
AXSM-E IMA Group Statistics
AXSM-E IMA Link Statistics
PXM1E IMA Group Statistics
PXM1E IMA Link Statistics
Physical Line Statistics
UXM T1 Physical Line
UXM E1 Physical Line
UXM T3/E3/OC3 Physical Line
BXM and BNI T3/E3/OC3 Physical Line
AXSM-E T1/E1 Physical Line
AXSM-E T3/E3 Physical Line
AXSM-E SONET Physical Line
FRSM12 T3 Line
FRSM12 E3 Line
PXM1E T3 Physical Line
PXM1E E3 Physical Line
PXM1E SONET Physical Line
PXM1E T1E1 Physical Line Stats
Statistics Summary
This chapter defines the statistics from the data tables listed in "Database Tables".
These statistics are collected from the following nodes:
• BPX 8600
•IGX 8400
•MGX 8220
•MGX 8230
•MGX 8250
•MGX 8850 (PXM1)
•MGX 8830
•MGX 8850 (PXM1E)
•MGX 8850 (PXM45)
•MGX 8950
The statistics are categorized under a major grouping known by an object type name and organized by the subobject type number. Within the subtype, each statistic contains a statistic type number.
The following sections provide the reporting parameters for the various statistic types:
•Connection Statistics
•Service Line Statistics
•Trunk Statistics
•Port Statistics
•AXSM Card Statistics
•IMA Statistics
•Physical Line Statistics
Note The IDs of the statistics that are collected by CWM do not correspond to the IDs of the statistics that are collected by the switch.
Data Transmission Process Overview
Statistics are collected at different points during data transmission. Figure 4-1 shows how data travels through two cards that are connected across the bus.
Figure 4-1 Data Flow Through Two Cards Connected Across a Bus
The ingress direction describes traffic that travels toward the bus. The egress direction describes traffic that travels from the bus.
The numbers in Figure 4-1 correspond to the points at which statistics are collected. Points 1-7 show data on the incoming path with policing. Points 8-13 show data on the return path without policing.
•1—Data enters the UNI/NNI port card (ingress).
•2—Data is queued (ingress).
•3—Data is scheduled for admission onto the bus (ingress).
•4—Data is queued for going onto the bus (ingress).
•5—Data is queued for being taken off the bus (egress).
•6—Data is processed on the trunk card (egress).
•7—Data is queued for going out the trunk (egress).
•8—Data enters the card from the trunk (ingress).
•9—Data is scheduled for admission onto the bus (ingress).
•10—Data is queued for going onto the bus (ingress).
•11—Data is queued for being taken off the bus (egress).
•12—Data is processed on the port card (egress).
•13—Data is queued for going out the port (egress).
Note The data flow process might vary depending on the card type. See the corresponding sections in this chapter.
Connection Statistics
The following connection statistics are applicable to CWM Release 11:
•IGX Voice Connection
•IGX Data Connection
•IGX Frame Relay Connection
•FastPAD Voice Connection
•FastPAD Switched Connection
•FastPAD Data Connection
•FastPAD Frame Relay Connection
•UXM and URM Connection
•BXM and ASI Connection
•FRSM Connection
•AUSM Connection
•CESM Connection
•PXM1 Connection
•AXSM Connection
•AXSM-E Connection
•PXM1E Connection
•FRSM12 Connection
IGX Voice Connection
This section provides information about the statistics contained in the Voice Connection group. The IGX voice connection statistics in this group are applicable to the CVM and UVM cards.
The following table lists the attributes that are common to the IGX voice connection group statistics.
Front Cards |
CVM, UVM |
Back Cards |
BC-T1, BC-E1, BC-J1, BC-Y1, UVI-2T1, UVI-2E1, UVI-2J1 |
Object Type |
0 |
Subobject Type |
0 |
Default Peak Interval |
300 seconds |
The IGX voice connection statistics are primarily used for gathering billing and performance data.
The following table includes the description of each statistic and the point during the data flow at which the statistic gathers the appropriate information. Each measurement point refers to the corresponding point in Figure 4-1.
|
Stat ID
|
IGX Voice Connection Statistics
|
Subset of Other Stats
|
Ingress/Egress Measurement Point
|
Description
|
4 |
Packets Received |
No |
— |
Provides a count of packets that are received from the Muxbus by the local port card. Range: 0 to (232-1) |
5 |
Receive Packets Discarded |
Packets Received |
— |
Provides a count of the packets that are received and discarded before the queue is transmitted out the port. Range: 0 to (232-1) |
6 |
Packets Transmitted |
No |
— |
Provides a count of the packets that are transmitted onto the Muxbus from the local port card. Range: 0 to (232-1) |
7 |
Projected Packets Transmitted |
Packets Transmitted |
— |
Provides a count of the packets that are transmitted onto the Muxbus when DSI is enabled. Range: 0 to (232-1) |
8 |
Supervisory Packets Transmitted |
Packets Transmitted |
— |
Provides a count of the number supervisory packets that are transmitted from the local port card to the Muxbus. These packets contain the voice signaling bit. Range: 0 to (232-1) |
13 |
Seconds V.25 Modem On |
No |
— |
Provides a count of the seconds that a V.25 modem is detected and the connection is upgraded to PCM. Range: 0 to (232-1) |
14 |
Seconds DSI Enabled |
No |
— |
Provides a count of the seconds that the connection is in DSI. Range: 0 to (232-1) |
15 |
Seconds Off-Hook |
No |
— |
Provides a count of the seconds that the connection is off hook. Range: 0 to (232-1) |
16 |
Seconds In Service |
No |
— |
Provides a count of the seconds that the connection is in service. The in service connection is not in alarm, the required cards are present, and the connection is routed. Range: 0 to (232-1) |
19 |
Supervisory Packets Received |
Packets Received |
— |
Provides a count of the supervisory packets that are received from the Muxbus. These packets contain the voice signaling bit. Range: 0 to (232-1) |
IGX Data Connection
This section provides information about the statistics contained in the Data Connection group. The IGX data connection statistics in this group are applicable to the CVM, UVM, LDM, and HDM cards. The following table lists the attributes that are common to the IGX data connection group statistics.
Front Cards |
CVM, UVM, LDM, HDM |
Back Cards |
BC-T1, BC-E1, BC-J1, BC-Y1, UVI-2T1, UVI-2E1, UVI-2J1 RS-232, RS-449, V35, RS-232D, 232-4, 232-8 |
Object Type |
0 |
Subobject Type |
1 |
Default Peak Interval |
300 seconds |
The IGX data connection statistics are primarily used for gathering billing and performance data.
The following table includes the description of each statistic and the point during the data flow at which the statistic gathers the appropriate information. Each measurement point refers to the corresponding point in Figure 4-1.
|
Stat ID
|
IGX Data Connection Statistics
|
Subset of Other Stats
|
Ingress/Egress Measurement Point
|
Description
|
4 |
Packets Received |
No |
— |
Provides a count of the packets that are received from the local port card. Range: 0 to (232-1) |
5 |
Receive Packets Discarded |
Packets Received |
— |
Provides a count of the packets that are received then discarded before the queue is transmitted out of the port. Range: 0 to (232-1) |
6 |
Packets Transmitted |
No |
— |
Provides a count of the packets transmitted onto the Muxbus from the local port card. Range: 0 to (232-1) |
7 |
Projected Packets Transmitted |
Packets Transmitted |
— |
Provides a count of the packets that are transmitted onto the Muxbus when DFM is enabled. Range: 0 to (232-1) |
8 |
Supervisory Packets Transmitted |
Packets Transmitted |
— |
Provides a count of the supervisory packets that are transmitted from the local port card to the Muxbus. These packets contain the data channel EIA lead transitions. Range: 0 to (232-1) |
16 |
Seconds In Service |
No |
— |
Provides a count of the seconds in service. The in service connection is not in alarm, the required cards are present, and connection is routed. Range: 0 to (232-1) |
19 |
Supervisory Packets Received |
Packets Received |
— |
Provides a count of the supervisory packets that are transmitted from the local port card to the Muxbus. These packets contain the data channel EIA lead transitions. Range: 0 to (232-1) |
IGX Frame Relay Connection
This section provides information about the statistics contained in the Frame Relay Connection group. The IGX Frame Relay connection statistics in this group are applicable to the FRM and UFM cards. This group is also applicable to FastPAD connections.
The following table lists the attributes that are common to the IGX Frame Relay connection statistics.
Front Cards |
FRM, UFM, FTM (FastPAD) |
Back Cards |
BC-T1, BC-E1, BC-J1 FastPAD: FPC T1, FPC E1, FPC V.35, and
FPC X.21. |
Object Type |
0 |
Subobject Subobject Type |
2 |
Default Peak Interval |
300 seconds |
The IGX Frame Relay connection statistics are primarily used for gathering billing and performance data.
The following table includes the description of each statistic and the point during the data flow at which the statistic gathers the appropriate information. Each measurement point refers to the corresponding point in Figure 4-1, with the exception of the following ingress points:
•1—Frame is validated against errors at the port level, for example CRC, alignment errors, and an undefined DCLI.
•2—Frame is checked for queue depth and queue threshold.
•3—Policing occurs.
•4—Frame is queued and transmitted to cell bus in ATM cells.
|
Stat ID
|
IGX Frame Relay Connection Statistics
|
Subset of Other Stats
|
Ingress/Egress Measurement Point
|
Description
|
0 |
Frames Received |
No |
After validating the frame against errors-1 |
Provides a count of frames received from the attached equipment. This statistic also increments when the received frame is discarded for one of the following reasons: •Queue depth exceeded. •DE threshold exceeded for frames with DE bit set. •Usage parameter control (UPC) discard. •Unknown protocols in service interworking (SIW) translation. Range: 0 to (232-1) |
1 |
Receive Frames Discarded |
Frames Received |
Ingress-2, 3 |
Provides a count of the discarded frames received from the attached equipment. Possible reasons for discard include •Frames are received with DE equal to 1 and the PVC ingress queue is filled at least to the DE threshold. Frames discarded for this reason are counted in the PVC DE Frames Dropped statistic. •Frames are received with DE equal to 0, but have been DE tagged because of policing. In addition, the PVC ingress queue is filled at least to the DE threshold. Frames discarded for this reason are counted in the PVC DE Frames Dropped statistic. •PVC ingress queue is full. The queue might fill (and overflow) due to sustained transmission above the PVC committed information rate (CIR). Frames discarded for this reason are counted in the PVC Rx Frames Discarded VC Q Overflow statistic. •Frames do not pass policing. Frames discarded for this reason are counted in the PVC Rx Frames Discarded UPC statistic. •Protocols encoded in SIW frame are unknown. Frames discarded for this reason are counted in the PVC Rx Frames Unknown Protocols statistic. Range: 0 to (232-1) |
2 |
Frames Transmitted |
No |
Egress-13 |
Provides a count of the frames that are transmitted to the attached equipment after frame reassembling. Range: 0 to (232-1) |
3 |
Transmit Frames Discarded |
No |
Egress-12, 13 |
Provides a count of the number of frames unable to be transmitted to the attached equipment. Possible reasons for discard include •PVC transmit queue overflow—The frame traversed the network successfully but encountered a full egress VC queue. Frames discarded for this reason are counted in the PVC Tx Frames Discarded-VC -Q-Overflow statistic. •Incomplete frame at egress—No end-of-frame (EOF) cell was received. The EOF cell is missing due to discards in the network and the timer expiring. Frames discarded for this reason are counted in the Tx Frames Discarded-Trunk Discard statistic. •Incorrect frame length—The expected frame length (recorded in the EOF cell) is different than the length of payload of that frame. This error might be caused by cells missing due to discards on a trunk, or by an EOF cell transmission bit error in the frame length field. Frames discarded for this reason are counted in the Tx Frame Length Violation statistic. •Invalid frame length—The frame is longer than
4510 octets long. The EOF cell from one frame is missing due to discards on a trunk, resulting in a concatenated frame. Frames discarded for this reason are counted in the PVC Tx Frames Discarded Oversized SDUs statistic. •Frame CRC error—The calculated CRC does not match the original frame CRC (contained within the EOF cell). This mismatch occurs due to payload bit transmission errors on the cells or because of lost cells. Frames discarded for this reason are counted in the PVC Tx Frames Discarded Ingress CRC. •Port inactive—Logical port on which the connection is mapped is not active. Frames discarded for this reason are not counted in any statistic. •Unknown protocols—Protocols encoded in SIW frame are not defined. Frames discarded for this reason are counted in the PVC Tx Frames Unknown Protocols statistic. •Common part indicator (CPI) error—CPI bit in the AAL5 PDU received from the network is non-zero. Frames discarded for this reason are counted in the PVC Tx Frames Invalid CPIs statistic. Range: 0 to (232-1) |
4 |
Packets Received |
No |
Ingress-1 |
Provides a count of the packets that are received. Range: 0 to (232-1) |
5 |
Receive Packets Discarded |
Packets Received |
Ingress-1 |
Provides a count of the packets that are received. Range: 0 to (232-1) |
6 |
Packets Transmitted |
No |
Egress-13 |
Provides a count of the packets that are transmitted. Range: 0 to (232-1) |
9 |
Bytes Received |
No |
After validating the frame against errors-1 |
Provides the number of bytes in the frames counted by the Frames Received statistic. The count includes Frame Relay header and frame check sequence (FCS)/cyclic redundancy check (CRC) bytes. Range: 0 to (232-1) |
10 |
Receive Bytes Discarded |
Bytes Received |
Ingress-2, 3 |
Provides the number of bytes in the frames counted by the Receive Frames Discarded statistic. The count includes Frame Relay header and FCS/CRC bytes. Range: 0 to (232-1) |
11 |
Bytes Transmitted |
No |
Egress-13 |
Provides the number of bytes in the frames counted by the Frames Transmitted statistic. The count includes Frame Relay header and FCS/CRC bytes. Range: 0 to (232-1) |
12 |
Transmit Bytes Discarded |
No |
Egress-12, 13 |
Provides the number of bytes in the frames counted by the Transmit Frames Discarded statistic. The count includes Frame Relay header and FCS/CRC bytes. Range: 0 to (232-1) |
16 |
Seconds In Service |
No |
Not applicable |
Provides a count of the seconds that the permanent virtual circuit (PVC) is in service without any alarms. Range: 0 to (232-1) |
17 |
Frames Transmitted with FECN |
Frames Transmitted |
Egress-13 |
Provides a count of the frames with the forward explicit congestion notification (FECN) bit set that are transmitted to the attached equipment. The congestion can occur anywhere in the network. Range: 0 to (232-1) |
18 |
Frames Transmitted with BECN |
Frames Transmitted |
Egress-13 |
Provides a count of the frames with the backward explicit congestion notification (BECN) bit set that are transmitted to the attached equipment. The congestion can occur anywhere in the network. Range: 0 to (232-1) |
20 |
Minutes Congested |
No |
Not applicable |
Provides a counts of the minutes when at least 50% of the frames are tagged FECN by the Frame Relay packet. Range: 0 to (232-1) |
21 |
DE Frames Received |
Frames Received |
After validating the frame against errors-1 |
Provides a count of the frames with the discard eligible (DE) bit set that are received from the attached equipment. Range: 0 to (232-1) |
22 |
DE Frames Transmitted |
Frames Transmitted |
Egress-13 |
Provides a count of the frames with the DE bit set that are transmitted to the attached equipment. Range: 0 to (232-1) |
23 |
DE Frames Dropped |
Frames Received Receive Frames Discarded DE Frames Received |
Ingress-2 |
Provides a count of the frames with the DE bit set that are discarded. These frames are dropped when the connection ingress buffer exceeds the DE threshold. Range: 0 to (232-1) |
24 |
DE Bytes Received |
Bytes Received |
Before policing-1 |
Provides the number of bytes in the frames counted by the DE Frames Received statistic. The count includes Frame Relay header and FCS/CRC bytes. Range: 0 to (232-1) |
25 |
Frames Rx in Excess of CIR |
Frames Received |
Ingress-2 |
Provides a count of the frames received that are in excess of the committed information rate (CIR). Range: 0 to (232-1) |
26 |
Bytes Rx in Excess of CIR |
Bytes Received |
— |
Provides a count of the bytes received in that are in excess of the CIR. Range: 0 to (232-1) |
27 |
Frames Tx in Excess of CIR |
Frames Transmitted |
Egress-13 |
Provides a count of the frames transmitted that are in excess of the CIR. Range: 0 to (232-1) |
28 |
Bytes Tx in Excess of CIR |
Bytes Transmitted |
— |
Provides a count of the bytes transmitted that are in excess of the CIR. Range: 0 to (232-1) |
29 |
IWF Frames Rx and Aborted |
Frames Received |
— |
Provides a count of the IWF frames that are received and then aborted. Range: 0 to (232-1) |
30 |
IWF Frames Rx- EFCI Bit Set |
Frames Received |
— |
Provides a count of the IWF frames received that have the explicit forward congestion indication (EFCI) bit set. Range: 0 to (232-1) |
31 |
Rx Frames Discarded- Deroute/Down |
Frames Received |
— |
Provides a count of the frames that are discarded due to administratively downed connections. Range: 0 to (232-1) |
32 |
Rx Bytes Discarded- Deroute/Down |
Bytes Received |
— |
Provides a count of the bytes that are discarded due to administratively downed connections. Range: 0 to (232-1) |
33 |
Rx Frames Discarded- VC-Q-Overflow |
Frames Received Receive Frames Discarded |
Ingress-2 |
Provides a count of the frames received from the CPE that are discarded because the virtual channel (VC) queue (PVC ingress buffer) is full. Range: 0 to (232-1) |
34 |
Rx Bytes Discarded- VC-Q-Overflow |
Bytes Received Receive Bytes Discarded |
Ingress-2 |
Provides the number of bytes in the frames counted by the Rx Frames Discarded VC-Q-Overflow statistic. The count includes Frame Relay header and FCS/CRC bytes. Range: 0 to (232-1) |
35 |
Tx Frames Discarded-Q-
Overflow |
Transmit Frames Discarded |
Egress-12 |
Provides a count of the frames that are not transmitted to the attached equipment because either the PVC egress buffer (VC queue) or the port queue is full. Range: 0 to (232-1) |
36 |
Tx Bytes Discarded- Q-Overflow |
Transmit Bytes Discarded |
Egress-12 |
Provides the number of bytes in the frames counted by the Tx Frames Discarded-Q-Overflow statistic. The count includes Frame Relay header and FCS/CRC bytes. Range: 0 to (232-1) |
37 |
Tx Frames Discarded- Ingress CRC |
Transmit Frames Discarded |
Egress-12 |
Provides a count of the frames that are not transmitted to the attached equipment because of an incorrect CRC. The received CRC, included in the end of frame (EOF), is compared to the calculated CRC on the contents of all the cells that arrive. An incorrect CRC is caused by at least one cell missing due to discard(s) on a trunk or to a transmission bit error on a payload bit. Range: 0 to (232-1) |
38 |
Tx Bytes Discarded- Ingress CRC |
Transmit Bytes Discarded |
— |
Provides a count of the bytes that are discarded due to ingress CRC or length errors. Range: 0 to (232-1) |
39 |
Tx Frames Discarded -Trunk Discard |
Transmit Frames Discarded |
Egress-12 |
Provides a count of the frames that are not transmitted to the attached equipment because the EOF cells are discarded in the network or the reassembly timer expires. Range: 0 to (232-1) |
40 |
Tx Bytes Discarded-Trunk Discard |
Transmit Bytes Discarded |
— |
Provides a count of the bytes that are discarded due to trunk CRC or length errors. Range: 0 to (232-1) |
41 |
Tx Frames during Ingress LMI Fail |
Frames Transmitted |
Egress-13 |
Provides a count of the frames that are transmitted to the attached equipment while the local management interface (LMI) signaling protocol on the local port failed. The portSignallingState object displayed is in an LMI failure state. Range: 0 to (232-1) |
42 |
Tx Bytes during Ingress LMI Fail |
Bytes Transmitted |
Egress-13 |
Provides a count of bytes in the frames counted in the Tx Frames during Ingress LMI Fail statistic. The count includes the Frame Relay header and FCS/CRC bytes. Range: 0 to (232-1) |
43 |
Total Dropped Frames |
No |
— |
Provides a count of the total frames that are dropped before the queue is transmitted. Range: 0 to (232-1) |
44 |
Frames Received with BECN |
Frames Received |
Ingress-2 |
Provides a count of the frames that are received with the BECN bit set. Range: 0 to (232-1) |
45 |
Frames Received with FECN |
Frames Received |
Ingress-2 |
Provides a count of the frames that are received with the FECN bit set. Range: 0 to (232-1) |
46 |
Frames Switched |
No |
— |
Provides a count of the frames that are switched. Range: 0 to (232-1) |
FastPAD Voice Connection
This section provides information about the statistics contained in the FastPAD Voice group. The following table lists the attributes that are common to the FastPAD voice connection statistics.
Front Cards |
FTM |
Back Cards |
FPC-T1, FPC-E1, FPC-V35, FPC-X21 |
Object Type |
0 |
Subobject Type |
3 |
Default Peak Interval |
300 seconds |
The FastPAD voice connection statistics are primarily used for gathering billing and performance data.
The following table includes the description of each statistic and the point during the data flow at which the statistic gathers the appropriate information. Each measurement point refers to the corresponding point in Figure 4-1.
|
Stat ID
|
FastPAD Voice Connection Statistics
|
Subset of Other Stats
|
Ingress/Egress Measurement Point
|
Description
|
0 |
Frames Received |
No |
— |
Provides a count of the frames that are received by the local FastPAD port. Range: 0 to (232-1) |
1 |
Receive Frames Discarded |
Frames Received |
— |
Provides a count of the frames that are discarded by the local FastPAD before the queue is transmitted onto the bus. Range: 0 to (232-1) |
2 |
Frames Transmitted |
No |
— |
Provides a count of the frames that are transmitted out of the local FastPAD port. Range: 0 to (232-1) |
3 |
Transmit Frames Discarded |
Frames Transmitted |
— |
Provides a count of the frames that are discarded by the local FastPAD before the queue is transmitted out the port. Range: 0 to (232-1) |
4 |
Packet Received |
No |
— |
Provides a count of the packets that are received from the bus by the local port card. Range: 0 to (232-1) |
5 |
Receive Packets Discarded |
Packets |
— |
Provides a count of the packets that are received from the bus by the local port card and discarded. These packets are discarded before the queue is transmitted out of the port. Range: 0 to (232-1) |
6 |
Packets Transmitted |
No |
— |
Provides a count of the packets that are transmitted onto the bus from the local port card. Range: 0 to (232-1) |
9 |
Bytes Received |
No |
— |
Provides a count of the frame bytes that are received by the local FastPAD port. Range: 0 to (232-1) |
10 |
Receive Bytes Discarded |
Bytes Received |
— |
Provides a count of the frame bytes that are received and then discarded by the local FastPAD port. Range: 0 to (232-1) |
11 |
Bytes Transmitted |
No |
— |
Provides a count of the frame bytes that are received from the bus and then transmitted out the FastPAD port. Range: 0 to (232-1) |
12 |
Transmit Bytes Discarded |
Bytes Transmitted |
— |
Provides a count of the frame bytes that are received from the bus then discarded before transmitting out of the FastPAD port. Bytes can be discarded for the following reasons: •Age of the frame •Cyclic redundancy check (CRC) errors •Lack of buffer space Range: 0 to (232-1) |
16 |
Seconds in Service |
No |
— |
Provides a count of the seconds in service (not in alarm) that the required cards are present, and the connection is routed. Range: 0 to (232-1) |
17 |
Frames Transmitted with FECN |
Frames Transmitted |
— |
Provides a count of the frames that are transmitted with the forward explicit congestion notification (FECN) bit set. Range: 0 to (232-1) |
18 |
Frames Transmitted with BECN |
Frames Transmitted |
— |
Provides a count of the frames that are transmitted with the backward explicit congestion notification (BECN) bit set. Range: 0 to (232-1) |
20 |
Minutes Congested |
No |
— |
Provides a count of the minutes when at least 50% of the frames are tagged FECN by FastPAD. Range: 0 to (232-1) |
21 |
DE Frames Received |
Frames Received |
— |
Provides a count of the frames that are received with the discard eligible (DE) bit set by the local FastPAD port. Range: 0 to (232-1) |
22 |
DE Frames Transmitted |
Frames Transmitted |
— |
Provides a count of the frames that are transmitted with the DE bit set by the local FastPAD port. Range: 0 to (232-1) |
23 |
DE Frames Dropped |
No |
— |
Provides a count of the frames that are received with the DE bit set then dropped before being transmitted onto the bus. Range: 0 to (232-1) |
24 |
DE Bytes Received |
Bytes Received |
— |
Provides a count of the number bytes that are received with the DE bit set. Range: 0 to (232-1) |
25 |
Frames Rx in Excess of CIR |
Frames Received |
— |
Provides a count of the frames that are received in excess of the committed information rate (CIR). Range: 0 to (232-1) |
26 |
Bytes Rx in Excess of CIR |
Bytes Received |
— |
Provides a count of the bytes that are received in excess of CIR. Range: 0 to (232-1) |
27 |
Frames Tx in Excess of CIR |
Frames Transmitted |
— |
Provides a count of the frames that are transmitted in excess of CIR. Range: 0 to (232-1) |
28 |
Bytes Tx in Excess of CIR |
Bytes Transmitted |
— |
Provides a count of the bytes that are transmitted in excess of CIR. Range: 0 to (232-1) |
31 |
Rx Frames Discarded-Deroute/
Down |
Frames Received |
— |
Provides a count of the frames that are discarded due to administratively downed connections. Range: 0 to (232-1) |
32 |
Rx Bytes Discarded-Deroute/
Down |
Bytes Received |
— |
Provides a count of the bytes that are discarded due to administratively downed connections. Range: 0 to (232-1) |
33 |
Rx Frames Discarded- VC-Q-Overflow |
Frames Received |
— |
Provides a count of the frames that are discarded due to virtual circuit (VC) queue overflow. Range: 0 to (232-1) |
34 |
Rx Bytes Discarded- VC-Q-Overflow |
Bytes Received |
— |
Provides a count of the bytes that are discarded due to VC queue overflow. Range: 0 to (232-1) |
35 |
Tx Frames Discarded-Q-
Overflow |
Frames Transmitted |
— |
Provides a count of the frames that are discarded due to transmit queue overflow. Range: 0 to (232-1) |
36 |
Tx Bytes Discarded- Q- Overflow |
Bytes Transmitted |
— |
Provides a count of the bytes that are discarded due to transmit queue overflow. Range: 0 to (232-1) |
37 |
Tx Frames Discarded- Ingress CRC |
Frames Transmitted |
— |
Provides a count of the frames that are discarded due to ingress CRC or length errors. Range: 0 to (232-1) |
38 |
Tx Bytes Discarded Ingress CRC |
Bytes Transmitted |
— |
Provides a count of the bytes that are discarded due to ingress CRC or length errors. Range: 0 to (232-1) |
39 |
Tx Frames Discarded- Trunk Discard |
Frames Transmitted |
— |
Provides a count of the frames that are discarded due to trunk CRC or length errors. Range: 0 to (232-1) |
40 |
Tx Bytes Discarded- Trunk Discard |
Bytes Transmitted |
— |
Provides a count of the bytes that are discarded due to trunk CRC or length errors. Range: 0 to (232-1) |
41 |
Tx Frames during Ingress LMI Fail |
Frames Transmitted |
— |
Provides a count of the frames that are transmitted during an LMI failure in the ingress direction. Range: 0 to (232-1) |
42 |
Tx Bytes during Ingress LMI Fail |
Bytes Transmitted |
— |
Provides a count of the bytes that are transmitted during an LMI failure in the ingress direction. Range: 0 to (232-1) |
FastPAD Switched Connection
This section provides information about the statistics contained in the FastPAD Switched Voice group. The following table lists the attributes that are common to the FastPAD switched connection statistics.
Front Cards |
FTM |
Back Cards |
FPC-T1, FPC-E1, FPC-V35, FPC-X21 |
Object Type |
0 |
Subobject Type |
4 |
Default Peak Interval |
300 seconds |
The FastPAD switched connection statistics are primarily used for gathering billing and performance data.
The following table includes the description of each statistic and the point during the data flow at which the statistic gathers the appropriate information. Each measurement point refers to the corresponding point in Figure 4-1.
|
Stat ID
|
FastPAD Switched Connection Statistics
|
Subset of Other Stats
|
Ingress/Egress Measurement Point
|
Description
|
0 |
Frames Received |
No |
— |
Provides a count of the frames that are received by the local FastPAD port. Range: 0 to (232-1) |
1 |
Receive Frames Discarded |
Frames Received |
— |
Provides a count of the frames that are discarded by the local FastPAD before the queue is transmitted onto the bus. Range: 0 to (232-1) |
2 |
Frames Transmitted |
No |
— |
Provides a count of the frames that are transmitted out of the local FastPAD port. Range: 0 to (232-1) |
3 |
Transmit Frames Discarded |
Frames Transmitted |
— |
Provides a count of the frames that are discarded by the local FastPAD before the queue is transmitted out the port. Range: 0 to (232-1) |
4 |
Packet Received |
No |
— |
Provides a count of the packets that are received from the bus by the local port card. Range: 0 to (232-1) |
5 |
Receive Packets Discarded |
Packets Received |
— |
Provides a count of the packets that are received from the bus by the local port card and discarded. These packets are discarded before the queue is transmitted out of the port. Range: 0 to (232-1) |
6 |
Packets Transmitted |
No |
— |
Provides a count of the packets that are transmitted onto the bus from the local port card. Range: 0 to (232-1) |
9 |
Bytes Received |
No |
— |
Provides a count of the frame bytes that are received by the local FastPAD port. Range: 0 to (232-1) |
10 |
Receive Bytes Discarded |
Bytes Received |
— |
Provides a count of the frame bytes that are received and then discarded by the local FastPAD port. Range: 0 to (232-1) |
11 |
Bytes Transmitted |
No |
— |
Provides a count of the frame bytes that are received from the bus and then transmitted out the FastPAD port. Range: 0 to (232-1) |
12 |
Transmit Bytes Discarded |
Bytes Transmitted |
— |
Provides a count of the frame bytes that are received from the bus then discarded before transmitting out of the FastPAD port. Bytes can be discarded for the following reasons: •Age of the frame •Cyclic redundancy check (CRC) errors •Lack of buffer space Range: 0 to (232-1) |
16 |
Seconds in Service |
No |
— |
Provides a count of the seconds in service (not in alarm) that the required cards are present, and the connection is routed. Range: 0 to (232-1) |
17 |
Frames Transmitted with FECN |
Frames Transmitted |
— |
Provides a count of the frames that are transmitted with the forward explicit congestion notification (FECN) bit set. Range: 0 to (232-1) |
18 |
Frames Transmitted with BECN |
Frames Transmitted |
— |
Provides a count of the frames that are transmitted with the backward explicit congestion notification (BECN) bit set. Range: 0 to (232-1) |
20 |
Minutes Congested |
No |
— |
Provides a count of the minutes when at least 50% of the frames are tagged FECN by FastPAD. Range: 0 to (232-1) |
21 |
DE Frames Received |
Frames Received |
— |
Provides a count of the frames that are received with the discard eligible (DE) bit set by the local FastPAD port. Range: 0 to (232-1) |
22 |
DE Frames Transmitted |
Frames Transmitted |
— |
Provides a count of the frames that are transmitted with the DE bit set by the local FastPAD port. Range: 0 to (232-1) |
23 |
DE Frames Dropped |
No |
— |
Provides a count of the frames that are received with the DE bit set then dropped before being transmitted onto the bus. Range: 0 to (232-1) |
24 |
DE Bytes Received |
Bytes Received |
— |
Provides a count of the number bytes that are received with the DE bit set. Range: 0 to (232-1) |
25 |
Frames Rx in Excess of CIR |
Frames Received |
— |
Provides a count of the frames that are received in excess of the committed information rate (CIR). Range: 0 to (232-1) |
26 |
Bytes Rx in Excess of CIR |
Bytes Received |
— |
Provides a count of the bytes that are received in excess of CIR. Range: 0 to (232-1) |
27 |
Frames Tx in Excess of CIR |
Frames Transmitted |
— |
Provides a count of the frames that are transmitted in excess of CIR. Range: 0 to (232-1) |
28 |
Bytes Tx in Excess of CIR |
Bytes Transmitted |
— |
Provides a count of the bytes that are transmitted in excess of CIR. Range: 0 to (232-1) |
31 |
Rx Frames Discarded-Deroute/
Down |
Frames Received |
— |
Provides a count of the frames that are discarded due to administratively downed connections. Range: 0 to (232-1) |
32 |
Rx Bytes Discarded-Deroute/
Down |
Bytes Received |
— |
Provides a count of the bytes that are discarded due to administratively downed connections. Range: 0 to (232-1) |
33 |
Rx Frames Discarded- VC-Q-Overflow |
Frames Received |
— |
Provides a count of the frames that are discarded due to virtual circuit (VC) queue overflow. Range: 0 to (232-1) |
34 |
Rx Bytes Discarded- VC-Q-Overflow |
Bytes Received |
— |
Provides a count of the bytes that are discarded due to VC queue overflow. Range: 0 to (232-1) |
35 |
Tx Frames Discarded-Q-
Overflow |
Frames Transmitted |
— |
Provides a count of the frames that are discarded due to transmit queue overflow. Range: 0 to (232-1) |
36 |
Tx Bytes Discarded- Q-Overflow |
Bytes Transmitted |
— |
Provides a count of the bytes that are discarded due to transmit queue overflow. Range: 0 to (232-1) |
37 |
Tx Frames Discarded- Ingress CRC |
Frames Transmitted |
— |
Provides a count of the frames that are discarded due to ingress CRC or length errors. Range: 0 to (232-1) |
38 |
Tx Bytes Discarded Ingress CRC |
Bytes Transmitted |
— |
Provides a count of the bytes that are discarded due to ingress CRC or length errors. Range: 0 to (232-1) |
39 |
Tx Frames Discarded- Trunk Discard |
Frames Transmitted |
— |
Provides a count of the frames that are discarded due to trunk CRC or length errors. Range: 0 to (232-1) |
40 |
Tx Bytes Discarded- Trunk Discard |
Bytes Transmitted |
— |
Provides a count of the bytes that are discarded due to trunk CRC or length errors. Range: 0 to (232-1) |
41 |
Tx Frames during Ingress LMI Fail |
Frames Transmitted |
— |
Provides a count of the frames that are transmitted during an LMI failure in the ingress direction. Range: 0 to (232-1) |
42 |
Tx Bytes during Ingress LMI Fail |
Bytes Transmitted |
— |
Provides a count of the bytes that are transmitted during an LMI failure in the ingress direction. Range: 0 to (232-1) |
FastPAD Data Connection
This section provides information about the statistics contained in the FastPAD Data group. The following table lists the attributes that are common to the FastPAD data connection statistics.
Front Cards |
FTM |
Back Cards |
FPC-T1, FPC-E1, FPC-V35, FPC-X21 |
Object Type |
0 |
Subobject Type |
5 |
Default Peak Interval |
300 seconds |
The FastPAD data connection statistics are primarily used for gathering billing and performance data.
The following table includes the description of each statistic and the point during the data flow at which the statistic gathers the appropriate information. Each measurement point refers to the corresponding point in Figure 4-1.
|
Stat ID
|
FastPAD Data Connection Statistics
|
Subset of Other Stats
|
Ingress/Egress Measurement Point
|
Description
|
0 |
Frames Received |
No |
— |
Provides a count of the frames that are received by the local FastPAD port. Range: 0 to (232-1) |
1 |
Receive Frames Discarded |
Frames Received |
— |
Provides a count of the frames that are discarded by the local FastPAD before the queue is transmitted onto the bus. Range: 0 to (232-1) |
2 |
Frames Transmitted |
No |
— |
Provides a count of the frames that are transmitted out of the local FastPAD port. Range: 0 to (232-1) |
3 |
Transmit Frames Discarded |
Frames Transmitted |
— |
Provides a count of the frames that are discarded by the local FastPAD before the queue is transmitted out the port. Range: 0 to (232-1) |
4 |
Packet Received |
No |
— |
Provides a count of the packets that are received from the bus by the local port card. Range: 0 to (232-1) |
5 |
Receive Packets Discarded |
Packets Received |
— |
Provides a count of the packets that are received from the bus by the local port card and discarded. These packets are discarded before the queue is transmitted out of the port. Range: 0 to (232-1) |
6 |
Packets Transmitted |
No |
— |
Provides a count of the packets that are transmitted onto the bus from the local port card. Range: 0 to (232-1) |
9 |
Bytes Received |
No |
— |
Provides a count of the frame bytes that are received by the local FastPAD port. Range: 0 to (232-1) |
10 |
Receive Bytes Discarded |
Bytes Received |
— |
Provides a count of the frame bytes that are received and then discarded by the local FastPAD port. Range: 0 to (232-1) |
11 |
Bytes Transmitted |
No |
— |
Provides a count of the frame bytes that are received from the bus and then transmitted out the FastPAD port. Range: 0 to (232-1) |
12 |
Transmit Bytes Discarded |
Bytes Transmitted |
— |
Provides a count of the frame bytes that are received from the bus then discarded before transmitting out of the FastPAD port. Bytes can be discarded for the following reasons: •Age of the frame •Cyclic redundancy check (CRC) errors •Lack of buffer space Range: 0 to (232-1) |
16 |
Seconds in Service |
No |
— |
Provides a count of the seconds in service (not in alarm) that the required cards are present, and the connection is routed. Range: 0 to (232-1) |
17 |
Frames Transmitted with FECN |
Frames Transmitted |
— |
Provides a count of the frames that are transmitted with the forward explicit congestion notification (FECN) bit set. Range: 0 to (232-1) |
18 |
Frames Transmitted with BECN |
Frames Transmitted |
— |
Provides a count of the frames that are transmitted with the backward explicit congestion notification (BECN) bit set. Range: 0 to (232-1) |
20 |
Minutes Congested |
No |
— |
Provides a count of the minutes when at least 50% of the frames are tagged FECN by FastPAD. Range: 0 to (232-1) |
21 |
DE Frames Received |
Frames Received |
— |
Provides a count of the frames that are received with the discard eligible (DE) bit set by the local FastPAD port. Range: 0 to (232-1) |
22 |
DE Frames Transmitted |
Frames Transmitted |
— |
Provides a count of the frames that are transmitted with the DE bit set by the local FastPAD port. Range: 0 to (232-1) |
23 |
DE Frames Dropped |
No |
— |
Provides a count of the frames that are received with the DE bit set then dropped before being transmitted onto the bus. Range: 0 to (232-1) |
24 |
DE Bytes Received |
Bytes Received |
— |
Provides a count of the number bytes that are received with the DE bit set. Range: 0 to (232-1) |
25 |
Frames Rx in Excess of CIR |
Frames Received |
— |
Provides a count of the frames that are received in excess of the committed information rate (CIR). Range: 0 to (232-1) |
26 |
Bytes Rx in Excess of CIR |
Bytes Received |
— |
Provides a count of the bytes that are received in excess of CIR. Range: 0 to (232-1) |
27 |
Frames Tx in Excess of CIR |
Frames Transmitted |
— |
Provides a count of the frames that are transmitted in excess of CIR. Range: 0 to (232-1) |
28 |
Bytes Tx in Excess of CIR |
Bytes Transmitted |
— |
Provides a count of the bytes that are transmitted in excess of CIR. Range: 0 to (232-1) |
31 |
Rx Frames Discarded-Deroute/
Down |
Frames Received |
— |
Provides a count of the frames that are discarded due to administratively downed connections. Range: 0 to (232-1) |
32 |
Rx Bytes Discarded-Deroute/
Down |
Bytes Received |
— |
Provides a count of the bytes that are discarded due to administratively downed connections. Range: 0 to (232-1) |
33 |
Rx Frames Discarded- VC-Q-Overflow |
Frames Received |
— |
Provides a count of the frames that are discarded due to virtual circuit (VC) queue overflow. Range: 0 to (232-1) |
34 |
Rx Bytes Discarded- VC-Q-Overflow |
Bytes Received |
— |
Provides a count of the bytes that are discarded due to VC queue overflow. Range: 0 to (232-1) |
35 |
Tx Frames Discarded-Q-
Overflow |
Frames Transmitted |
— |
Provides a count of the frames that are discarded due to transmit queue overflow. Range: 0 to (232-1) |
36 |
Tx Bytes Discarded- Q-Overflow |
Bytes Transmitted |
— |
Provides a count of the bytes that are discarded due to transmit queue overflow. Range: 0 to (232-1) |
37 |
Tx Frames Discarded- Ingress CRC |
Frames Transmitted |
— |
Provides a count of the frames that are discarded due to ingress CRC or length errors. Range: 0 to (232-1) |
38 |
Tx Bytes Discarded Ingress CRC |
Bytes Transmitted |
— |
Provides a count of the bytes that are discarded due to ingress CRC or length errors. Range: 0 to (232-1) |
39 |
Tx Frames Discarded- Trunk Discard |
Frames Transmitted |
— |
Provides a count of the frames that are discarded due to trunk CRC or length errors. Range: 0 to (232-1) |
40 |
Tx Bytes Discarded- Trunk Discard |
Bytes Transmitted |
— |
Provides a count of the bytes that are discarded due to trunk CRC or length errors. Range: 0 to (232-1) |
42 |
Tx Bytes during Ingress LMI Fail |
Bytes Transmitted |
— |
Provides a count of the bytes that are transmitted during an LMI failure in the ingress direction. Range: 0 to (232-1) |
FastPAD Frame Relay Connection
This section provides information about the statistics contained in the FastPAD Frame Relay group. The following table lists the attributes that are common to the FastPAD Frame Relay connection statistics.
Front Card |
FTM |
Back Cards |
FPC-T1, FPC-E1, FPC-V35, FPC-X21 |
Object Type |
0 |
Subobject Type |
6 |
Default Peak Interval |
300 seconds |
The FastPAD Frame Relay connection statistics are primarily used for gathering billing and performance data.
The following table includes the description of each statistic and the point during the data flow at which the statistic gathers the appropriate information. Each measurement point refers to the corresponding point in Figure 4-1.
|
Stat ID
|
FastPAD Frame Relay Connection Statistics
|
Subset of Other Stats
|
Ingress/Egress Measurement Point
|
Description
|
0 |
Frames Received |
No |
— |
Provides a count of the frames that are received by the local FastPAD port. Range: 0 to (232-1) |
1 |
Receive Frames Discarded |
Frames Received |
— |
Provides a count of the frames that are discarded by the local FastPAD before the queue is transmitted onto the bus. Range: 0 to (232-1) |
2 |
Frames Transmitted |
No |
— |
Provides a count of the frames that are transmitted out of the local FastPAD port. Range: 0 to (232-1) |
3 |
Transmit Frames Discarded |
Frames Transmitted |
— |
Provides a count of the frames that are discarded by the local FastPAD before the queue is transmitted out the port. Range: 0 to (232-1) |
4 |
Packets Received |
No |
— |
Provides a count of the packets that are received from the bus by the local port card. Range: 0 to (232-1) |
5 |
Receive Packets Discarded |
Packets Received |
— |
Provides a count of the packets that are received from the bus by the local port card and discarded. These packets are discarded before the queue is transmitted out of the port. Range: 0 to (232-1) |
6 |
Packets Transmitted |
No |
— |
Provides a count of the packets that are transmitted onto the bus from the local port card. Range: 0 to (232-1) |
9 |
Bytes Received |
No |
— |
Provides a count of the frame bytes that are received by the local FastPAD port. Range: 0 to (232-1) |
10 |
Receive Bytes Discarded |
Bytes Received |
— |
Provides a count of the frame bytes that are received and then discarded by the local FastPAD port. Range: 0 to (232-1) |
11 |
Bytes Transmitted |
No |
— |
Provides a count of the frame bytes that are received from the bus and then transmitted out the FastPAD port. Range: 0 to (232-1) |
12 |
Transmit Bytes Discarded |
Bytes Transmitted |
— |
Provides a count of the frame bytes that are received from the bus then discarded before transmitting out of the FastPAD port. Bytes can be discarded for the following reasons: •Age of the frame •Cyclic redundancy check (CRC) errors •Lack of buffer space Range: 0 to (232-1) |
16 |
Seconds in Service |
No |
— |
Provides a count of the seconds in service (not in alarm) that the required cards are present, and the connection is routed. Range: 0 to (232-1) |
17 |
Frames Transmitted with FECN |
Frames Transmitted |
— |
Provides a count of the frames that are transmitted with the forward explicit congestion notification (FECN) bit set. Range: 0 to (232-1) |
18 |
Frames Transmitted with BECN |
Frames Transmitted |
— |
Provides a count of the frames that are transmitted with the backward explicit congestion notification (BECN) bit set. Range: 0 to (232-1) |
20 |
Minutes Congested |
No |
— |
Provides a count of the minutes when at least 50% of the frames are tagged FECN by FastPAD. Range: 0 to (232-1) |
21 |
DE Frames Received |
Frames Received |
— |
Provides a count of the frames that are received with the discard eligible (DE) bit set by the local FastPAD port. Range: 0 to (232-1) |
22 |
DE Frames Transmitted |
Frames Transmitted |
— |
Provides a count of the frames that are transmitted with the DE bit set by the local FastPAD port. Range: 0 to (232-1) |
23 |
DE Frames Dropped |
No |
— |
Provides a count of the frames that are received with the DE bit set then dropped before being transmitted onto the bus. Range: 0 to (232-1) |
24 |
DE Bytes Received |
Bytes Received |
— |
Provides a count of the bytes that are received with the DE bit set. Range: 0 to (232-1) |
25 |
Frames Rx in Excess of CIR |
Frames Received |
— |
Provides a count of the frames that are received in excess of the committed information rate (CIR). Range: 0 to (232-1) |
26 |
Bytes Rx in Excess of CIR |
Bytes Received |
— |
Provides a count of the bytes that are received in excess of CIR. Range: 0 to (232-1) |
27 |
Frames Tx in Excess of CIR |
Frames Transmitted |
— |
Provides a count of the frames that are transmitted in excess of CIR. Range: 0 to (232-1) |
28 |
Bytes Tx in Excess of CIR |
Bytes Transmitted |
— |
Provides a count of the bytes that are transmitted in excess of CIR. Range: 0 to (232-1) |
31 |
Rx Frames Discarded-Deroute/
Down |
Frames Received |
— |
Provides a count of the frames that are discarded due to administratively downed connections. Range: 0 to (232-1) |
32 |
Rx Bytes Discarded-Deroute/
Down |
Bytes Received |
— |
Provides a count of the bytes that are discarded due to administratively downed connections. Range: 0 to (232-1) |
33 |
Rx Frames Discarded- VC-Q-Overflow |
Frames Received |
— |
Provides a count of the frames that are discarded due to virtual circuit (VC) queue overflow. Range: 0 to (232-1) |
34 |
Rx Bytes Discarded- VC-Q-Overflow |
Bytes Received |
— |
Provides a count of the bytes that are discarded due to VC queue overflow. Range: 0 to (232-1) |
35 |
Tx Frames Discarded-Q-
Overflow |
Frames Transmitted |
— |
Provides a count of the frames that are discarded due to transmit queue overflow. Range: 0 to (232-1) |
36 |
Tx Bytes Discarded- Q-Overflow |
Bytes Transmitted |
— |
Provides a count of the bytes that are discarded due to transmit queue overflow. Range: 0 to (232-1) |
37 |
Tx Frames Discarded- Ingress CRC |
Frames Transmitted |
— |
Provides a count of the frames that are discarded due to ingress CRC or length errors. Range: 0 to (232-1) |
38 |
Tx Bytes Discarded Ingress CRC |
Bytes Transmitted |
— |
Provides a count of the bytes that are discarded due to ingress CRC or length errors. Range: 0 to (232-1) |
39 |
Tx Frames Discarded- Trunk Discard |
Frames Transmitted |
— |
Provides a count of the frames that are discarded due to trunk CRC or length errors. Range: 0 to (232-1) |
40 |
Tx Bytes Discarded- Trunk Discard |
Bytes Transmitted |
— |
Provides a count of the bytes that are discarded due to trunk CRC or length errors. Range: 0 to (232-1) |
41 |
Tx Frames during Ingress LMI Fail |
Frames Transmitted |
— |
Provides a count of the frames that are transmitted during an LMI failure in the ingress direction. Range: 0 to (232-1) |
42 |
Tx Bytes during Ingress LMI Fail |
Bytes Transmitted |
— |
Provides a count of the bytes that are transmitted during an LMI failure in the ingress direction. Range: 0 to (232-1) |
UXM and URM Connection
This section provides information about the UXM and URM statistics contained in the ASI Connection group. These connection statistics are applicable for Switch Software Releases 9.2 and 9.3 on the IGX switch.
Note The UXM connection statistics in this section are also applicable to the UXM-E card.
The following table lists the attributes that are common to the UXM and URM connection statistics.
Front Cards |
UXM, URM |
Back Cards |
UXM - BC-UAI-6-T3/E3, BC-UAI-3-T3/E3, BC-UAI-2/4-155-SMF, BC-UAI-2/4-SMFXLR, BC-UAI-4-STM1E, BC-UAI-4-155-MMF URM - BC-URI-2FE2V-T1/E1 |
Object Type |
0 |
Subobject Type |
7 |
Default Peak Interval |
300 seconds |
The UXM and URM connection statistics are primarily used for gathering billing and performance data. However, the multilevel statistics listed in this section are typically used for troubleshooting.
The following table includes the description of each statistic and the point during the data flow at which the statistic gathers the appropriate information. Each measurement point refers to the corresponding point in Figure 4-1.
|
Stat ID
|
UXM and URM Connection Statistics
|
Subset of Other Stats
|
Ingress/Egress Measurement Point
|
Description
|
29 |
Cells RX Port |
No |
Ingress-1 |
Provides a count of the total cells that are received from the port prior to policing and VC queuing. The count includes the sum of cell loss priority (CLP) cells (0+1). This statistic does not include •Cells discarded due to checksum error •Cells discarded due to invalid virtual path identifier (VPI)/virtual channel identifier (VCI) •Operation, administration, and maintenance (OAM) cells This statistic is classified as level 1 in the multilevel statistics. The corresponding name is Rx Cells from port. Range: 0 to (232-1) cells |
31 |
Cells TX Network |
Cells RX Port |
Ingress-4 |
Provides a count of the cells that are transmitted to the bus and sent to the switch fabric after policing and VC queuing. This statistic does not include the cells that are discarded due to traffic or congestion control. This statistic is classified as level 1 in the multilevel statistics. The corresponding name is RX cells to NW. Range: 0 to (232-1) cells |
32 |
CLP RX Port |
Cells RX Port |
Ingress-2, 3 |
Provides a count of the total connection cells with cell loss priority (CLP) equal to 0 and 1 that are received from the port prior to policing and VC queuing. This statistic does not include cells that are discarded due to a checksum error. This statistic is classified as level 1 in the multilevel statistics. The corresponding name is RX cells to NW. Range: 0 to (232-1) cells |
38 |
Non-comp RX Port |
Cells RX Port |
Ingress-2 |
Provides a count of the total cells with CLP (0+1) that are non-compliant or discarded due to policing. This statistic is classified as level 1 in the multilevel statistics. The corresponding name is RX cells Non-cmplt. Range: 0 to (232-1) cells |
41 |
Average Cell Rx Q Depth |
No |
Ingress-2 |
Provides the average number of cells that comprises the receive VC queue cell depth. This statistic is classified as level 1 in the multilevel statistics. The corresponding name is Ingress VC Q depth. Range: 0 to (232-1) cells |
44 |
EFCI TX Port |
Cells TX Port |
Egress-13 |
Provides a count of the cells with an explicit forward congestion indication (EFCI) bit equal to 1 that are transmitted to the port. This statistic is collected after the cells are received from the bus and have passed egress queuing and servicing. This statistic is classified as level 2 in the multilevel statistics. The corresponding name is TX EFCI 1 to Port. Range: 0 to (232-1) cells |
45 |
Cells TX Port |
No |
Egress-12, 13 |
Provides a count of the cells transmitted to the port after VC queuing. This statistic is classified as level 1 in the multilevel statistics. The corresponding name is TX Cells to Port. Range: 0 to (232-1) cells |
46 |
Cells RX Network |
No |
Egress-11 |
Provides a count of the number of cells received from the bus. This statistic is classified as level 1 in the multilevel statistics. The corresponding name is TX cells from NW. Range: 0 to (232-1) cells |
58 |
Number of good PDUs Rx by SAR |
No |
After SAR processing-3 |
Provides a count of the valid protocol data units (PDUs) received by the segmentation and reassembly (SAR) sublayer. The BXM uses AAL5. Range: 0 to (232-1) cells |
59 |
Number of good PDUs Tx by SAR |
No |
After SAR processing-12 |
Provides a count of the valid PDUs transmitted by the SAR sublayer. The BXM uses AAL5. Range: 0 to (232-1) cells |
60 |
Rx PDUs discarded on ingress by SAR |
No |
After SAR processing-3 |
Provides a count of the invalid PDUs that are discarded by the SAR sublayer, in the receive direction. Cells are discarded due to bit errors, lost cells, or cells that are out of sequence. Range: 0 to (232-1) cells |
61 |
Tx PDUs discarded on egress by SAR |
No |
After SAR processing-12 |
Provides a count of the invalid PDUs that are discarded by the SAR sublayer, in the transmit direction. Cells are discarded due to bit errors, lost cells, or cells that are out of sequence. Range: 0 to (232-1) cells |
62 |
Invalid crc32 PDU Rx by SAR |
Rx PDUs discarded on ingress by SAR |
After SAR processing-3 |
Provides a count of the PDUs with an invalid cyclic redundancy check (CRC) that are received by the SAR sublayer. The trailer of the frame includes a 32-bit CRC that calculates across the PDU. Range: 0 to (232-1) cells |
63 |
Invalid-length PDU Rx by SAR |
Rx PDUs discarded on ingress by SAR |
After SAR processing-3 |
Provides a count of the PDUs with an invalid length that are received by the SAR sublayer. The trailer of the frame includes the length field that calculates the entire PDU. Range: 0 to (232-1) cells |
64 |
Short-length failures detected by SAR |
Invalid-length PDU Rx by SAR |
After SAR processing-3 |
Provides a count of the PDUs with missing data (missing cells) that are received by the SAR sublayer. The trailer of the frame includes the length field that calculates the entire PDU. Range: 0 to (232-1) cells |
65 |
Long-length failures detected by SAR |
Invalid-length PDU Rx by SAR |
After SAR processing-3 |
Provides a count of the PDUs with extra cells that are received by the SAR sublayer. Cells can be added when the end of frame (EOF) cell is lost. The trailer of the frame includes the length field that calculates the entire PDU. Range: 0 to (232-1) cells |
69 |
Cells Rx with CLP=0 |
Total Cells Rx Port |
Ingress-2 |
Provides a count of the total cells with CLP equal to 0 that are received from the port. This statistic is classified as level 1 in the multilevel statistics. The corresponding name is RX CLP0 from Port. Range: 0 to (232-1) cells |
70 |
Cells Rx with CLP=0 from network |
Cells RX Network |
Egress-11 |
Provides a count of the total cells with CLP equal to 0 that are received from the bus. This statistic is classified as level 1 in the multilevel statistics. The corresponding name is TX CLP0 from NW. Range: 0 to (232-1) cells |
71 |
Cells Rx with CLP=1 from network |
Cells RX Network |
Egress-11 |
Provides a count of the total cells with CLP equal to 1 that are received from the bus. This statistic is classified as level 1 in the multilevel statistics. The corresponding name is TX CLP1 from NW. Range: 0 to (232-1) cells |
72 |
Ingress VSVD Allowed Cell Rate |
No |
Ingress-1 |
Provides the value of the allowed cell rate (ACR) used in the resource management (RM) cell. On the ingress, this value is the ACR between the source edge switch of the WAN and the virtual source (VS). This statistic is classified as level 1 in the multilevel statistics. The corresponding name is Ingress VSVD ACR. Range: 0 to Max valid ACR cells |
73 |
Egress VSVD Allowed Cell Rate |
No |
Egress-13 |
Provides the value of the ACR used in the RM cell. On the egress, this value is the ACR between the destination edge switch of the WAN and the virtual destination (VD). This statistic is classified as level 1 in the multilevel statistics. The corresponding name is Egress VSVD ACR. Range: 0 to Max valid ACR cells |
74 |
Backward Severely Errored Cell Blocks |
— |
— |
Provides a count of the backward severely errored cells that are blocked. Range: 0 to (232-1) cells |
75 |
Backward Lost Cell Count |
— |
— |
Provides a count of the backward cells that are lost. Range: 0 to (232-1) cells |
76 |
Backward Misinserted Cell Count |
— |
— |
Provides a count of the backward cells that are misinserted. Range: 0 to (232-1) cells |
77 |
Backward Bipolar Violation Count |
— |
— |
Provides a count of the backward bipolar violations. Range: 0 to (232-1) cells |
78 |
Forward Severely Errored Cell Blocks |
— |
— |
Provides a count of the forward severely errored cells that are blocked. Range: 0 to (232-1) cells |
79 |
Forward Lost Cell Count |
— |
— |
Provides a count of the forward cells that are lost. Range: 0 to (232-1) cells |
80 |
Forward Misinserted Cell Count |
— |
— |
Provides a count of the forward cells that are misinserted. Range: 0 to (232-1) cells |
81 |
Forward Bipolar Violation Count |
— |
— |
Provides a count of the forward bipolar violations. Range: 0 to (232-1) cells |
82 |
Cells Tx with EFCI=0 |
— |
— |
Provides a count of the cells that are transmitted with the EFCI bit set at 0. Range: 0 to (232-1) cells |
83 |
Average Cell Tx Q Depth |
— |
— |
Provides the average number of cells that are transmitted from the queue. Range: 0 to (232-1) cells |
84 |
Unkn Prot Frames Discarded at Ingress |
— |
— |
Provides a count of the unknown protocol frames that are discarded in the ingress direction. Range: 0 to (232-1) cells |
85 |
Unkn Prot Frames Discarded at Egress |
— |
— |
Provides a count of the unknown protocol frames that are discarded in the egress direction. Range: 0 to (232-1) cells |
86 |
EOF Cells RX from Port |
Cells RX Port |
Ingress-2 |
Provides a count of the end of frame (EOF) cells that are received from the port. Range: 0 to (232-1) cells |
89 |
No of cells rx non-comp w/clp=0 drpd |
Cells Rx with CLP=0 |
Ingress-2 |
Provides a count of the non-compliant cells with CLP equal to 0 that are dropped after being received. This statistic is classified as level 1 in the multilevel statistics. The corresponding name is RX CLP0 Non-cmplt. Range: 0 to (232-1) cells |
90 |
No of cells rx non-comp w/clp=1 drpd |
CLP RX Port |
Ingress-2 |
Provides a count of the non-compliant cells with CLP equal to 1 that are dropped after being received. This statistic is classified as level 1 in the multilevel statistics. The corresponding name is RX CLP1 Non-cmpl. Range: 0 to (232-1) cells |
91 |
No of cells rx congested w/clp=0 drpd |
Cells Rx with CLP=0 |
Ingress-2 |
Provides a count of the received cells with CLP equal to 0 that are dropped from a congested line. This statistic is classified as level 1 in the multilevel statistics. The corresponding name is RX CLP0 Cong Dscd. Range: 0 to (232-1) cells |
92 |
No of cells rx congested w/clp=1 drpd |
CLP RX Port |
Ingress-2 |
Provides a count of the received cells with CLP equal to 1 that are dropped from a congested line. This statistic is classified as level 1 in the multilevel statistics. The corresponding name is RX CLP1 Cong Dscd. Range: 0 to (232-1) cells |
93 |
No of cells tx with clp=1 to nw |
Cells TX Network |
Ingress-4 |
Provides a count of the total cells with CLP equal to 1 that are transmitted to the bus. This statistic is classified as level 2 in the multilevel statistics. The corresponding name is RX CLP1 to NW. Range: 0 to (232-1) cells |
94 |
No of cells tx w/efci=0 to nw |
Cells TX Network |
Ingress-4 |
Provides a count of the cells with an EFCI bit equal to 0 that are transmitted to the bus. This statistic is classified as level 2 in the multilevel statistics. The corresponding name is RX EFCI 0 to NW. Range: 0 to (232-1) cells |
95 |
No of cells tx w/efci=1 to nw |
Cells TX Network |
Ingress-4 |
Provides a count of the cells with an EFCI bit equal to 1 that are transmitted to the bus. This statistic is classified as level 2 in the multilevel statistics. The corresponding name is RX EFCI 1 to NW. Range: 0 to (232-1) cells |
97 |
No of cells rx congested w/EOF dscd |
Total Cells RX Port |
Ingress-3 |
Provides a count of the ingress EOF cells with an EFCI bit equal to 0 that are discarded from a congested line. This statistic is classified as level 2 in the multilevel statistics. The corresponding name is RX EOF CNG DSC. Range: 0 to (232-1) cells |
98 |
No of cells tx w/eof=1 to port |
Cells Tx Port |
Egress-13 |
Provides a count of the cells with EOF equal to 1 that are transmitted to the port. This statistic is classified as level 2 in the multilevel statistics. The corresponding name is TX EOFs to Port. Range: 0 to (232-1) cells |
99 |
No of RM cells tx to port |
Cells Tx Port |
Egress-13 |
Provides a count of RM cells that are transmitted to the port. This statistic is classified as level 3 in the multilevel statistics. The corresponding name is RM Cells to Port. Range: 0 to (232-1) cells |
100 |
No of cells rx w/efci=0 from port |
Total Cells Rx Port |
Ingress-2 |
Provides a count of the cells with an EFCI bit equal to 0 that are received from the port. This statistic is classified as level 3 in the multilevel statistics. The corresponding name is RX EFCI 0 from Port. Range: 0 to (232-1) cells |
101 |
Cells rx w/EFCI from port |
Total Cells Rx Port |
Ingress-2 |
Provides a count of the cells with an EFCI bit equal to 1 that are received from the port. This statistic is classified as level 3 in the multilevel statistics. The corresponding name is RX EFCI 1 from Port. Range: 0 to (232-1) cells |
102 |
No of OAM cells rx from port |
Total Cells Rx Port |
Ingress-1 |
Provides a count of OAM cells that are received from the port. This statistic is classified as level 3 in the multilevel statistics. The corresponding name is OAM from Port. Range: 0 to (232-1) cells |
103 |
No of cells rx w/RM from port |
Total Cells Rx Port |
Ingress-1 |
Provides a count of RM cells that are received from the port. This statistic is classified as level 3 in the multilevel statistics. The corresponding name is RM Cells from Port. Range: 0 to (232-1) cells |
104 |
Cells rx congested w/EFCI0 dscd |
No of cells rx w/efci=0 from port |
Ingress-2 |
Provides a count of the cells with an EFCI bit equal to 0 that are discarded from a congested line. This statistic is classified as level 3 in the multilevel statistics. The corresponding name is Rx EFCI 0 Cng Dsc. Range: 0 to (232-1) cells |
105 |
Cells rx congested w/EFCI1 dscd |
Cells rx w/EFCI from port |
Ingress-2 |
Provides a count of the cells with an EFCI bit equal to 1 that are discarded from a congested line. This statistic is classified as level 3 in the multilevel statistics. The corresponding name is Rx EFCI 1 Cng Dsc. Range: 0 to (232-1) cells |
106 |
Cells rx congested w/OAM dscd |
No of OAM cells rx from port |
Ingress-1 |
Provides a count of the total OAM cells that are received and then discarded because of congestion. This statistic is classified as level 3 in the multilevel statistics. The corresponding name is Rx OAM Cng Dsc. Range: 0 to (232-1) cells |
107 |
Cells rx congested w/RM dscd |
No of cells rx w/RM from port |
Ingress-1 |
Provides a count of the total RM cells that are received and then discarded because of congestion. This statistic is classified as level 3 in the multilevel statistics. The corresponding name is Rx RM Cng Dsc. Range: 0 to (232-1) cells |
108 |
No of cells tx w/FRm to nw |
No of cells tx w/BRm+FsRm to nw |
Ingress-4 |
Provides a count of the total forward RM cells that are transmitted to the bus. This statistic is classified as level 3 in the multilevel statistics. The corresponding name is Rx FRM to NW. Range: 0 to (232-1) cells |
109 |
No of cells tx w/BRm+FsRm to nw |
No |
Ingress-4 |
Provides a count of the total backward forward RM cells transmitted to the bus. This statistic is classified as level 3 in the multilevel statistics. The corresponding name is Rx BRM/Fst to NW. Range: 0 to (232-1) cells |
110 |
No of cells rx w/efci=0 from nw |
No |
Egress-12 |
Provides a count of the cells with an EFCI bit equal to 0 that are received from the bus. This statistic is classified as level 3 in the multilevel statistics. The corresponding name is TX EFCI 0 from NW. Range: 0 to (232-1) cells |
111 |
No of cells rx w/efci=1 from nw |
Cells RX Network |
Egress-12 |
Provides a count of the cells with an EFCI bit equal to 1 that are received from the bus. This statistic is classified as level 3 in the multilevel statistics. The corresponding name is RX EFCI 1 from NW. Range: 0 to (232-1) cells |
112 |
No of egress OAM cells rx |
Cells RX Network |
Egress-12 |
Provides a count of the OAM cells that are received from the bus. This statistic is classified as level 3 in the multilevel statistics. The corresponding name is OAM From NW. Range: 0 to (232-1) cells |
113 |
No of egress cells rx w/RM |
Cells RX Network |
Egress-12 |
Provides a count of the RM cells that are received from the bus. This statistic is classified as level 3 in the multilevel statistics. The corresponding name is RM From NW. Range: 0 to (232-1) cells |
114 |
Cells tx congested w/EFCI0 dscd |
No |
Egress-13 |
Provides a count of the discarded cells that have an EFCI bit equal to 0. This statistic is collected after the cells are received from the bus and have passed egress queuing and servicing. This statistic is classified as level 3 in the multilevel statistics. The corresponding name is Tx EFCI 0 Cng Dsc. Range: 0 to (232-1) cells |
115 |
Cells tx congested w/EFCI1 dscd |
No |
Egress-13 |
Provides a count of the discarded cells that have an EFCI bit equal to 1. This statistic is collected after the cells are received from the bus and have passed egress queuing and servicing. This statistic is classified as level 3 in the multilevel statistics. The corresponding name is Tx EFCI 1 Cng Dsc. Range: 0 to (232-1) cells |
116 |
Cells tx congested w/RM dscd |
No |
Egress-13 |
Provides a count of the RM cells that are discarded due to congestion. This statistic is collected after the cells are received from the bus and have passed egress queuing and servicing. This statistic is classified as level 3 in the multilevel statistics. The corresponding name is Tx RM Cng Dsc. Range: 0 to (232-1) cells |
117 |
Cells tx congested w/OAM dscd |
No |
Egress-13 |
Provides a count of the OAM cells that are discarded due to congestion. This statistic is collected after the cells are received from the bus and have passed egress queuing and servicing. This statistic is classified as level 3 in the multilevel statistics. The corresponding name is Tx OAM Cng Dsc. Range: 0 to (232-1) cells |
118 |
No of cells tx w/clp=0 |
CLP TX Port |
Egress-13 |
Provides a count of the cells with CLP equal to 0 that are transmitted to the port. This statistic is classified as level 1 in the multilevel statistics. The corresponding name is TX CLP0 Cells to Port. Note This statistic is only available in Switch Software Releases 9.3 and above. For other releases this value equals 0. Range: 0 to (232-1) cells |
119 |
No of cells tx w/clp=1 |
CLP TX Port |
Egress-13 |
Provides a count of the cells with CLP equal to 1 that are transmitted to the port. Note This statistic is only available in Switch Software Releases 9.3 and above. For other releases this value equals 0. Range: 0 to (232-1) cells |
120 |
Cells tx w/clp=0 to nw |
Cells TX Network |
Ingress-4 |
Provides a count of the cells with CLP equal to 0 that are transmitted to the bus. This statistic is classified as level 2 in the multilevel statistics. The corresponding name is RX CLP0 to NW. Note This statistic is only available in Switch Software Releases 9.3 and above. For other releases this value equals 0. Range: 0 to (232-1) cells |
BXM and ASI Connection
This section provides information about the BXM and ASI statistics contained in the ASI Connection group. These connection statistics are applicable to Switch Software Releases 9.2 and 9.3 on the BPX switch.
Note The BXM connection statistics are also applicable to the SES.
The following table lists the attributes that are common to the BXM and ASI connection statistics.
Front Cards |
BXM- T3/E3, BXM-155, BXM-622 ASI-T3/E3, ASI-155, ASI-155e |
Back Cards |
BXM - BPX-T3/E3-BC, MMF-155-4/8, SMF-155-4/8 SMFLR-155-4/8, SMF-622-2, SMFLR-622-2, SMFXLR-622-2, SMF-622, SMFLR-622, SMFXLR-622 ASI - LM-3T3/3E3, LM-2OC-3-SMF, LM-2OC-3-SMFLR, LM-2OC-3-MMF |
Object Type |
0 |
Subobject Type |
7 |
Default Peak Interval |
300 seconds |
The BXM and ASI connection statistics are primarily used for gathering billing and performance data. However, the multilevel statistics listed in this section are typically used for troubleshooting.
The following table includes the description of each statistic and the point during the data flow at which the statistic gathers the appropriate information. Each measurement point refers to the corresponding point in Figure 4-1.
|
Stat ID
|
BXM and ASI Connection Statistics
|
Subset of Other Stats
|
Ingress/Egress Measurement Point
|
Description
|
29 |
Cells RX Port |
No |
Ingress-1 |
Provides a count of the total cells that are received from the port prior to policing and VC queuing. The count includes the sum of cell loss priority (CLP) cells (0+1). This statistic does not include •Cells discarded due to checksum error •Cells discarded due to invalid virtual path identifier (VPI)/virtual channel identifier (VCI) •Operation, administration, and maintenance (OAM) cells This statistic is classified as level 1 in the multilevel statistics. The corresponding name is Rx Cells from port. Range: 0 to (232-1) cells |
30 |
Frames RX Port |
No |
Ingress-1 |
Provides a count of the total AAL5 frames that are received from the port. The count includes frames that are valid, invalid, or subsequently discarded. This statistic applies to ATM data connections. Traffic flow over the connection is adapted to ATM at the AAL5 layer. This statistic is classified as level 1 in the multilevel statistics. The corresponding name is RX EOFs from port. Range: 0 to (232-1) frames |
31 |
Cells TX Network |
Cells RX Port |
Ingress-4 |
Provides a count of the cells that are transmitted to the bus and sent to the switch fabric after policing and VC queuing. This statistic does not include the cells that are discarded due to traffic or congestion control. This statistic is classified as level 1 in the multilevel statistics. The corresponding name is RX cells to NW. Range: 0 to (232-1) cells |
32 |
CLP RX Port |
Cells RX Port |
Ingress-2, 3 |
Provides a count of the total connection cells with cell loss priority (CLP) equal to 0 and 1 that are received from the port prior to policing and VC queuing. This statistic does not include cells that are discarded due to a checksum error. This statistic is classified as level 1 in the multilevel statistics. The corresponding name is RX cells to NW. Range: 0 to (232-1) cells |
33 |
Non-comp CLP RX Port |
Cells RX Port |
— |
Provides a count of the non-compliant CLP cells that are received at the port. Range: 0 to (232-1) cells |
34 |
Discard CLPth RX Port |
Cells RX Port |
— |
Provides a count of the CLP cells that are received at the port and then discarded. Range: 0 to (232-1) cells |
35 |
Discard Qfull RX Port |
Cells RX Port |
— |
Provides a count of the cells that are discarded due to transmit queue overflow. Range: 0 to (232-1) cells |
36 |
EFCI RX Port |
Cells RX Port |
— |
Provides a count of the cells that are received at the port with the explicit forward congestion indication (EFCI) bit set. Range: 0 to (232-1) cells |
37 |
AAL5 RX Port |
Cells RX Port |
— |
Provides a count of the AAL5 cells that are received at the port. Range: 0 to (232-1) cells |
38 |
Non-comp RX Port |
Cells RX Port |
Ingress-2 |
Provides a count of the total cells with CLP (0+1) that are non-compliant or discarded due to policing. This statistic is classified as level 1 in the multilevel statistics. The corresponding name is RX cells Non-cmplt. Range: 0 to (232-1) cells |
39 |
Discarded Failed RX Port |
Cells RX Port |
— |
Provides a count of the failed cells that are received at the port and then discarded. Range: 0 to (232-1) cells |
40 |
AAL5 Discarded Qfull RX Port |
Cells RX Port |
— |
Provides a count of the AAL5 cells that are discarded due to transmit queue overflow. Range: 0 to (232-1) cells |
41 |
Average Cell Rx Q Depth |
No |
Ingress-2 |
Provides the average number of cells that comprises the receive VC queue cell depth. This statistic is classified as level 1 in the multilevel statistics. The corresponding name is Ingress VC Q depth. Range: 0 to (232-1) cells |
42 |
Discarded Rsrc Overflow RX Port |
Cells RX Port |
— |
Provides a count of the cells that are discarded due to resource overflow. Range: 0 to (232-1) cells |
43 |
Discarded Sbin Full RX Port |
Cells RX Port |
— |
Provides a count of the cells that are discarded due to the Sbin being full. Range: 0 to (232-1) cells |
44 |
EFCI TX Port |
Cells TX Port |
Egress-13 |
Provides a count of the cells with an explicit forward congestion indication (EFCI) bit equal to 1 that are transmitted to the port. This statistic is collected after the cells are received from the bus and have passed egress queuing and servicing. This statistic is classified as level 2 in the multilevel statistics. The corresponding name is TX EFCI 1 to Port. Range: 0 to (232-1) cells |
45 |
Cells TX Port |
No |
Egress-12, 13 |
Provides a count of the cells transmitted to the port after VC queuing. This statistic is classified as level 1 in the multilevel statistics. The corresponding name is TX Cells to Port. Range: 0 to (232-1) cells |
46 |
Cells RX Network |
No |
Egress-11 |
Provides a count of the number of cells received from the bus. This statistic is classified as level 1 in the multilevel statistics. The corresponding name is TX cells from NW. Range: 0 to (232-1) cells |
47 |
Discarded Qbin Full |
— |
— |
Provides a count of the cells that are discarded because the queue bin is full. Range: 0 to (232-1) cells |
48 |
Discarded Qbin CLPth Port |
— |
— |
Provides a count of the CLP cells that are discarded because the queue bin is full. Range: 0 to (232-1) cells |
49 |
CLP TX Port |
Cells TX Port |
Egress-13 |
Provides a count of the connection cells with CLP equal to 1 that are transmitted to the port. This statistic is classified as level 1 in the multilevel statistics. The corresponding name is TX CLP1 to Port. Range: 0 to (232-1) cells |
50 |
BCM RX Port |
Cells RX Port |
— |
Provides a count of the BCM cells that are received at the port. Range: 0 to (232-1) cells |
51 |
BCM TX Network |
Cells TX Network |
— |
Provides a count of the BCM cells that are transmitted to the network. Range: 0 to (232-1) cells |
52 |
OAM TX Network |
Cells TX Network |
— |
Provides a count of the operation, administration, and maintenance (OAM) cells that are transmitted to the network. Range: 0 to (232-1) cells |
53 |
AIS RX Port |
Cells RX Port |
— |
Provides a counts of the alarm indication signal (AIS) cells that are received at the port. Range: 0 to (232-1) cells |
54 |
FERF RX Port |
Cells RX Port |
— |
Provides a count of the far end receive failure (FERF) cells received at the port. Range: 0 to (232-1) cells |
57 |
Current egress VC Queue Depth |
No |
Egress-12 |
Provides the average number of cells that comprises the transmit VC queue cell depth. This statistic is classified as level 1 in the multilevel statistics. The corresponding name is Egress VC Q Depth. Range: 0 to (232-1) cells |
58 |
Number of good PDUs Rx by SAR |
No |
After SAR processing-3 |
Provides a count of the valid protocol data units (PDUs) received by the segmentation and reassembly (SAR) sublayer. The BXM uses AAL5. Range: 0 to (232-1) cells |
59 |
Number of good PDUs Tx by SAR |
No |
After SAR processing-12 |
Provides a count of the valid PDUs transmitted by the SAR sublayer. The BXM uses AAL5. Range: 0 to (232-1) cells |
60 |
Rx PDUs discarded on ingress by SAR |
No |
After SAR processing-3 |
Provides a count of the invalid PDUs that are discarded by the SAR sublayer, in the receive direction. Cells are discarded due to bit errors, lost cells, or cells that are out of sequence. Range: 0 to (232-1) cells |
61 |
Tx PDUs discarded on egress by SAR |
No |
After SAR processing-12 |
Provides a count of the invalid PDUs that are discarded by the SAR sublayer, in the transmit direction. Cells are discarded due to bit errors, lost cells, or cells that are out of sequence. Range: 0 to (232-1) cells |
62 |
Invalid crc32 PDU Rx by SAR |
Rx PDUs discarded on ingress by SAR |
After SAR processing-3 |
Provides a count of the PDUs with an invalid cyclic redundancy check (CRC) that are received by the SAR sublayer. The trailer of the frame includes a 32-bit CRC that calculates across the PDU. Range: 0 to (232-1) cells |
63 |
Invalid-length PDU Rx by SAR |
Rx PDUs discarded on ingress by SAR |
After SAR processing-3 |
Provides a count of the PDUs with an invalid length that are received by the SAR sublayer. The trailer of the frame includes the length field that calculates the entire PDU. Range: 0 to (232-1) cells |
64 |
Short-length failures detected by SAR |
Invalid-length PDU Rx by SAR |
After SAR processing-3 |
Provides a count of the PDUs with missing data (missing cells) that are received by the SAR sublayer. The trailer of the frame includes the length field that calculates the entire PDU. Range: 0 to (232-1) cells |
65 |
Long-length failures detected by SAR |
Invalid-length PDU Rx by SAR |
After SAR processing-3 |
Provides a count of the PDUs with extra cells that are received by the SAR sublayer. Cells can be added when the end of frame (EOF) cell is lost. The trailer of the frame includes the length field that calculates the entire PDU. Range: 0 to (232-1) cells |
69 |
Cells Rx with CLP=0 |
Total Cells Rx Port |
Ingress-2 |
Provides a count of the total cells with CLP equal to 0 that are received from the port. This statistic is classified as level 1 in the multilevel statistics. The corresponding name is RX CLP0 from Port. Range: 0 to (232-1) cells |
70 |
Cells Rx with CLP=0 from network |
Cells RX Network |
Egress-11 |
Provides a count of the total cells with CLP equal to 0 that are received from the bus. This statistic is classified as level 1 in the multilevel statistics. The corresponding name is TX CLP0 from NW. Range: 0 to (232-1) cells |
71 |
Cells Rx with CLP=1 from network |
Cells RX Network |
Egress-11 |
Provides a count of the total cells with CLP equal to 1 that are received from the bus. This statistic is classified as level 1 in the multilevel statistics. The corresponding name is TX CLP1 from NW. Range: 0 to (232-1) cells |
72 |
Ingress VSVD Allowed Cell Rate |
No |
Ingress-1 |
Provides the value of the allowed cell rate (ACR) used in the resource management (RM) cell. On the ingress, this value is the ACR between the source edge switch of the WAN and the virtual source (VS). This statistic is classified as level 1 in the multilevel statistics. The corresponding name is Ingress VSVD ACR. Range: 0 to Max valid ACR cells |
73 |
Egress VSVD Allowed Cell Rate |
No |
Egress-13 |
Provides the value of the ACR used in the RM cell. On the egress, this value is the ACR between the destination edge switch of the WAN and the virtual destination (VD). This statistic is classified as level 1 in the multilevel statistics. The corresponding name is Egress VSVD ACR. Range: 0 to Max valid ACR cells |
74 |
Backward Severely Errored Cell Blocks |
— |
— |
Provides a count of the backward severely errored cells that are blocked. Range: 0 to (232-1) cells |
75 |
Backward Lost Cell Count |
— |
— |
Provides a count of the backward cells that are lost. Range: 0 to (232-1) cells |
76 |
Backward Misinserted Cell Count |
— |
— |
Provides a count of the backward cells that are misinserted. Range: 0 to (232-1) cells |
77 |
Backward Bipolar Violation Count |
— |
— |
Provides a count of the backward bipolar violations. Range: 0 to (232-1) cells |
78 |
Forward Severely Errored Cell Blocks |
— |
— |
Provides a count of the forward severely errored cells that are blocked. Range: 0 to (232-1) cells |
79 |
Forward Lost Cell Count |
— |
— |
Provides a count of the forward cells that are lost. Range: 0 to (232-1) cells |
80 |
Forward Misinserted Cell Count |
— |
— |
Provides a count of the forward cells that are misinserted. Range: 0 to (232-1) cells |
81 |
Forward Bipolar Violation Count |
— |
— |
Provides a count of the forward bipolar violations. Range: 0 to (232-1) cells |
83 |
Average Cell Tx Q Depth |
— |
— |
Provides the average number of cells that are transmitted from the queue. Range: 0 to (232-1) cells |
89 |
No of cells rx non-comp w/clp=0 drpd |
Cells Rx with CLP=0 |
Ingress-2 |
Provides a count of the non-compliant cells with CLP equal to 0 that are dropped after being received. This statistic is classified as level 1 in the multilevel statistics. The corresponding name is RX CLP0 Non-cmplt. Range: 0 to (232-1) cells |
90 |
No of cells rx non-comp w/clp=1 drpd |
CLP RX Port |
Ingress-2 |
Provides a count of the non-compliant cells with CLP equal to 1 that are dropped after being received. This statistic is classified as level 1 in the multilevel statistics. The corresponding name is RX CLP1 Non-cmpl. Range: 0 to (232-1) cells |
91 |
No of cells rx congested w/clp=0 drpd |
Cells Rx with CLP=0 |
Ingress-2 |
Provides a count of the received cells with CLP equal to 0 that are dropped from a congested line. This statistic is classified as level 1 in the multilevel statistics. The corresponding name is RX CLP0 Cong Dscd. Range: 0 to (232-1) cells |
92 |
No of cells rx congested w/clp=1 drpd |
CLP RX Port |
Ingress-2 |
Provides a count of the received cells with CLP equal to 1 that are dropped from a congested line. This statistic is classified as level 1 in the multilevel statistics. The corresponding name is RX CLP1 Cong Dscd. Range: 0 to (232-1) cells |
93 |
No of cells tx with clp=1 to nw |
Cells TX Network |
Ingress-4 |
Provides a count of the total cells with CLP equal to 1 that are transmitted to the bus. This statistic is classified as level 2 in the multilevel statistics. The corresponding name is RX CLP1 to NW. Range: 0 to (232-1) cells |
94 |
No of cells tx w/efci=0 to nw |
Cells TX Network |
Ingress-4 |
Provides a count of the cells with an EFCI bit equal to 0 that are transmitted to the bus. This statistic is classified as level 2 in the multilevel statistics. The corresponding name is RX EFCI 0 to NW. Range: 0 to (232-1) cells |
95 |
No of cells tx w/efci=1 to nw |
Cells TX Network |
Ingress-4 |
Provides a count of the cells with an EFCI bit equal to 1 that are transmitted to the bus. This statistic is classified as level 2 in the multilevel statistics. The corresponding name is RX EFCI 1 to NW. Range: 0 to (232-1) cells |
96 |
No of cells tx w/efci=0 to port |
Cells TX Port |
Egress-13 |
Provides a count of the cells with an EFCI bit equal to 0 that are transmitted to the port (to the equipment connected to the port). This statistic is collected after the cells are received from the bus and have passed egress queuing and servicing. Range: 0 to (232-1) cells |
97 |
No of cells rx congested w/EOF dscd |
Total Cells RX Port |
Ingress-3 |
Provides a count of the ingress EOF cells with an EFCI bit equal to 0 that are discarded from a congested line. This statistic is classified as level 2 in the multilevel statistics. The corresponding name is RX EOF CNG DSC. Range: 0 to (232-1) cells |
98 |
No of cells tx w/eof=1 to port |
Cells Tx Port |
Egress-13 |
Provides a count of the cells with EOF equal to 1 that are transmitted to the port. This statistic is classified as level 2 in the multilevel statistics. The corresponding name is TX EOFs to Port. Range: 0 to (232-1) cells |
99 |
No of RM cells tx to port |
Cells Tx Port |
Egress-13 |
Provides a count of RM cells that are transmitted to the port. This statistic is classified as level 3 in the multilevel statistics. The corresponding name is RM Cells to Port. Range: 0 to (232-1) cells |
100 |
No of cells rx w/efci=0 from port |
Total Cells Rx Port |
Ingress-2 |
Provides a count of the cells with an EFCI bit equal to 0 that are received from the port. This statistic is classified as level 3 in the multilevel statistics. The corresponding name is RX EFCI 0 from Port. Range: 0 to (232-1) cells |
101 |
Cells rx w/EFCI from port |
Total Cells Rx Port |
Ingress-2 |
Provides a count of the cells with an EFCI bit equal to 1 that are received from the port. This statistic is classified as level 3 in the multilevel statistics. The corresponding name is RX EFCI 1 from Port. Range: 0 to (232-1) cells |
102 |
No of OAM cells rx from port |
Total Cells Rx Port |
Ingress-1 |
Provides a count of OAM cells that are received from the port. This statistic is classified as level 3 in the multilevel statistics. The corresponding name is OAM from Port. Range: 0 to (232-1) cells |
103 |
No of cells rx w/RM from port |
Total Cells Rx Port |
Ingress-1 |
Provides a count of RM cells that are received from the port. This statistic is classified as level 3 in the multilevel statistics. The corresponding name is RM Cells from Port. Range: 0 to (232-1) cells |
104 |
Cells rx congested w/EFCI0 dscd |
No of cells rx w/efci=0 from port |
Ingress-2 |
Provides a count of the cells with an EFCI bit equal to 0 that are discarded from a congested line. This statistic is classified as level 3 in the multilevel statistics. The corresponding name is Rx EFCI 0 Cng Dsc. Range: 0 to (232-1) cells |
105 |
Cells rx congested w/EFCI1 dscd |
Cells rx w/EFCI from port |
Ingress-2 |
Provides a count of the cells with an EFCI bit equal to 1 that are discarded from a congested line. This statistic is classified as level 3 in the multilevel statistics. The corresponding name is Rx EFCI 1 Cng Dsc. Range: 0 to (232-1) cells |
106 |
Cells rx congested w/OAM dscd |
No of OAM cells rx from port |
Ingress-1 |
Provides a count of the total OAM cells that are received and then discarded because of congestion. This statistic is classified as level 3 in the multilevel statistics. The corresponding name is Rx OAM Cng Dsc. Range: 0 to (232-1) cells |
107 |
Cells rx congested w/RM dscd |
No of cells rx w/RM from port |
Ingress-1 |
Provides a count of the total RM cells that are received and then discarded because of congestion. This statistic is classified as level 3 in the multilevel statistics. The corresponding name is Rx RM Cng Dsc. Range: 0 to (232-1) cells |
108 |
No of cells tx w/FRm to nw |
No of cells tx w/BRm+FsRm to nw |
Ingress-4 |
Provides a count of the total forward RM cells that are transmitted to the bus. This statistic is classified as level 3 in the multilevel statistics. The corresponding name is Rx FRM to NW. Range: 0 to (232-1) cells |
109 |
No of cells tx w/BRm+FsRm to nw |
No |
Ingress-4 |
Provides a count of the total backward forward RM cells transmitted to the bus. This statistic is classified as level 3 in the multilevel statistics. The corresponding name is Rx BRM/Fst to NW. Range: 0 to (232-1) cells |
110 |
No of cells rx w/efci=0 from nw |
No |
Egress-12 |
Provides a count of the cells with an EFCI bit equal to 0 that are received from the bus. This statistic is classified as level 3 in the multilevel statistics. The corresponding name is TX EFCI 0 from NW. Range: 0 to (232-1) cells |
111 |
No of cells rx w/efci=1 from nw |
Cells RX Network |
Egress-12 |
Provides a count of the cells with an EFCI bit equal to 1 that are received from the bus. This statistic is classified as level 3 in the multilevel statistics. The corresponding name is RX EFCI 1 from NW. Range: 0 to (232-1) cells |
112 |
No of egress OAM cells rx |
Cells RX Network |
Egress-12 |
Provides a count of the OAM cells that are received from the bus. This statistic is classified as level 3 in the multilevel statistics. The corresponding name is OAM From NW. Range: 0 to (232-1) cells |
113 |
No of egress cells rx w/RM |
Cells RX Network |
Egress-12 |
Provides a count of the RM cells that are received from the bus. This statistic is classified as level 3 in the multilevel statistics. The corresponding name is RM From NW. Range: 0 to (232-1) cells |
114 |
Cells tx congested w/EFCI0 dscd |
No |
Egress-13 |
Provides a count of the discarded cells that have an EFCI bit equal to 0. This statistic is collected after the cells are received from the bus and have passed egress queuing and servicing. This statistic is classified as level 3 in the multilevel statistics. The corresponding name is Tx EFCI 0 Cng Dsc. Range: 0 to (232-1) cells |
115 |
Cells tx congested w/EFCI1 dscd |
No |
Egress-13 |
Provides a count of the discarded cells that have an EFCI bit equal to 1. This statistic is collected after the cells are received from the bus and have passed egress queuing and servicing. This statistic is classified as level 3 in the multilevel statistics. The corresponding name is Tx EFCI 1 Cng Dsc. Range: 0 to (232-1) cells |
116 |
Cells tx congested w/RM dscd |
No |
Egress-13 |
Provides a count of the RM cells that are discarded due to congestion. This statistic is collected after the cells are received from the bus and have passed egress queuing and servicing. This statistic is classified as level 3 in the multilevel statistics. The corresponding name is Tx RM Cng Dsc. Range: 0 to (232-1) cells |
117 |
Cells tx congested w/OAM dscd |
No |
Egress-13 |
Provides a count of the OAM cells that are discarded due to congestion. This statistic is collected after the cells are received from the bus and have passed egress queuing and servicing. This statistic is classified as level 3 in the multilevel statistics. The corresponding name is Tx OAM Cng Dsc. Range: 0 to (232-1) cells |
FRSM Connection
This section provides information about the Frame Relay statistics contained in the MGX Frame Relay Connection group. The statistics in this group are applicable to the FRSM card on the MGX 8220, MGX 8230, MGX 8250, and MGX 8850 Release 1 nodes.
The following table lists the attributes that are common to the FRSM connection statistics.
Front Cards |
FRSM-8T1, FRSM-8E1, FRSM-2CT3, FRSM-2T3, FRSM-2E3, FRSM-HS2, FRSM-HS1 |
Back Cards |
RJ48-8T1, RJ48-8E1, BNC-2T3, BNC-2E3, SCSC2-2HSSI |
Object Type |
0 |
Subobject Type |
8 |
Default Peak Interval |
300 seconds |
The FRSM connection statistics are primarily used for gathering billing and performance data.
The following table includes the description of each statistic and the point during the data flow at which the statistic gathers the appropriate information. Each measurement point refers to the corresponding point in Figure 4-1, with the exception of the following ingress points:
•1—Frame is validated against errors at the port level, for example CRC, alignment errors, and an undefined DCLI.
•2—Frame is checked for queue depth and queue threshold.
•3— Policing occurs.
•4—Frame is queued and transmitted to the cell bus in the ATM cells.
|
Stat ID
|
FRSM Connection Statistics
|
Subset of Other Stats
|
Ingress/Egress Measurement Point
|
Description
|
0 |
Frames Received |
No |
After validating the frame against errors-1 |
Provides a count of frames received from the attached equipment. This statistic also increments when the received frame is discarded for one of the following reasons: •Queue depth exceeded. •DE threshold exceeded for frames with DE bit set. •Usage parameter control (UPC) discard. •Unknown protocols in service interworking (SIW) translation. Range: 0 to (232-1) |
1 |
Receive Frames Discarded |
Frames Received |
Ingress-2, 3 |
Provides a count of the discarded frames received from the attached equipment. Possible reasons for discard include •Frames are received with DE equal to 1 and the PVC ingress queue is filled at least to the DE threshold. Frames discarded for this reason are counted in the PVC DE Frames Dropped statistic. •Frames are received with DE equal to 0, but have been DE tagged because of policing. In addition, the PVC ingress queue is filled at least to the DE threshold. Frames discarded for this reason are counted in the PVC DE Frames Dropped statistic. •PVC ingress queue is full. The queue might fill (and overflow) due to sustained transmission above the PVC committed information rate (CIR). Frames discarded for this reason are counted in the PVC Rx Frames Discarded VC Q Overflow statistic. •Frames do not pass policing. Frames discarded for this reason are counted in the PVC Rx Frames Discarded UPC statistic. •Protocols encoded in SIW frame are unknown. Frames discarded for this reason are counted in the PVC Rx Frames Unknown Protocols statistic. Range: 0 to (232-1) |
2 |
Frames Transmitted |
No |
Egress-13 |
Provides a count of the frames that are transmitted to the attached equipment after frame reassembling. Range: 0 to (232-1) |
3 |
Transmit Frames Discarded |
No |
Egress-12, 13 |
Provides a count of the number of frames unable to be transmitted to the attached equipment. Possible reasons for discard include •PVC transmit queue overflow—The frame traversed the network successfully but encountered a full egress VC queue. Frames discarded for this reason are counted in the PVC Tx Frames Discarded-VC-Q-Overflow statistic. •Incomplete frame at egress—No end-of-frame (EOF) cell was received. The EOF cell is missing due to discards in the network and the timer expiring. Frames discarded for this reason are counted in the Tx Frames Discarded-Trunk Discard statistic. •Incorrect frame length—The expected frame length (recorded in the EOF cell) is different than the length of payload of that frame. This error might be caused by cells missing due to discards on a trunk, or by an EOF cell transmission bit error in the frame length field. Frames discarded for this reason are counted in the Tx Frame Length Violation statistic. •Invalid frame length—The frame is longer than
4510 octets long. The EOF cell from one frame is missing due to discards on a trunk, resulting in a concatenated frame. Frames discarded for this reason are counted in the PVC Tx Frames Discarded Oversized SDUs statistic. •Frame CRC error—The calculated CRC does not match the original frame CRC (contained within the EOF cell). This mismatch occurs due to payload bit transmission errors on the cells or because of lost cells. Frames discarded for this reason are counted in the PVC Tx Frames Discarded Ingress CRC. •Port inactive—Logical port is not active. Frames discarded for this reason are not counted in any statistic. •Unknown protocols—Protocols encoded in SIW frame are not defined. Frames discarded for this reason are counted in the PVC Tx Frames Unknown Protocols statistic. •Common part indicator (CPI) error—CPI bit in the AAL5 PDU received from the network is non-zero. Frames discarded for this reason are counted in the PVC Tx Frames Invalid CPIs statistic. Range: 0 to (232-1) |
9 |
Bytes Received |
No |
After validating the frame against errors-1 |
Provides the number of bytes in the frames counted by the Frames Received statistic. The count includes Frame Relay header and frame check sequence (FCS)/cyclic redundancy check (CRC) bytes. Range: 0 to (232-1) |
10 |
Receive Bytes Discarded |
Bytes Received |
Ingress-2, 3 |
Provides the number of bytes in the frames counted by the Receive Frames Discarded statistic. The count includes Frame Relay header and FCS/CRC bytes. Range: 0 to (232-1) |
11 |
Bytes Transmitted |
No |
Egress-13 |
Provides the number of bytes in the frames counted by the Frames Transmitted statistic. The count includes Frame Relay header and FCS/CRC bytes. Range: 0 to (232-1) |
12 |
Transmit Bytes Discarded |
No |
Egress-12, 13 |
Provides the number of bytes in the frames counted by the Transmit Frames Discarded statistic. The count includes Frame Relay header and FCS/CRC bytes. Range: 0 to (232-1) |
16 |
Seconds In Service |
No |
Not applicable |
Provides a count of the seconds that the permanent virtual circuit (PVC) is in service without any alarms. Range: 0 to (232-1) |
17 |
Frames Transmitted with FECN |
Frames Transmitted |
Egress-13 |
Provides a count of the frames with the forward explicit congestion notification (FECN) bit set that are transmitted to the attached equipment. The congestion can occur anywhere in the network. Range: 0 to (232-1) |
18 |
Frames Transmitted with BECN |
Frames Transmitted |
Egress-13 |
Provides a count of the frames with the backward explicit congestion notification (BECN) bit set that are transmitted to the attached equipment. The congestion can occur anywhere in the network. Range: 0 to (232-1) |
21 |
DE Frames Received |
Frames Received |
After validating the frame against errors-1 |
Provides a count of the frames with the discard eligible (DE) bit set that are received from the attached equipment. Range: 0 to (232-1) |
22 |
DE Frames Transmitted |
Frames Transmitted |
Egress-13 |
Provides a count of the frames with the DE bit set that are transmitted to the attached equipment. Range: 0 to (232-1) |
23 |
DE Frames Dropped |
Frames Received Receive Frames Discarded DE Frames Received |
Ingress-2 |
Provides a count of the frames with the DE bit set that are discarded. These frames are dropped when the connection ingress buffer exceeds the DE threshold. Range: 0 to (232-1) |
24 |
DE Bytes Received |
Bytes Received |
Before policing-1 |
Provides the number of bytes in the frames counted by the DE Frames Received statistic. The count includes Frame Relay header and FCS/CRC bytes. Range: 0 to (232-1) |
25 |
Frames Rx in Excess of CIR |
Frames Received |
Ingress-2 |
Provides a count of the frames received that are in excess of the committed information rate (CIR). Range: 0 to (232-1) |
27 |
Frames Tx in Excess of CIR |
Frames Transmitted |
Egress-13 |
Provides a count of the frames transmitted that are in excess of the CIR. Range: 0 to (232-1) |
28 |
Tx Bytes Tagged DE |
Bytes Transmitted |
Egress-12 |
Provides the number of bytes in the frames counted in the Tx Frames Tagged DE statistic. The count includes the Frame Relay header and FCS/CRC bytes. Range: 0 to (232-1) |
29 |
Tx Frames Tagged DE |
Frames Transmitted DE Frames Transmitted |
Egress-12 |
Provides a count of the number of frames that have the DE bit tagged. This statistic is only applicable for network interworking (NIW) connections with the CLP to DE mapping mode set to mapDE. If the incoming frame has the DE bit set to 0, and the CLP bit is set on any of the cells, then the DE bit is tagged for that frame. Range: 0 to (232-1) |
33 |
Rx Frames Discarded- VC-Q-Overflow |
Frames Received Receive Frames Discarded |
Ingress-2 |
Provides a count of the frames received from the CPE that are discarded because the virtual channel (VC) queue (PVC ingress buffer) is full. Range: 0 to (232-1) |
34 |
Rx Bytes Discarded- VC-Q-Overflow |
Bytes Received Receive Bytes Discarded |
Ingress-2 |
Provides the number of bytes in the frames counted by the Rx Frames Discarded VC-Q-Overflow statistic. The count includes Frame Relay header and FCS/CRC bytes. Range: 0 to (232-1) |
35 |
Tx Frames Discarded-Q-
Overflow |
Transmit Frames Discarded |
Egress-12 |
Provides a count of the frames that are not transmitted to the attached equipment because either the PVC egress buffer (VC queue) or the port queue is full. Range: 0 to (232-1) |
36 |
Tx Bytes Discarded- Q-Overflow |
Transmit Bytes Discarded |
Egress-12 |
Provides the number of bytes in the frames counted by the Tx Frames Discarded-Q-Overflow statistic. The count includes Frame Relay header and FCS/CRC bytes. Range: 0 to (232-1) |
37 |
Tx Frames Discarded- Ingress CRC |
Transmit Frames Discarded |
Egress-12 |
Provides a count of the frames that are not transmitted to the attached equipment because of an incorrect CRC. The received CRC, included in the end-of-frame (EOF), is compared to the calculated CRC on the contents of all the cells that arrive. An incorrect CRC is caused by at least one cell missing due to discard(s) on a trunk or to a transmission bit error on a payload bit. Range: 0 to (232-1) |
39 |
Tx Frames Discarded-Trunk Discard |
Transmit Frames Discarded |
Egress-12 |
Provides a count of the frames that are not transmitted to the attached equipment because the EOF cells are discarded in the network or the reassembly timer expires. Range: 0 to (232-1) |
41 |
Tx Frames during Ingress LMI Fail |
Frames Transmitted |
Egress-13 |
Provides a count of the frames that are transmitted to the attached equipment while the Local Management Interface (LMI) signaling protocol on the local port failed. The portSignallingState object displayed is in an LMI failure state. Range: 0 to (232-1) |
42 |
Tx Bytes during Ingress LMI Fail |
Bytes Transmitted |
Egress-13 |
Provides a count of bytes in the frames counted in the Tx Frames during Ingress LMI Fail statistic. The count includes the Frame Relay header and FCS/CRC bytes. Range: 0 to (232-1) |
43 |
Rx Frames Discarded UPC |
Frames Received Receive Frames Discarded |
Ingress-3 |
Provides a count of the frames discarded due to usage parameter control (UPC). Both Bc and Be buckets are full, and the frames do not pass policing. Range: 0 to (232-1) |
46 |
Tx Frames Invalid CPIs |
Transmit Frames Discarded |
Egress-12 |
Provides a count of the frames that are not transmitted to the attached equipment because of an invalid common part indicator (CPI). An invalid CPI is a non zero number. Range: 0 to (232-1) |
47 |
Tx Frames Length Violations |
Transmit Frames Discarded |
Egress-12 |
Provides a count of the frames that are not transmitted to the CPE because the expected frame length (recorded in the AAL5 EOF cell) is different than the total payload of all the cells that arrived. A frame length error occurs for the following reasons: •At least one missing packet •Transmission bit error on the frame length field in the AAL5 EOF cell Range: 0 to (232-1) |
48 |
Tx Frames Oversize SDUs |
Transmit Frames Discarded |
Egress-12 |
Provides a count of the frames that are not transmitted to the CPE because of an invalid length. The frame is longer than 4510 bytes. This invalid length occurs when the AAL5 EOF cell of a frame is missing due to discards on a trunk. The result is a concatenated frame. Range: 0 to (232-1) |
49 |
Tx Frames Unknown Protocols |
Transmit Frames Discarded |
Egress-12 |
Provides a count of the frames that are not transmitted to the attached equipment because the incoming PDU (routed or bridged) is not recognized or supported. This statistic is applicable only for service interworking (SIW) translation connections. Range: 0 to (232-1) |
50 |
Rx Frames Unknown Protocols |
Frames Received Receive Frames Discarded |
After point 3 and before queueing |
Provides a count of the frames that are discarded because the incoming PDU (routed or bridged) is not recognized or supported. This statistic is only applicable for SIW translation connections. Range: 0 to (232-1) |
AUSM Connection
This section provides information about the ATM connection statistics contained in the MGX ATM Connection group. The statistics in this group are applicable to the AUSM card on the MGX 8220, MGX 8230, MGX 8250, and MGX 8850 Release 1 nodes.
The following table lists the attributes that are common to the AUSM connection statistics.
Front Cards |
AUSM-8T1E1 Revision B |
Back Cards |
LM-RJ48-8T1/LM-RJ48-8E1, OC-3, OC-121 |
Object Type |
0 (Connection) |
Subobject Type |
9 (ATM connection) |
Default Peak Interval |
300 seconds |
The AUSM connection statistics are primarily used for gathering billing and performance data.
The following table includes the description of each statistic and the point during the data flow at which the statistic gathers the appropriate information. Each measurement point refers to the corresponding point in Figure 4-1.
|
Stat ID
|
AUSM Connection Statistics
|
Subset of Other Stats
|
Ingress/Egress Measurement Point
|
Description
|
16 |
Seconds In Service |
No |
Not applicable |
Provides a count of the total number of seconds the channel is in service (in an active state). The count does not increment when the channel is in alarm. Range: 0 to (232-1) |
34 |
Discard CLPth Rx Port |
Total Cells Rx from Line |
At the policing stage-1 |
Provides a count of the cells discarded due to policing action or cell loss priority (CLP). If the CLP bit in the ATM header is set to 1, cells are discarded. Range: 0 to (232-1) |
35 |
Discard Qfull Rx Port |
Total Cells Rx from Line |
At the VC queuing stage-2 |
Provides a count of the cells discarded due to the virtual channel (VC) queue being full. The ingress queue is full when the queue depth is greater than the maximum allowed queue depth. The cells are received from the ingress side (from equipment connected to the port), and are dropped before entering the network. Range: 0 to (232-1) |
55 |
Number of Cells Rx w/CLP Set |
Total Cells Rx from Line |
Before the policing stage-1 |
Provides a count of the cells with CLP equal to 1 that are received from the ingress side (from equipment connected to the port). Range: 0 to (232-1) |
56 |
Number Of Cells Rx w/EFCI Set |
Total Cells Rx from Line |
Before the policing stage-1 |
Provides a count of the cells with the explicit forward congestion indication (EFCI) bit set to 1 that are received from the ingress side (from equipment connected to the port). Range: 0 to (232-1) |
57 |
Number of Cells Rx w/ UPC CLP Set |
Total Cells Rx from Line |
After the policing stage-between 1
and 2 |
Provides a count of the cells with the usage parameter control (UPC) CLP equal to 1 that are received from the ingress side (from equipment connected to the port). If cells are non-compliant to the sustainable cell rate (SCR) at the second bucket, they are tagged with CLP equal to 1. Range: 0 to (232-1) |
59 |
Discarded Cells for Shelf Alarm |
Total Cells Rx from Line |
Before the policing stage-1 |
Provides a count of the cells that are discarded during a shelf alarm (environmental condition). These cells are received from the ingress side (from the equipment connected to the port), and are discarded before entering the network. Range: 0 to (232-1) |
61 |
Total Cells Tx from Line |
Total Cells Rx from Line |
After the policing and the queuing stages where cells enter the network-3 |
Provides a count of the cells that are transmitted to the bus after going through the policing and queuing stages. The count includes the total number of data cells that are transmitted to the cell bus after UPC and ingress queuing. The count does not include the number of cells that are discarded at the policing and queuing stages or the number of the OAM cells that are transmitted. Range: 0 to (232-1) |
68 |
Total Cells Rx from Line |
No |
Before the policing stage-1 |
Provides a count of the total number of data cells that are received from the port. The count includes the sum of CLP (0+1) cells. The count does not include management cells that are received from the port. Range: 0 to (232-1) |
70 |
VC queue flushed by SAR |
No |
Ingress |
Provides a count of the cells discarded from the VC queue by the segmentation and reassembly (SAR) layer. The queue is flushed at certain intervals. Note This statistic is not supported. Range: 0 to (232-1) |
71 |
Total Cells Tx to Line |
No |
Egress-7, 13 |
Provides a count of the total cells that are transmitted. Range: 0 to (232-1) |
72 |
Total Cells Tx to Line w/CLP set |
— |
Egress-13 |
Provides a count of the cells with cell loss priority (CLP) bit set to 1 that are transmitted. Range: 0 to (232-1) |
73 |
Discard Qfull Tx Port |
— |
Egress-13 |
Provides a count of the transmitted cells that are discarded because the queue is full. Range: 0 to (232-1) |
74 |
Discard CLPth Tx Port |
No |
Egress-13 |
Provides a count of the cells discarded due to policing action or cell loss priority (CLP). If the CLP bit in the ATM header is set to 1, cells are discarded. Range: 0 to (232-1) |
75 |
Total No. of Cells Tx to N/W |
— |
— |
Provides a count of the total cells sent to the network after leaving the queuing engine. Range: 0 to (240-1) cells |
76 |
Total No. of Cells Tx to N/W w/CLP set |
No |
Egress-13 |
Provides a count of the cells with the cell loss priority (CLP) bit set that are transmitted. Range: 0 to (232-1) |
CESM Connection
This section provides information about the statistics contained in the circuit emulation (CE) Connection group. The statistics in this group are applicable to the CESM card on the MGX 8220, MGX 8230, MGX 8250, and MGX 8850 Release 1 nodes.
The following table lists the attributes that are common to the CE connection statistics.
Front Cards |
AX-CESM-8T1, AX-CESM-8E1, MGX-CESM-T3, MGX-CESM-E3 |
Back Cards |
RJ48-8T1, RJ48-8E1, SMB-8E1, BNC-2T3, BNC-2E3 |
Object Type |
0 |
Subobject Type |
10 |
Default Peak Interval |
300 seconds |
The CE connection statistics are primarily used for gathering billing data.
The following table includes the description of each statistic and the point during the data flow at which the statistic gathers the appropriate information. Each measurement point refers to the corresponding point in Figure 4-1.
|
Stat ID
|
CESM Connection Statistics
|
Subset of Other Stats
|
Ingress/Egress Measurement Point
|
Description
|
58 |
AAL1 Sequence Mismatch |
— |
— |
Provides a count of the sequences of mismatches. Range: 0 to (232-1) |
64 |
HCS Correctable Error |
— |
— |
Provides a count of the header checksum errors (HCS) that are corrected. Range: 0 to (232-1) |
66 |
Loss of Cell Delineation |
— |
— |
Provides a count of the instances with loss of cell delineation. Range: 0 to (232-1) |
71 |
Total Cells Tx to Line |
— |
— |
Provides a count of the total cells that are transmitted to the line. Range: 0 to (232-1) |
72 |
Total Cells Rx to Line |
— |
— |
Provides a count of the total cells that are received from the line. Range: 0 to (232-1) |
73 |
Seconds In Service |
— |
— |
Provides a count of the seconds that a permanent virtual circuit (PVC) is in service without alarms. Range: 0 to (232-1) |
PXM1 Connection
This section provides information about the statistics contained in the Broadband Connection group. The statistics in this group are applicable to the PXM1 card on the MGX 8230, MGX 8250, and MGX 8850 Release 1 nodes.
The following table lists the attributes that are common to the PXM1 connection statistics.
Front Cards |
PXM |
Back Cards |
PXM-UI RJ-45/48, BNC, DB-15 |
Object Type |
0 |
Subobject Type |
11 |
Default Peak Interval |
300 seconds |
The PXM1 connection statistics are primarily used for gathering billing data.
The following table includes the description of each statistic and the point during the data flow at which the statistic gathers the appropriate information. Each measurement point refers to the corresponding point in Figure 4-1.
|
Stat ID
|
PXM1 Connection Statistics
|
Subset of Other Stats
|
Ingress/Egress Measurement Point
|
Description
|
1 |
Number of Cells Rx w/CLP Set |
— |
— |
Provides a count of the cells with the cell loss priority (CLP) bit set that are received. Range: 0 to (232-1) |
2 |
Cells Rx w/CLP=0 |
— |
— |
Provides a count of the cells with CLP equal to 0 that are received. Range: 0 to (232-1) |
3 |
Nonconforming cells Rx at Gcra1 Policer |
— |
— |
Provides a count of the nonconforming cells that are received at the first policing point. Range: 0 to (232-1) |
4 |
Nonconforming cells Rx at Gcra2 Policer |
— |
— |
Provides a count of the nonconforming cells that are received at the second policing point. Range: 0 to (232-1) |
5 |
No. of EOF cells Rx |
— |
— |
Provides a count of the end of frame (EOF) cells that are received. Range: 0 to (232-1) |
6 |
Cells Rx w/CLP=0 discarded |
— |
— |
Provides a count of the cells with CLP equal to 0 that are received then discarded. Range: 0 to (232-1) |
7 |
Cells Rx w/CLP discarded |
— |
— |
Provides a count of the cells with the CLP bit set that are received then discarded. Range: 0 to (232-1) |
8 |
No. of Rx cells sent |
— |
— |
Provides a count of the cells that are received and sent to the queue. Range: 0 to (232-1) |
9 |
Cells Tx w Efci=0 |
— |
— |
Provides a count of the cells with the explicit forward congestion indication (EFCI) bit equal to 0 that are transmitted. Range: 0 to (232-1) |
10 |
Cells Tx w Efci set |
— |
— |
Provides a count of the cells with the EFCI bit set that are transmitted. Range: 0 to (232-1) |
11 |
Cells Rx w/CLP=0 discarded at Output |
— |
— |
Provides a count of the cells with CLP equal to 0 that are received then discarded at the output. Range: 0 to (232-1) |
12 |
Cells Rx w/CLP set discarded at Output |
— |
— |
Provides a count of the cells with the CLP bit set that are received then discarded at the output. Range: 0 to (232-1) |
AXSM Connection
This section provides information about the statistics contained in the AXSM_ATM_conn group. This group contains statistics that are applicable AXSM card on the MGX 8850 Release 2 switch.
The following table lists the attributes that are common to all of the AXSM connection statistics.
Front Cards |
MGX-AXSM-16-T3E3, MGX-AXSM-16-155, MGX-AXSM-4-622, MGX-AXSM-1-2488 |
Back Cards |
MGX-SMB-8-T3, MGX-SMB-8-E3, MGX-SMB-4-155, MGX-SMFIR-8-155, MGX-SMFLR-8-155, MGX-MMF-8-155, MGX-SMFLR-2-622, MGX-SMFIR-2-622, MGX-SMFSR-1-2488, MGX-SMFLR-1-2488, MGX-SMFXLR-1-2488 |
Object Type |
0 |
Subobject Type |
12 |
Default Peak Interval |
300 seconds |
The AXSM connection statistics are primarily used for gathering billing data.
The following table includes the description of each statistic and the point during the data flow at which the statistic gathers the appropriate information. Each measurement point refers to the corresponding point in Figure 4-1.
|
Stat ID
|
AXSM Connection Statistics
|
Subset of Other Stats
|
Ingress/Egress Measurement Point
|
Description
|
0 |
Ingress CLP0 Cells From Port |
No |
Ingress-2, 8 |
Provides a count of the ingress cells with cell loss priority (CLP) equal to 0 that are received. Range: 0 to (240-1) cells |
1 |
Ingress CLP1 Cells From Port |
No |
Ingress-2, 8 |
Provides a count of the ingress cells with CLP equal to 1 that are received. Range: 0 to (240-1) cells |
2 |
Ingress CLP0 cells discarded |
Ingress CLP0+1 cells discarded |
Ingress-2, 8 |
Provides a count of the ingress cells with CLP equal to 0 that are discarded due to policing. Range: 0 to (240-1) cells |
3 |
Ingress CLP0+1 cells discarded |
No |
Ingress-2, 8 |
Provides a count of the total ingress cells with CLP (0+1) that are discarded due to policing. Range: 0 to (240-1) cells |
4 |
Ingress CLP0+1 non-compliant cells |
No |
Ingress-2, 8 |
Provides a count of the total cells that are non-compliant as a result of policing. Depending on the configuration, this count includes cells that are tagged non-compliant or are discarded. Range: 0 to (240-1) cells |
5 |
Ingress EFCI=1 Cells From Port |
No |
Ingress-3, 9 |
Provides a count of the ingress explicit forward congestion indication (EFCI) cells. Range: 0 to (240-1) cells |
6 |
Ingress EOF=1 Cells From Port |
No |
Ingress-3, 9 |
Provides a count of the ingress end of frame (EOF) cells. Range: 0 to (240-1) cells |
7 |
Egress CLP0 Cells to Port |
No |
Egress-7, 13 |
Provides a count of the egress cells with CLP equal to 0. Range: 0 to (240-1) cells |
8 |
Egress CLP1 Cells to Port |
No |
Egress-7, 13 |
Provides a count of the egress cells with CLP equal to 1. Range: 0 to (240-1) cells |
9 |
Egress EFCI=1 Cells to Port |
No |
Egress-6, 12 |
Provides a count of the egress cells with EFCI equal to 1. Range: 0 to (240-1) cells |
10 |
Egress EOF=1 Cells to Port |
No |
Egress-6, 12 |
Provides a count of the egress cells with EOF equal to 1. Range: 0 to (240-1) cells |
AXSM-E Connection
This section provides information about the statistics contained in the AXSME_ATM_conn group. The AXSM-E connection statistics in this group are applicable to the MGX 8850 Release 2 switch.
The following table lists the attributes that are common to the AXSM-E connection statistics.
Front Cards |
AXSM-2-622-E, AXSM-8-155-E, AXSM-16-T3E3-E |
Back Cards |
SMFLR-1-622, SMFIR-1-622, SMFLR-4-155, SMFIR-4-155, MMF-4-155, SMB-4-155, SMB-8-T3, SMB-8-E3 |
Object Type |
0 |
Subobject Type |
13 |
Allowable Peak Intervals |
60 seconds, 300 seconds |
Default Peak Interval |
300 seconds |
The AXSM-E connection statistics are primarily used for gathering troubleshooting and performance data.
The tables in this section include the description of each statistic and the point during the data flow at which the statistic gathers the appropriate information. Each measurement point refers to the corresponding point in Figure 4-1.
Note AXSM-E statistics are only collected at measurement points 1, 2, and 13.
|
Stat ID
|
AXSM-E Connection Statistics
|
Subset of Other Stats
|
Ingress/Egress Measurement Point
|
Description
|
1 |
CLP1 non-compliant cells |
Tagged non compliant cells |
Ingress-1 |
Provides a count of the discarded cells with cell loss priority (CLP) bit equal to 1 that are tagged non-compliant. Range: 0 to (240-1) cells |
2 |
CLP0 non-compliant cells |
Tagged non compliant cells |
Ingress-1 |
Provides a count of the discarded cells with CLP equal to 0 that are tagged non-compliant. Range: 0 to (240-1) cells |
3 |
Tagged non compliant cells |
No |
Ingress-1 |
Provides a count of the total number of cells that are tagged non-compliant. These cells are received at the port. Range: 0 to (240-1) cells |
5 |
CLP0 cells from port |
No |
Ingress-1 |
Provides a count of the cells with CLP equal to 0. These cells are received from the port before policing. Range: 0 to (240-1) cells |
6 |
CLP1 cells from port |
No |
Ingress-1 |
Provides a count of the cells with CLP equal to 1. These cells are received from the port before policing. Range: 0 to (240-1) cells |
8 |
EFCI=1 cells from the port |
No |
Ingress-2 |
Provides a count of the cells with the explicit forward congestion indication (EFCI) equal to 1. These cells are received from the port. Range: 0 to (240-1) cells |
12 |
EFCI=1 cells to the network |
No |
Ingress-2 |
Provides a count of the cells with EFCI equal to 1 that are transmitted to the bus after policing. Range: 0 to (240-1) cells |
14 |
Ingress CLP0 cells discarded in qe |
No |
Ingress-2 |
Provides a count of the cells with CLP equal to 0 that are discarded due to an overflow in the queuing engine. Range: 0 to (240-1) cells |
15 |
Ingress CLP1 cells discarded in qe |
No |
Ingress-2 |
Provides a count of the cells with CLP equal to 1 that are discarded due to an overflow in the queuing engine. Range: 0 to (240-1) cells |
19 |
CLP1 cells to the port |
No |
After 13 |
Provides a count of the cells with CLP equal to 1 that are transmitted to the port. Range: 0 to (240-1) cells |
20 |
CLP0 cells to the port |
No |
After 13 |
Provides a count of the cells with CLP equal to 0 that are transmitted to the port. Range: 0 to (240-1) cells |
23 |
EFCI=1 cells to the port |
No |
Egress-13 |
Provides a count of the cells with EFCI equal to 1 that are transmitted to the port. Range: 0 to (240-1) cells |
28 |
EFC1=1 cells from the network |
No |
Egress-13 |
Provides a count of the cells with EFCI equal to 1 that are received from the bus prior to queuing. Range: 0 to (240-1) cells |
30 |
Egress CLP0 cells discarded in qe |
No |
Egress-13 |
Provides a count of the cells with CLP equal to 0 that are discarded due to an overflow in the queuing engine. Range: 0 to (240-1) cells |
31 |
Egress CLP1 cells discarded in qe |
No |
Egress-13 |
Provides a count of the cells with CLP equal to 1 that are discarded due to an overflow in the queuing engine. Range: 0 to (240-1) cells |
PXM1E Connection
This section provides information about the statistics contained in the PXM1E Connection group. The PXM1E connection statistics in this group are applicable to the MGX 8830 and MGX 8850 nodes.
The following table lists the attributes that are common to the PXM1E connection statistics.
Front Cards |
PXM1E-8-T3E3, PXM1E-8-155, PXM1E-2-622, PXM1E-T3E3-155 (combo card) |
Back Cards |
MGX-SMB-8T3, MGX-SMB-8E3, MGX-SMFIR-8-155LC/B, MGX-SMFLR-8-155LC/B, MGB-MMF-8-155/B, MGX-SMFIR-8-155LC/C, MGX-SMFLR-8-155LC/C, MGB-MMF-8-155/C, MGX-SMFIR-2-622/B, MGX-SMFLR-2-622/B, MGX-SMFIR-2-622/C, MGX-SMFLR-2-622/C, MGX-FRU-T3E3-155 |
Object Type |
0 |
Subobject Type |
14 |
Allowable Peak Intervals |
60 seconds, 300 seconds |
Default Peak Interval |
300 seconds |
The PXM1E connection statistics are primarily used for gathering troubleshooting and performance data.
The tables in this section include the description of each statistic and the point during the data flow at which the statistic gathers the appropriate information. Each measurement point refers to the corresponding point in Figure 4-1.
|
Stat ID
|
PXM1E Connection Statistics
|
Subset of Other Stats
|
Ingress/Egress Measurement Point
|
Description
|
1 |
Discarded non compliant CLP0 cells |
Tagged non compliant cells |
Ingress-1 |
Provides a count of the discarded cells with cell loss priority (CLP) bit equal to 0 that are tagged non-compliant. Range: 0 to (240-1) cells |
2 |
Discarded non compliant CLP1 cells |
Tagged non compliant cells |
Ingress-1 |
Provides a count of the discarded cells with CLP equal to 1 that are tagged non-compliant. Range: 0 to (240-1) cells |
3 |
Tagged CLP0 non-compliant cells (Ingress) |
No |
Ingress-1 |
Provides a count of the cells with CLP equal to 1 that are tagged non-compliant. These cells are received at the port. Range: 0 to (240-1) cells |
5 |
CLP0 cells from the port (before Policer) |
No |
Ingress-1 |
Provides a count of the cells with CLP equal to 0. These cells are received from the port before policing. Range: 0 to (240-1) cells |
6 |
CLP1 cells from the port (before Policer) |
No |
Ingress-1 |
Provides a count of the cells with CLP equal to 1. These cells are received from the port before policing. Range: 0 to (240-1) cells |
9 |
Cells to network
(leaves QE) |
No |
Ingress-2 |
Provides a count of the total cells sent to the network after leaving the queuing engine. Range: 0 to (240-1) cells |
13 |
Cells discarded in QE (Ingress) |
No |
Ingress-2 |
Provides a count of the total cells that are discarded due to an overflow in the queuing engine. Range: 0 to (240-1) cells |
19 |
CLP0 cells to the Port |
No |
After 13 |
Provides a count of the cells with CLP equal to 0 that are transmitted to the port. Range: 0 to (240-1) cells |
20 |
CLP1 cells to the Port |
No |
After 13 |
Provides a count of the cells with CLP equal to 1 that are transmitted to the port. Range: 0 to (240-1) cells |
25 |
Cells from network |
No |
Egress-13 |
Provides a count of the total cells received from the network. Range: 0 to (240-1) cells |
29 |
Cells discarded in QE(Egress) |
No |
Egress-2 |
Provides a count of the total cells that are discarded due to an overflow in the queuing engine. Range: 0 to (240-1) cells |
FRSM12 Connection
This section provides information about the Frame Relay statistics contained in the FRSM12 Connection group. The statistics in this group are applicable to the FRSM12 card on the MGX 8850 (PXM45) node.
The following table lists the attributes that are common to the FRSM12 connection statistics.
Front Cards |
FRSM-12T3E3 |
Back Cards |
SMB-6T3, SMB-6E3 |
Object Type |
0 |
Subobject Type |
15 |
Default Peak Interval |
300 seconds |
The FRSM12 connection statistics are primarily used for gathering billing and performance data.
The following table includes the description of each statistic and the point during the data flow at which the statistic gathers the appropriate information. Each measurement point refers to the corresponding point in Figure 4-1, with the exception of the following ingress points:
•1—Frame is validated against errors at the port level, for example CRC, alignment errors, and an undefined DCLI.
•2—Frame is checked for queue depth and queue threshold.
•3— Policing occurs.
•4—Frame is queued and transmitted to the cell bus in the ATM cells.
|
Stat ID
|
FRSM12 Connection Statistics
|
Subset of Other Stats
|
Ingress/Egress Measurement Point
|
Description
|
0 |
Frames Transmitted with FECN bit tagged |
No |
Egress-13 |
Provides a count of frames that are transmitted with FECN bit. Range: 0 to (232-1) |
1 |
Frames Transmitted with BECN bit tagged |
No |
Egress-13 |
Provides a count of frames that are transmitted with BECN bit. Range: 0 to (232-1) |
2 |
Frames Txed with FECN bit already set |
Frames Transmitted |
Egress-13 |
Provides a count of the frames with the forward explicit congestion notification (FECN) bit set that are transmitted to the attached equipment. The congestion can occur anywhere in the network. Range: 0 to (232-1) |
3 |
Frames Txed with BECN bit already set |
Frames Transmitted |
Egress-13 |
Provides a count of the frames with the backward explicit congestion notification (BECN) bit set that are transmitted to the attached equipment. The congestion can occur anywhere in the network. Range: 0 to (232-1) |
4 |
DE Frames Transmitted |
No |
Egress-13 |
Provides a count of DE bytes transmitted. Range: 0 to (232-1) |
5 |
DE Bytes Transmitted |
No |
Egress-13 |
Provides a count of DE frames that are transmitted. Range: 0 to (232-1) |
6 |
Frames Transmitted tagged DE |
Frames Transmitted |
Egress-12 |
Provides a count of the number of frames that have the DE bit tagged. This statistic is only applicable for network interworking (NIW) connections with the CLP to DE mapping mode set to mapDE. If the incoming frame has the DE bit set to 0, and the CLP bit is set on any of the cells, then the DE bit is tagged for that frame. Range: 0 to (232-1) |
7 |
Bytes Transmitted tagged DE |
No |
Egress-13 |
Provides a count of bytes transmitted which have been DE tagged at the far end ingress in excess of CIR. Range: 0 to (232-1) |
8 |
Frames Transmitted |
No |
Egress-13 |
Provides a count of the frames that are transmitted to the attached equipment after frame reassembling. Range: 0 to (232-1) |
9 |
Bytes Transmitted |
No |
Egress-13 |
Provides the number of bytes in the frames counted by the Frames Transmitted statistic. The count includes Frame Relay header and FCS/CRC bytes. Range: 0 to (232-1) |
10 |
Frames Txed with invalid CPI Header |
Egress Frames discarded |
Egress-12 |
Provides a count of the frames that are not transmitted to the attached equipment because of an invalid common part indicator (CPI). An invalid CPI is a non zero number. Range: 0 to (232-1) |
11 |
Egress Frames discarded |
No |
Egress-12, 13 |
Provides a count of the number of frames unable to be transmitted to the attached equipment. Possible reasons for discard include •PVC transmit queue overflow—The frame traversed the network successfully but encountered a full egress VC queue. Frames discarded for this reason are counted in the PVC Tx Frames Discarded-VC-Q-Overflow statistic. •Incomplete frame at egress—No end-of-frame (EOF) cell was received. The EOF cell is missing due to discards in the network and the timer expiring. Frames discarded for this reason are counted in the Tx Frames Discarded-Trunk Discard statistic. •Incorrect frame length—The expected frame length (recorded in the EOF cell) is different than the length of payload of that frame. This error might be caused by cells missing due to discards on a trunk, or by an EOF cell transmission bit error in the frame length field. Frames discarded for this reason are counted in the Tx Frame Length Violation statistic. •Invalid frame length—The frame is longer than
4510 octets long. The EOF cell from one frame is missing due to discards on a trunk, resulting in a concatenated frame. Frames discarded for this reason are counted in the PVC Tx Frames Discarded Oversized SDUs statistic. •Frame CRC error—The calculated CRC does not match the original frame CRC (contained within the EOF cell). This mismatch occurs due to payload bit transmission errors on the cells or because of lost cells. Frames discarded for this reason are counted in the PVC Tx Frames Discarded Ingress CRC. •Port inactive—Logical port is not active. Frames discarded for this reason are not counted in any statistic. •Unknown protocols—Protocols encoded in SIW frame are not defined. Frames discarded for this reason are counted in the PVC Tx Frames Unknown Protocols statistic. •Common part indicator (CPI) error—CPI bit in the AAL5 PDU received from the network is non-zero. Frames discarded for this reason are counted in the PVC Tx Frames Invalid CPIs statistic. Range: 0 to (232-1) |
12 |
Egress Frames discarded - source abort |
No |
Egress-13 |
Provides a count of frames that are discarded on the egress due to source abort.; Range: 0 to (232-1) |
13 |
Egress Frames discarded - CRC Error |
Egress Frames discarded |
Egress-12 |
Provides a count of the frames that are not transmitted to the attached equipment because of an incorrect CRC. The received CRC, included in the end-of-frame (EOF), is compared to the calculated CRC on the contents of all the cells that arrive. An incorrect CRC is caused by at least one cell missing due to discard(s) on a trunk or to a transmission bit error on a payload bit. Range: 0 to (232-1) |
14 |
Frames Txed dropped - Unknown Protocols |
Egress Frames discarded |
Egress-12 |
Provides a count of the frames that are not transmitted to the attached equipment because the incoming PDU (routed or bridged) is not recognized or supported. This statistic is applicable only for service interworking (SIW) translation connections. Range: 0 to (232-1) |
15 |
Frames Txed with oversized PDU's |
Egress Frames discarded |
Egress-12 |
Provides a count of the frames that are not transmitted to the CPE because of an invalid length. The frame is longer than 4510 bytes. This invalid length occurs when the AAL5 EOF cell of a frame is missing due to discards on a trunk. The result is a concatenated frame. Range: 0 to (232-1) |
16 |
Frames Txed with length violations |
Egress Frames discarded |
Egress-12 |
Provides a count of the frames that are not transmitted to the CPE because the expected frame length (recorded in the AAL5 EOF cell) is different than the total payload of all the cells that arrived. A frame length error occurs for the following reasons: •At least one missing packet •Transmission bit error on the frame length field in the AAL5 EOF cell Range: 0 to (232-1) |
17 |
Frames Rcvd with FECN bit already set |
No |
Ingress-3 |
Provides a count of frames that are received with FECN bit already set. Range: 0 to (232-1) |
18 |
Frames Rcvd with BECN bit already set |
No |
Ingress-3 |
Provides a count of frames received with BECN bit already set. Range: 0 to (232-1) |
19 |
Frames Rcvd tagged with DE bit |
Frames Received |
After validating the frame against errors-1 |
Provides a count of the frames with the discard eligible (DE) bit set that are received from the attached equipment. Range: 0 to (232-1) |
20 |
Bytes Rcvd tagged with DE bit |
No |
Ingress-3 |
Provides a count of bytes received that are tagged with DE bit. Range: 0 to (232-1) |
21 |
DE Frames Received |
Frames Transmitted |
Ingress-2 |
Provides a count of the frames with the DE bit set that are transmitted to the attached equipment. Range: 0 to (232-1) |
22 |
DE Bytes Received |
Bytes Transmitted |
Ingress-2 |
Provides the number of bytes in the frames counted in the Tx Frames Tagged DE statistic. The count includes the Frame Relay header and FCS/CRC bytes. Range: 0 to (232-1) |
23 |
Frames Received |
No |
After validating the frame against errors-1 |
Provides a count of frames received from the attached equipment. This statistic also increments when the received frame is discarded for one of the following reasons: •Queue depth exceeded. •DE threshold exceeded for frames with DE bit set. •Usage parameter control (UPC) discard. •Unknown protocols in service interworking (SIW) translation. Range: 0 to (232-1) |
24 |
Bytes Received |
No |
After validating the frame against errors-1 |
Provides the number of bytes in the frames counted by the Frames Received statistic. The count includes Frame Relay header and frame check sequence (FCS)/cyclic redundancy check (CRC) bytes. Range: 0 to (232-1) |
25 |
Ingress Frames Disc.-Excess UPC meas. |
Frames Received Ingress Frames Discarded |
Ingress-3 |
Provides a count of the frames discarded due to usage parameter control (UPC). Both Bc and Be buckets are full, and the frames do not pass policing. Range: 0 to (232-1) |
26 |
Ingress Frames Disc.-DE Thshold exceed |
No |
Ingress-2 |
Provides a count of frames discarded on the ingress due to exceeded DE threshold. Range: 0 to (232-1) |
27 |
Ingress Frames Disc.-queue depth exceed |
Frames Received Ingress Frames Discarded |
Ingress-2 |
Provides a count of the frames received from the CPE that are discarded because the queue (PVC ingress buffer) is full. Range: 0 to (232-1) |
28 |
Ingress Bytes Disc.-queue depth exceed |
Bytes Received Ingress Bytes Discarded |
Ingress-2 |
Provides the number of bytes in the frames counted by the Rx Frames Discarded VC-Q-Overflow statistic. The count includes Frame Relay header and FCS/CRC bytes. Range: 0 to (232-1) |
29 |
Ingress Frames Discarded |
Frames Received |
Ingress-2, 3 |
Provides a count of the discarded frames received from the attached equipment. Possible reasons for discard include •Frames are received with DE equal to 1 and the PVC ingress queue is filled at least to the DE threshold. Frames discarded for this reason are counted in the PVC DE Frames Dropped statistic. •Frames are received with DE equal to 0, but have been DE tagged because of policing. In addition, the PVC ingress queue is filled at least to the DE threshold. Frames discarded for this reason are counted in the PVC DE Frames Dropped statistic. •PVC ingress queue is full. The queue might fill (and overflow) due to sustained transmission above the PVC committed information rate (CIR). Frames discarded for this reason are counted in the PVC Rx Frames Discarded VC Q Overflow statistic. •Frames do not pass policing. Frames discarded for this reason are counted in the PVC Rx Frames Discarded UPC statistic. •Protocols encoded in SIW frame are unknown. Frames discarded for this reason are counted in the PVC Rx Frames Unknown Protocols statistic. Range: 0 to (232-1) |
30 |
Ingress Bytes Discarded |
Bytes Received |
Ingress-2, 3 |
Provides the number of bytes in the frames counted by the Receive Frames Discarded statistic. The count includes Frame Relay header and FCS/CRC bytes. Range: 0 to (232-1) |
31 |
Frames Rcvd dropped - Unknown Protocols |
Frames Received Ingress Frames Discarded |
After point 3 and before queueing |
Provides a count of the frames that are discarded because the incoming PDU (routed or bridged) is not recognized or supported. This statistic is only applicable for SIW translation connections. Range: 0 to (232-1) |
32 |
Frames Rcvd tagged with FECN bit |
No |
Ingress-3 |
Provides a count of frames received that are tagged with FECN bit. Range: 0 to (232-1) |
33 |
Frames Rcvd tagged with BECN bit |
No |
Ingress-3 |
Provides a count of frames received that are tagged with BECN bit. Range: 0 to (232-1) |
34 |
Transmitted AIR in Kbps |
No |
Egress-13 |
Provides a count of the transmitted average information rate (AIR) in kbps. Range: 0 to (232-1) |
35 |
Received AIR in Kbps |
No |
Ingress-3 |
Provides a count of the received average information rate in kbps. Range: 0 to (232-1) |
Service Line Statistics
The following service line statistics are applicable to CWM 11:
•IGX T1 Service Line
•IGX E1/J1 Service Line
•BXM and ASI Service Line
•CESM and FRSM E1/T1 Service Line
•AUSM Service
•CESM, FRSM, SRM, and SRME T3/E3 Service
•SRM and SRME SONET Service Line
•AXSM Line
•AXSM-E Line
•PXM1E Service Line
IGX T1 Service Line
This section provides information about the statistics contained in the T1 group. The IGX T1 service line statistics in this group are applicable to Switch Software Releases 9.2 and 9.2 on the UXM card. This group is also applicable to FastPAD lines.
The following table lists the attributes that are common to all of the IGX T1 service line statistics.
Front Cards |
UXM, FTM (FastPAD) |
Back Cards |
UXM - BC-UAI-6-T3/E3, BC-UAI-3-T3/E3, BC-UAI-2/4-155-SMF, BC-UAI-2/4-SMFXLR, BC-UAI-4-STM1E, BC-UAI-4-155-MMF FastPAD - FPC T1, FPC E1, FPC V.35, FPC X.21. |
Object Type |
1 |
Subobject Type |
0 |
Default Peak Interval |
60 seconds (fixed setting) |
The IGX T1 service line statistics are primarily used for gathering billing and performance data.
The following table includes the description of each statistic and the point during the data flow at which the statistic gathers the appropriate information. Each measurement point refers to the corresponding point in Figure 4-1.
|
Stat ID
|
IGX T1 Service Line Statistics
|
Subset of Other Stats
|
Ingress/Egress Measurement Point
|
Description
|
0 |
Bipolar Violations |
— |
— |
Provides a count of the bipolar violations. Range: 0 to (232-1) |
1 |
Frame Slips |
— |
— |
Provides a count of the frame slips. Range: 0 to (232-1) |
2 |
Out of Frames |
— |
— |
Provides a count of the out of frames. Range: 0 to (232-1) |
3 |
Losses of Signal |
— |
— |
Provides a count of the signal losses. Range: 0 to (232-1) |
4 |
Frame Bit Errors |
— |
— |
Provides a count of the frame bit errors. Range: 0 to (232-1) |
5 |
CRC Errors |
— |
— |
Provides a count of the cyclic redundancy check (CRC) errors. Range: 0 to (232-1) |
8 |
Errored blocks |
— |
— |
Provides a count of the errored blocks. Range: 0 to (232-1) |
28 |
Line code violations |
— |
— |
Provides a count of the line code violations. Range: 0 to (232-1) |
IGX E1/J1 Service Line
This section provides information about the statistics contained in the E1/J1 group. IGX E1/J1 service line statistics in this group are applicable to Switch Software Releases 9.2 and 9.3 on the UXM card. This group is also applicable to FastPAD lines.
The following table lists the attributes that are common to all of the IGX E1/J1 service line statistics.
Front Cards |
UXM, FTM (FastPAD) |
Back Cards |
UXM - BC-UAI-6-T3/E3, BC-UAI-3-T3/E3, BC-UAI-2/4-155-SMF, BC-UAI-2/4-SMFXLR, BC-UAI-4-STM1E, BC-UAI-4-155-MMF FastPAD: FPC T1, FPC E1, FPC V.35, and
FPC X.21. |
Object Type |
1 |
Subobject Type |
1 |
Default Peak Interval |
60 seconds (fixed setting) |
The IGX E1/J1 service line statistics are primarily used for gathering billing and performance data.
The following table includes the description of each statistic and the point during the data flow at which the statistic gathers the appropriate information. Each measurement point refers to the corresponding point in Figure 4-1.
|
Stat ID
|
IGX E1/J1 Line Statistics
|
Subset of Other Stats
|
Ingress/Egress Measurement Point
|
Description
|
0 |
Bipolar Violations |
— |
— |
Provides a count of the bipolar violations. Range: 0 to (232-1) |
1 |
Frame Slips |
— |
— |
Provides a count of the frame slips. Range: 0 to (232-1) |
2 |
Out of Frames |
— |
— |
Provides a count of the out of frames. Range: 0 to (232-1) |
3 |
Losses of Signal |
— |
— |
Provides a count of the signal losses. Range: 0 to (232-1) |
4 |
Frame Bit Errors |
— |
— |
Provides a count of the frame bit errors. Range: 0 to (232-1) |
5 |
CRC Errors |
— |
— |
Provides a count of the cyclic redundancy check (CRC) errors. Range: 0 to (232-1) |
6 |
Out of Multi-Frames |
— |
— |
Provides a count of the out of multiframes. Range: 0 to (232-1) |
7 |
All Ones in Timeslot Sixteen |
— |
— |
Provides a count of the all ones in timeslot 16. Range: 0 to (232-1) |
221 |
E-bit errors |
— |
— |
Provides a count of the E-bit errors. Range: 0 to (232-1) |
222 |
Line code violations |
— |
— |
Provides a count of the line code violations. Range: 0 to (232-1) |
BXM and ASI Service Line
This section provides information about the statistics contained in the ASI Line group. The BXM and ASI service line statistics in this group are applicable to Switch Software Releases 9.2 and 9.3 on the BPX switch.
The following table lists the attributes that are common to the BXM and ASI service line statistics.
Front Cards |
BXM T3/E3, BXM-155, BXM-622 ASI-T3/E3, ASI-155, ASI-155e |
Back Cards |
BXM - BPX-T3/E3-BC, MMF-155-4/8, SMF-155-4/8 SMFLR-155-4/8, SMF-622-2, SMFLR-622-2, SMFXLR-622-2, SMF-622, SMFLR-622, SMFXLR-622 ASI - LM-3T3/3E3, LM-2OC-3-SMF, LM-2OC-3-SMFLR, LM-2OC-3-MMF |
Object Type |
1 |
Subobject Type |
2 |
Default Peak Interval |
60 seconds (fixed setting) |
The BXM and ASI service line statistics are primarily used for gathering billing and performance data.
The following table includes the description of each statistic and the point during the data flow at which the statistic gathers the appropriate information. Each measurement point refers to the corresponding point in Figure 4-1.
|
Stat ID
|
BXM and ASI Service Line Statistics
|
Subset of Other Stats
|
Ingress/Egress Measurement Point
|
Description
|
28 |
B3ZS Line Code Violations |
No |
Ingress-1 |
Provides a count of the B3ZS line code violations that are encountered by the interface. These violations occur when more than three zeroes in a row are transmitted. Range: 0 to (232-1) |
29 |
Line Errored Seconds |
No |
Ingress-1 |
Provides a count of the line code violation errored seconds that occur within the collection interval. Range: 0 to (232-1) |
30 |
Line Severely Errored Seconds |
Line Errored Seconds |
Ingress-1 |
Provides a count of the line code violation severely errored seconds (SES) that occur within the collection interval. Severely errored seconds are classified as errored seconds that are greater than the total line bits per second multiplied by 10-6. Range: 0 to (232-1) |
31 |
P-bit Line Parity Errors |
No |
Ingress-1 |
Provides a count of the parity bit (P-bit) code violations that are encountered by the interface. Range: 0 to (232-1) |
32 |
Errored Seconds - Parity |
No |
Ingress-1 |
Provides a count of the parity code violation (PCV) errored seconds that occur within the collection interval. Range: 0 to (232-1) |
33 |
Severely Errored Seconds - Parity |
Errored Seconds-Parity |
Ingress-1 |
Provides a count of the P-bit code SES violations that occur within the collection interval. Range: 0 to (232-1) |
34 |
C-bit Parity Code Violations |
No |
Ingress-1 |
Provides a count of the C-bit code violations that are encountered by the interface. Range: 0 to (232-1) |
35 |
Errored Seconds - Path |
No |
Ingress-1 |
Provides a count of the PCV errored seconds that occur within the collection interval. Range: 0 to (232-1) |
36 |
Severely Errored Seconds - Path |
Errored Seconds-Path |
Ingress-1 |
Provides a count of the PCV severely errored seconds that occur within the collection interval. Range: 0 to (232-1) |
37 |
Severely Errored Framing Seconds |
No |
Ingress-1 |
Provides a count of the severely errored framing seconds that occur within the collection interval. Range: 0 to (232-1) |
39 |
Unavailable Seconds |
No |
Ingress-1 |
Provides a count of the unavailable seconds that occur within the collection interval. Range: 0 to (232-1) |
40 |
PLCP BIP-8 Errors |
— |
— |
Provides a count of the internal BPX errors. Range: 0 to (232-1) |
41 |
BIP-8 Errored Seconds |
— |
— |
Provides a count of the internal BPX errored seconds. Range: 0 to (232-1) |
42 |
BIP-8 Severely Errored Seconds |
— |
— |
Provides a count of the internal BPX severely errored seconds. Range: 0 to (232-1) |
43 |
PLCP Severely Err Framing Secs |
— |
— |
Provides a count of the severely errored seconds based on PLCP framing errors. Range: 0 to (232-1) |
44 |
PLCP Unavailable Seconds |
— |
— |
Provides a count of the internal BPX unavailable seconds. Range: 0 to (232-1) |
45 |
HCS Errors |
— |
— |
Provides a count of the header check sum errors. Range: 0 to (232-1) |
97 |
PLCP OOF Transition Counts |
No |
Ingress-1 |
Provides a count of the times the OOF is detected by the physical layer convergence protocol (PLCP) interface. Range: 0 to (232-1) |
142 |
PLCP FEBE Err Secs |
No |
Ingress-1 |
Provides a count of the FEBE seconds that occur within the collection interval. Range: 0 to (232-1) |
143 |
PLCP FEBE Severely Err Secs |
PLCP FEBE Err Secs |
Ingress-1 |
Provides a count of the FEBE severely errored seconds that occur within the collection interval. Range: 0 to (232-1) |
144 |
PLCP FEBE Counts |
No |
Ingress-1 |
Provides a count of the FEBEs that are encountered by the PLCP interface. Range: 0 to (232-1) |
145 |
PLCP FE Counts |
— |
— |
Provides a count of the PLCP fast Ethernet (FE). Range: 0 to (232-1) |
146 |
HCS Errored Seconds |
— |
— |
Provides a count of the HCS errored seconds. Range: 0 to (232-1) |
147 |
HCS Severely Errored Seconds |
— |
— |
Provides a count of the HCS severely errored seconds. Range: 0 to (232-1) |
150 |
YEL Transitions |
No |
Ingress-1 |
Provides a count of the times yellow alarms are detected. The count includes the number of remote alarm indicator (RAI) alarms. Range: 0 to (232-1) |
151 |
PLCP Yellow Transition Counts |
— |
— |
Provides a count of the number of times PLCP yellow defects are detected. Range: 0 to (232-1) |
152 |
Alarm Indication Signal |
— |
— |
Provides a count of the times that an alarm indication signal is detected. Range: 0 to (232-1) |
169 |
Loss of Cell Delineation |
— |
— |
Provides a count of the loss of cell delineation defect states. Range: 0 to (232-1) |
170 |
Loss of Pointer |
— |
— |
Provides a count of the loss of pointer (LOP) defect states. Range: 0 to (232-1) |
171 |
OC3 Path AIS |
— |
— |
Provides a count of the AIS instances on the path. Range: 0 to (232-1) |
172 |
OC3 Path YEL |
— |
— |
Provides a count of the times yellow alarms are detected on the path. Range: 0 to (232-1) |
173 |
Section BIP8 |
— |
— |
Provides a count of the section BIP-8 errors. Range: 0 to (232-1) |
174 |
Line BIP24 |
— |
— |
Provides a count of the line BIP-24 errors. Range: 0 to (232-1) |
175 |
Line FEBE |
— |
— |
Provides a count of the line far-end block errors (FEBE). Range: 0 to (232-1) |
176 |
Path BIP8 |
— |
— |
Provides a count of the path BIP-8 errors. Range: 0 to (232-1) |
177 |
Path FEBE |
— |
— |
Provides a count of the instances of path FEBE. Range: 0 to (232-1) |
178 |
Section BIP8 Err Secs |
— |
— |
Provides a count of the seconds that have at least one section BIP-8 error occurring within the collection interval. The counter also increments during severely errored framing (SEF) or LOS failure events. Range: 0 to (232-1) |
179 |
Line BIP24 Err Secs |
— |
— |
Provides a count of the seconds that have at least one line BIP-24 error occurring within the collection interval. The counter also increments during detection of line alarm indication signals. Range: 0 to (232-1) |
180 |
Line FEBE Err Secs |
— |
— |
Provides a count of the seconds that have at least one line FEBE. The counter also increments during line remote defect identifications (RDIs). Range: 0 to (232-1) |
181 |
Path BIP8 Err Secs |
— |
— |
Provides a count of the seconds that have at least one path BIP-8 error. The counter also increments during detection of LOP and AIS events. Range: 0 to (232-1) |
182 |
Path FEBE Err Secs |
— |
— |
Provides a count of the seconds that have at least one instance of path FEBE. The counter also increments during detection of RDI events. Range: 0 to (232-1) |
183 |
Section BIP8 Severely Err Secs |
— |
— |
Provides a count of the section BIP-8 SESs that occur within the collection interval SESs are classified as at least 2500 instances (for OC3 lines) of section BIP-8 errored seconds. The counter also increments during SEF and LOS failure events. Range: 0 to (232-1) |
184 |
Section Sev Err Framing Secs |
— |
— |
Provides a count of the section seconds that have at least 2500 instances (for OC3 lines) of out of frame (OOF). Range: 0 to (232-1) |
185 |
Line BIP24 Severely Err Secs |
— |
— |
Provides a count of the BIP-24 severely errored seconds (SESs) that occur within the collection interval. SESs are classified as at least 2500 instances (for OC3 lines) of line BIP-24 errored seconds. The counter also increments during detection of line alarm indication signals. Range: 0 to (232-1) |
186 |
Line FEBE Severely Err Secs |
— |
— |
Provides a count of the FEBE SESs. SESs are classified as at least 2500 instances (for OC3 lines) of line FEBE. The counter also increments during line RDIs. Range: 0 to (232-1) |
187 |
Path BIP8 Severely Err Secs |
— |
— |
Provides a count of the BIP-8 SESs that occur within the collection interval. SESs are classified as at least 2400 instances of path BIP-8 errored seconds. The counter also increments during detection of LOP and AIS events. Range: 0 to (232-1) |
188 |
Path FEBE Severely Err Secs |
— |
— |
Provides a count of the FEBE SESs. SESs are at least 2400 instances of path FEBEs. The counter also increments during detection of RDI events. Range: 0 to (232-1) |
189 |
Line Unavailable Secs |
— |
— |
Provides a count of the seconds that the line is unavailable after the occurrence of 10 contiguous line SESs. Range: 0 to (232-1) |
190 |
Line Farend Unavailable Secs |
— |
— |
Provides a count of the far end unavailable seconds (UAS). UAS are defined as 10 contiguous severely errored seconds. Range: 0 to (232-1) |
191 |
Path Unavailable Secs |
— |
— |
Provides a count of the seconds that the line is unavailable after the occurrence of 10 contiguous path SESs. Range: 0 to (232-1) |
192 |
Path Farend Unavailable Secs |
— |
— |
Provides a count of the seconds that the line is unavailable after the occurrence of 10 contiguous path far end SESs. Range: 0 to (232-1) |
193 |
HCS Correctable Error |
— |
— |
Provides a count of the header checksum errors (HCS) that are corrected. Range: 0 to (232-1) |
194 |
HCS Correctable Error Err Secs |
— |
— |
Provides a count of the cell header checksum errored seconds that occur within the collection interval. Range: 0 to (232-1) |
195 |
HCS Correctable Error SevErr Secs |
— |
— |
Provides a count of the cell header checksum severely errored seconds that occur within the collection interval. Range: 0 to (232-1) |
196 |
Transmit NTS Cells Discarded |
— |
— |
Provides a count of the non-time-stamped cells that are discarded before being added to the transmit queue. These cells are discarded due to errors within the cells. Range: 0 to (232-1) |
197 |
Transmit HP Cells Discarded |
— |
— |
Provides a count of high priority (HP) cells that are discarded in the transmit direction. High priority cells include OAM and RM traffic. Range: 0 to (224-1) |
198 |
Transmit Voice Cells Discarded |
— |
— |
Provides a count of voice cells that are discarded in the transmit direction. Range: 0 to (224-1) |
199 |
Transmit TS Cells Discarded |
— |
— |
Provides a count of time-stamped cells that are discarded in the transmit direction. Range: 0 to (224-1) |
200 |
Transmit BData A Cells Discarded |
— |
— |
Provides a count of bursty data A cells that are discarded in the transmit direction. Range: 0 to (224-1) |
201 |
Transmit BData B Cells Discarded |
— |
— |
Provides a count of bursty data B cells that are discarded in the transmit direction. Range: 0 to (224-1) |
202 |
Transmit CBR Cells Discarded |
— |
— |
Provides a count of CBR cells that are discarded in the transmit direction. Range: 0 to (224-1) |
203 |
Transmit ABR Cells Discarded |
— |
— |
Provides a count of ABR cells that are discarded in the transmit direction. Range: 0 to (224-1) |
204 |
Transmit VBR Cells Discarded |
— |
— |
Provides a count of non-real-time VBR cells that are discarded in the transmit direction. Range: 0 to (224-1) |
205 |
Egress NTS Cells Rx |
— |
— |
Provides a count of non-time-stamped cells that are received from the bus. Range: 0 to (224-1) |
206 |
Egress HP Cells Rx |
— |
— |
Provides a count of high priority cells (congestion control traffic) received in the egress direction. High priority cells include OAM and RM traffic. Range: 0 to (224-1) |
207 |
Egress Voice Cells Rx |
— |
— |
Provides a count of voice cells that are received from the bus. Range: 0 to (224-1) |
208 |
Egress TS Cells Rx |
— |
— |
Provides a count of time-stamped cells that are received from the bus. Range: 0 to (224-1) |
209 |
Egress BData A Cells Rx |
— |
— |
Provides a count of the bursty data A cells that are received by the Qbin in the transmit direction. Range: 0 to (224-1) |
210 |
Egress BData B Cells Rx |
— |
— |
Provides a count of the bursty data B cells that are received by the Qbin in the transmit direction. Range: 0 to (224-1) |
211 |
Egress CBR Cells Rx |
— |
— |
Provides a count of the CBR cells that are received by the Qbin in the transmit direction. Range: 0 to (224-1) |
212 |
Egress ABR Cells Rx |
— |
— |
Provides a count of the ABR cells that are received by the Qbin in the transmit direction. Range: 0 to (224-1) |
213 |
Egress VBR Cells Rx |
— |
— |
Provides a count of non-real-time VBR cells that are received from the bus. Range: 0 to (224-1) |
CESM and FRSM E1/T1 Service Line
This section provides information about the statistics contained in the MGX-E1/T1 group. The CESM and FRSM service line statistics are applicable to the MGX 8230, MGX 8250, MGX 8850 Release 1 nodes.
The following table lists the attributes that are common to all of the CESM and FRSM MGX E1/T1 service line statistics.
Front Cards |
AX-CESM-8T1, AX-CESM-8E1, MGX-CESM-T3, MGX-CESM-E3 FRSM-8T1, FRSM-8E1, FRSM-2CT3, FRSM-2T3, FRSM-2E3, FRSM-HS2, FRSM-HS1 |
Back Cards |
RJ48-8T1, RJ48-8E1, SMB-8E1, BNC-2T3, BNC-2E3, SCSC2-2HSSI |
Object Type |
1 |
Subobject Type |
3 |
Default Peak Interval |
60 seconds (fixed setting) |
The CESM and FRSM MGX E1/T1 service line statistics are primarily used for gathering billing and performance data.
The following table includes the description of each statistic and the point during the data flow at which the statistic gathers the appropriate information. Each measurement point refers to the corresponding point in Figure 4-1.
|
Stat ID
|
CESM and FRSM E1/T1 Service Line Statistics
|
Subset of Other Stats
|
Ingress/Egress Measurement Point
|
Description
|
2 |
Out of Frames |
No |
Ingress-1 |
Provides a count of the times an out of frame (OOF) is detected. The count includes the number of OOF alarms. Range: 0 to (232-1) |
3 |
Losses of Signal |
No |
Ingress-1 |
Provides a count of the times a loss of signal (LOS) is detected. The count includes the number of LOS alarms. Range: 0 to (232-1) |
4 |
Frame Bit Errors |
— |
— |
Provides a count of the frame bit errors. Range: 0 to (232-1) |
5 |
ACP Cells Received |
No |
Not applicable |
Provides a count of the ATM control protocol (ACP) cells that are received from the line for an IMA group. Range: 0 to (232-1) |
6 |
ACP Cells Transmitted |
No |
Not applicable |
Provides a count of the total ACP cells that are transmitted to the line for an IMA group. Range: 0 to (232-1) |
7 |
Number of times line dropped from port |
— |
— |
Provides a count of the times that the line is dropped from the port. Range: 0 to (232-1) |
51 |
ICP violations |
— |
— |
Provides a count of the IMA control protocol (ICP) cell violations that are received from the line. Range: 0 to (232-1) |
52 |
Near-end Severely Errored Seconds |
— |
Ingress-1 |
Provides a count of the line code violation severely errored seconds (SES) that occur at the near end line. Severely errored seconds are classified as errored seconds that are greater than the total line bits per second multiplied by 10-6. Range: 0 to (232-1) |
53 |
Near-end Tx Unusable Seconds |
— |
— |
Provides a count of the seconds that the near end is not transmitting. Range: 0 to (232-1) |
54 |
Near-end Rx Unusable Seconds |
— |
— |
Provides a count of the seconds that the near end is not receiving. Range: 0 to (232-1) |
55 |
Near-end Tx Failure Alarms |
— |
— |
Provides a count of the failure alarms transmitted by the near end. Range: 0 to (232-1) |
56 |
Near-end Rx Failure Alarms |
— |
— |
Provides a count of the failure alarms that are received by the near end. Range: 0 to (232-1) |
57 |
Near-end Unavailable Seconds |
No |
Ingress-1 |
Provides a count of the unavailable seconds that occur within the collection interval at the near end of the line. Range: 0 to (232-1) |
AUSM Service
This section provides information about the statistics contained in the MGX_ATM group. The statistics in this group are applicable to the AUSM card on the MGX 8220, MGX 8230, MGX 8250, and MGX 8850 Release 1 nodes.
The following table lists the attributes that are common to the AUSM service statistics.
Front Cards |
AUSM-8T1E1 Revision B |
Back Cards |
LM-RJ48-8T1/LM-RJ48-8E1, OC-3, OC-121 |
Object Type |
1 (Interface Service) |
Subobject Type |
4 |
Default Peak Interval |
60 seconds (fixed setting) |
The AUSM service statistics are primarily used for gathering billing and performance data.
The following table includes the description of each statistic and the point during the data flow at which the statistic gathers the appropriate information. Each measurement point refers to the corresponding point in Figure 4-1.
|
Stat ID
|
AUSM Service Statistics
|
Subset of Other Stats
|
Ingress/Egress Measurement Point
|
Description
|
1 |
T3/E3 Cells Rx |
No |
Ingress-1 |
Provides a count of the total cells that are received. Range: 0 to (232-1) |
2 |
T3/E3 Cells Tx |
No |
Egress-13 |
Provides a count of the total cells that are transmitted. Range: 0 to (232-1) |
3 |
T3/E3 Invalid Cells Rx |
T3/E3/ Cells Rx |
Ingress-1 |
Provides a count of the invalid cells that are received. Range: 0 to (232-1) |
45 |
ATM Cell Header HEC Errors |
T3/E3 Cells Rx |
Ingress-1 |
Provides a count of the cells with header error control (HEC) errors. Range: 0 to (232-1) |
146 |
ATM HEC Errored Seconds |
No |
Ingress-1 |
Provides a count of the HEC errored seconds that occur within the collection interval. Range: 0 to (232-1) |
147 |
ATM HEC Severely Errored Seconds |
ATM HEC Errored Seconds |
Ingress-1 |
Provides a count of the HEC severely errored seconds that occur within the collection interval. Severely errored seconds are classified as errored seconds that are greater than the total line bits per second multiplied by 10-6. Range: 0 to (232-1) |
CESM, FRSM, SRM, and SRME T3/E3 Service
This section provides information about the statistics contained in the MGX-T3/E3 group. The CESM, FRSM, SRM, and SRME T3/E3 service line statistics are applicable to the MGX 8230, MGX 8250, MGX 8850 Release 1 nodes.
The following table lists the attributes that are common to all of the CESM, FRSM, SRM, and SRME T3/E3 service line statistics.
Front Cards |
AX-CESM-8T1, AX-CESM-8E1, MGX-CESM-T3, MGX-CESM-E3, FRSM-8T1, FRSM-8E1, FRSM-2CT3, FRSM-2T3, FRSM-2E3, FRSM-HS2, FRSM-HS1, SRM-3T3, SRME-3T3 |
Back Cards |
RJ48-8T1, RJ48-8E1, SMB-8E1, BNC-2T3, BNC-2E3, SCSC2-2HSSI |
Object Type |
1 |
Subobject Type |
6 |
Default Peak Interval |
60 seconds (fixed setting) |
The CESM, FRSM, SRM, and SRME T3/E3 service line statistics are primarily used for gathering billing and performance
The following table includes the description of each statistic and the point during the data flow at which the statistic gathers the appropriate information. Each measurement point refers to the corresponding point in Figure 4-1.
|
Stat ID
|
CESM, FRSM, SRM, and SRME T3/E3 Service Line Statistics
|
Subset of Other Stats
|
Ingress/Egress Measurement Point
|
Description
|
2 |
Out of Frames |
No |
Ingress-1 |
Provides a count of the times an out of frame (OOF) is detected. The count includes the number of OOF alarms. Range: 0 to (232-1) |
3 |
Losses of Signal |
No |
Ingress-1 |
Provides a count of the times a loss of signal (LOS) is detected. The count includes the number of LOS alarms. Range: 0 to (232-1) |
28 |
B3ZS Line Code Violations |
No |
Ingress-1 |
Provides a count of the B3ZS line code violations that are encountered by the interface. These violations occur when more than three zeroes in a row are transmitted. Range: 0 to (232-1) |
29 |
Line Errored Seconds |
No |
Ingress-1 |
Provides a count of the line code violation errored seconds that occur within the collection interval. Range: 0 to (232-1) |
30 |
Line Severely Errored Seconds |
Line Errored Seconds |
Ingress-1 |
Provides a count of the line code violation severely errored seconds (SES) that occur within the collection interval. Severely errored seconds are classified as errored seconds that are greater than the total line bits per second multiplied by 10-6. Range: 0 to (232-1) |
31 |
P-bit Line Parity Errors |
No |
Ingress-1 |
Provides a count of the parity bit (P-bit) code violations that are encountered by the interface. Range: 0 to (232-1) |
32 |
Errored Seconds-Parity |
No |
Ingress-1 |
Provides a count of the parity code violation (PCV) errored seconds that occur within the collection interval. Range: 0 to (232-1) |
33 |
Severely Errored Seconds- Parity |
Errored Seconds-Parity |
Ingress-1 |
Provides a count of the P-bit code SES violations that occur within the collection interval. Range: 0 to (232-1) |
34 |
C-bit Parity Code Violations |
No |
Ingress-1 |
Provides a count of the C Bit code violations that are encountered by the interface. Range: 0 to (232-1) |
35 |
Errored Seconds-Path |
No |
Ingress-1 |
Provides a count of the PCV errored seconds that occur within the collection interval. Range: 0 to (232-1) |
36 |
Severely Errored Seconds- Path |
Errored Seconds-Path |
Ingress-1 |
Provides a count of the PCV severely errored seconds that occur within the collection interval. Range: 0 to (232-1) |
37 |
Severely Errored Framing Seconds |
No |
Ingress-1 |
Provides a count of the severely errored framing seconds that occur within the collection interval. Range: 0 to (232-1) |
38 |
Alarm Indication Signal Seconds |
No |
Ingress-1 |
Provides a count of the alarm seconds that occur within the collection interval. Range: 0 to (232-1) |
39 |
Unavailable Seconds |
No |
Ingress-1 |
Provides a count of the unavailable seconds that occur within the collection interval. Range: 0 to (232-1) |
144 |
FEBE Counts |
No |
Ingress-1 |
Provides a count of the far end block errors (FEBEs) that are detected. Range: 0 to (232-1) |
145 |
FE Counts |
No |
Ingress-1 |
Provides a count of the framing pattern errors that are encountered by a DS3/E3 interface. Range: 0 to (232-1) |
150 |
YEL Transitions |
No |
Ingress-1 |
Provides a count of the times yellow alarms are detected. The count includes the number of remote alarm indicator (RAI) alarms. Range: 0 to (232-1) |
220 |
Excessive Zero Counts |
No |
Ingress-1 |
Provides a count of the excessive zero bits that are encountered by the interface. Excessive zeros are three or more zeros occurring on the line. Range: 0 to (232-1) |
221 |
PLCP OOF Transition Counts |
No |
Ingress-1 |
Provides a count of the times the OOF is detected by the physical layer convergence protocol (PLCP) interface. Range: 0 to (232-1) |
222 |
PLCP Remote Alarm Indication |
No |
Ingress-1 |
Provides a count of the remote alarms that are detected by the PLCP interface. Range: 0 to (232-1) |
223 |
PLCP Framing Errors |
No |
Ingress-1 |
Provides a count of the framing errors that are detected by the PLCP interface. Range: 0 to (232-1) |
224 |
PLCP FEBE Counts |
No |
Ingress-1 |
Provides a count of the FEBEs that are encountered by the PLCP interface. Range: 0 to (232-1) |
225 |
PLCP FEBE Err Secs |
No |
Ingress-1 |
Provides a count of the FEBE seconds that occur within the collection interval. Range: 0 to (232-1) |
226 |
PLCP FEBE Severely Err Secs |
PLCP FEBE Err Secs |
Ingress-1 |
Provides a count of the FEBE severely errored seconds that occur within the collection interval. Range: 0 to (232-1) |
227 |
PLCP HCS Errors |
No |
Ingress-1 |
Provides a count of the cell header checksum errors that are encountered by the PLCP interface. Range: 0 to (232-1) |
228 |
PLCP HCS Errored Secs |
No |
Ingress-1 |
Provides a count of the cell header checksum errored seconds that occur within the collection interval. Range: 0 to (232-1) |
229 |
PLCP HCS Severely Errored Secs |
PLCP HCS Err Secs |
Ingress-1 |
Provides a count of the cell header checksum severely errored seconds that occur within the collection interval. Range: 0 to (232-1) |
230 |
PLCP BIP-8 Code Violations |
No |
Ingress-1 |
Provides a count of the BIP-8 code violations that are encountered by the interface. Range: 0 to (232-1) |
231 |
PLCP BIP8 CV Err Secs |
No |
Ingress-1 |
Provides a count of the BIP-8 code violation errored seconds that occur within the collection interval. Range: 0 to (232-1) |
232 |
PLCP BIP8 CV Severely Err Secs |
PLCP BIP8 CV Err Secs |
Ingress-1 |
Provides a count of the BIP-8 code violation severely errored seconds that occur within the collection interval. Range: 0 to (232-1) |
233 |
PLCP Severely Err Framing Secs |
No |
Ingress-1 |
Provides a count of the severely errored framing seconds that occur within the collection interval. Range: 0 to (232-1) |
234 |
PLCP Unavailable Secs |
No |
Ingress-1 |
Provides a count of the unavailable seconds that occur within the collection interval. Range: 0 to (232-1) |
235 |
Alarm Indication Signal Severely Seconds |
No |
Ingress-1 |
Provides a count of the alarm indication signal (AIS) severely errored seconds that occur within the collection interval. Range: 0 to (232-1) |
SRM and SRME SONET Service Line
This section provides information about the statistics contained in the SONET group. The SONET line statistics are applicable to the SRM and SRME cards on the MGX 8230, MGX8250, and MGX 8850 Release 1 nodes.
The following table lists the attributes that are common to all of the SONET line statistics.
Front Card |
SRM, SRME |
Back Card |
SRM-3T3-NOBC |
Object Type |
1 |
Subobject Type |
10 |
Default Peak Interval |
60 seconds (fixed setting) |
The SRM and SRME SONET line statistics are primarily used for gathering billing and performance data.
The following table includes the description of each statistic and the point during the data flow at which the statistic gathers the appropriate information. Each measurement point refers to the corresponding point in Figure 4-1.
|
Stat ID
|
SRM and SRME SONET Line Statistics
|
Subset of Other Stats
|
Ingress/Egress Measurement Point
|
Description
|
236 |
Sonet Loss of Signal |
— |
— |
Provides a count of the times a loss of signal (LOS) is detected. The count includes the number of LOS alarms. Range: 0 to (232-1) |
237 |
Sonet Loss of Frames |
— |
— |
Provides a count of the loss of frames (LOFs) that are encountered by a SONET line. Range: 0 to (232-1) |
238 |
Sonet Path alarm Indictn sgnl secs |
— |
— |
Provides a count of the alarm indication signal (AIS) instances on the path. Range: 0 to (232-1) |
239 |
Sonet Remote Far end Indication |
— |
— |
Provides a count of the remote failure indications (RFIs) that occur. Range: 0 to (232-1) |
240 |
Sonet Line Alarm indication signal |
— |
— |
Provides a count of the times that an alarm indication signal is detected on the line. Range: 0 to (232-1) |
241 |
Sonet Line Remote Far end Indicatn |
— |
— |
Provides a count of the remote failure indications (RFIs) that are encountered by a SONET line. Range: 0 to (232-1) |
AXSM Line
This section provides information about the ATM line statistics contained in the AXSM_ATM_line group. The AXSM ATM line statistics are applicable to the MGX 8850 Release 2 switch.
The following table lists the attributes that are common to all of the AXSM line statistics.
Front Card |
MGX-AXSM-16-T3E3, MGX-AXSM-16-155, MGX-AXSM-4-622, MGX-AXSM-1-2488 |
Back Cards |
MGX-SMB-8-T3, MGX-SMB-8-E3, MGX-SMB-4-155, MGX-SMFIR-8-155, MGX-SMFLR-8-155, MGX-MMF-8-155, MGX-SMFLR-2-622, MGX-SMFIR-2-622, MGX-SMFSR-1-2488, MGX-SMFLR-1-2488, MGX-SMFXLR-1-2488 |
Object Type |
1 |
Subobject Type |
11 |
Default Peak Interval |
300 seconds |
The AXSM line statistics are primarily used for gathering billing data.
The following table includes the description of each statistic and the point during the data flow at which the statistic gathers the appropriate information. Each measurement point refers to the corresponding point in Figure 4-1.
|
Stat ID
|
AXSM Line Statistics
|
Subset of Other Stats
|
Ingress/Egress Measurement Point
|
Description
|
0 |
Ingress CLP0 Cells From Port |
Ingress CLP0+1 Cells |
Ingress-2, 8 |
Provides a count of the ingress cells with cell loss priority (CLP) equal to 0 that are received. Range: 0 to (240-1) cells |
1 |
Ingress CLP1 Cells From Port |
Ingress CLP0+1 Cells |
Ingress-2, 8 |
Provides a count of the ingress cells with CLP equal to 1 that are received. Range: 0 to (240-1) cells |
2 |
Ingress CLP0+1 Cells From Port |
No |
Ingress-2, 8 |
Provides a count of the ingress cells with CLP (0+1) that are received. Range: 0 to (240-1) cells |
3 |
Ingress UPC CLP0 Discards |
Ingress UPC CLP0+1 Discards |
Ingress-2, 8 |
Provides a count of the total cells with CLP equal to 0 that are discarded due to usage parameter control (UPC). Range: 0 to (240-1) cells |
4 |
Ingress UPC CLP0+1 Discards |
No |
Ingress-2, 8 |
Provides a count of the total cells with CLP (0+1) that are discarded due to UPC. Range: 0 to (240-1) cells |
5 |
Ingress Non-Compliant CLP0+1 |
No |
Ingress-2, 8 |
Provides a count of the total cells with CLP (0+1) that are non-compliant or discarded due to policing. Range: 0 to (240-1) cells |
6 |
Ingress Total Valid
OAM Cells |
No |
Ingress-2, 8 |
Provides a count of the ingress operation, administration, and maintenance (OAM) cells that have a valid cell type and function type. Range: 0 to (240-1) cells |
7 |
Ingress Total Valid RM Cells |
No |
Ingress-2, 8 |
Provides a count of the ingress resource management (RM) cells that have a valid cell type and function type. Range: 0 to (240-1) cells |
8 |
Ingress Total Errored OAM/RM cells |
No |
Ingress-2, 8 |
Provides a count of the total errored OAM and RM cells in the ingress direction. The errored cells include: •OAM cells with an incorrect CRC-10 •Undefined OAM or function type •RM cells with an incorrect CRC-10 Range: 0 to (240-1) cells |
9 |
Ingress non-zero GFC cells |
No |
Ingress-2, 8 |
Provides a count of the cells with a non-zero generic flow control (GFC) field. This statistic is applicable only for UNI and ingress directions. Range: 0 to (240-1) cells |
10 |
Ingress Invalid VPI/VCI Cells |
No |
Ingress-2, 8 |
Provides a count of the ingress cells with an unassigned or invalid virtual path identifier (VPI) or virtual channel identifier (VCI). Range: 0 to (240-1) cells |
11 |
Ingress Last Unknown VPI.VCI (invalid) |
No |
Ingress-2, 8 |
Provides the last unknown VPI.VCI value on the line. Range: VPI/VCI value |
12 |
Ingress HEC Errored Cells Discarded |
Ingress Total HEC-errored Cells |
Ingress-2, 8 |
Provides a count of the header error control (HEC) errored cells that are discarded on the line. Range: 0 to (240-1) cells |
13 |
Ingress HEC Errored Cells Corrected |
Ingress Total HEC-errored Cells |
Ingress-2, 8 |
Provides a count of the HEC errored cells that are corrected on the line. Range: 0 to (240-1) cells |
14 |
Ingress Total HEC-errored cells |
No |
Ingress-2, 8 |
Provides a count of the total HEC errored cells that are received on the line. Range: 0 to (240-1) cells |
15 |
Egress CLP0 Cells to Port |
Egress CLP0+1 Cells |
Egress-7, 13 |
Provides a count of the egress cells with CLP equal to 0. Range: 0 to (240-1) cells |
16 |
Egress CLP1 Cells to Port |
Egress CLP0+1 Cells |
Egress-7, 13 |
Provides a count of the egress cells with CLP equal to 1. Range: 0 to (240-1) cells |
17 |
Egress CLP0+1 Cells to Port |
No |
Egress-7, 13 |
Provides a count of the egress cells with CLP (0+1). Range: 0 to (240-1) cells |
18 |
Egress OAM Valid cells |
No |
Egress-7, 13 |
Provides a count of the egress valid OAM cells. Range: 0 to (240-1) cells |
19 |
Egress RM Valid Cells |
No |
Egress-7, 13 |
Provides a count of the egress RM valid cells. Range: 0 to (240-1) cells |
20 |
Egress OAM/RM Errored Cells |
No |
Egress-7, 13 |
Provides a count of the errored OAM and RM cells in the egress direction. The errored cells include: •OAM cells with an incorrect CRC-10 •Undefined OAM type or function type •RM cells with an incorrect CRC-10 Range: 0 to (240-1) cells |
21 |
Egress Invalid VPI/VCI Cells |
No |
Egress-7, 13 |
Provides a count of the egress cells with errored headers. This count includes cells with an unassigned or invalid VPI or VCI. Range: 0 to (240-1) cells |
AXSM-E Line
This section provides information about the ATM statistics contained in the AXSME_ATM_line group. The AXSM-E line statistics in this group are applicable to the MGX 8850 Release 2 switch.
The following table lists the attributes that are common to the AXSM-E line statistics.
Front Cards |
AXSM-2-622-E, AXSM-8-155-E, AXSM-16-T3E3-E |
Back Cards |
SMFLR-1-622, SMFIR-1-622, SMFLR-4-155, SMFIR-4-155, MMF-4-155, SMB-4-155, SMB-8-T3, SMB-8-E3 |
Object Type |
1 |
Subobject Type |
12 |
Allowable Peak Intervals |
60 seconds, 300 seconds |
Default Peak Interval |
300 seconds |
The AXSM-E line statistics are primarily used for gathering troubleshooting and performance data.
The tables in this section include the description of each statistic and the point during the data flow at which the statistic gathers the appropriate information. Each measurement point refers to the corresponding point in Figure 4-1.
Note AXSM-E statistics are only collected at measurement points 1, 2, and 13.
|
Stat ID
|
AXSM-E Line Statistics
|
Subset of Other Stats
|
Ingress/Egress Measurement Point
|
Description
|
0 |
Ingress CLP0 cells received |
Cells received |
Ingress-1 |
Provides a count of the ingress cells with cell loss priority (CLP) equal to 0 that are received. Range: 0 to (240-1) cells |
1 |
Ingress CLP1 cells received |
Cells received |
Ingress-1 |
Provides a count of the ingress cells with CLP equal to 1 that are received. Range: 0 to (240-1) cells |
2 |
Ingress valid OAM cells received |
No |
Ingress-1 |
Provides a count of the operation, administration, and maintenance (OAM) that are received at the port. Range: 0 to (240-1) cells |
3 |
Ingress valid RM cells received |
No |
Ingress-1 |
Provides a count of the resource management (RM) cells that are received at the port. Range: 0 to (240-1) cells |
4 |
UNI only cells received |
No |
Ingress-1 |
Provides a count of the cells tagged as UNI. These cells are received at the port. Range: 0 to (240-1) cells |
5 |
Error OAM cells received |
No |
Ingress-1 |
Provides a count of the errored OAM cells that are received. The errored cells include: •OAM cells with an incorrect CRC-10 •Undefined OAM type or function type Range: 0 to (240-1) cells |
6 |
Ingress cells received with header error |
No |
Before-1 |
Provides a count of the total cells with a header error. These cells are received at the port. Range: 0 to (240-1) cells |
7 |
Egress CLP0 cells received |
Cells transmitted |
After 13 |
Provides a count of the cells with CLP equal to 0 that are received at the port in the egress direction. Range: 0 to (240-1) cells |
8 |
Egress CLP1 cells received |
Cells transmitted |
After 13 |
Provides a count of the cells with CLP equal to 1 that are received at the port in the egress direction. Range: 0 to (240-1) cells |
9 |
Egress valid OAM cells received |
Cells transmitted |
After 13 |
Provides a count of the OAM cells that are received at the port in the egress direction. Range: 0 to (240-1) cells |
10 |
Egress valid RM cells received |
Cells transmitted |
After 13 |
Provides a count of the RM cells that are received at the port in the egress direction. Range: 0 to (240-1) cells |
11 |
Egress OAM cells received with errors |
No |
After-13 |
Provides a count of the errored OAM cells that are received at the port in the egress direction. The errored cells include: •OAM cells with an incorrect CRC-10 •Undefined OAM type or function type Range: 0 to (240-1) cells |
12 |
Uncorrectable header errors |
No |
Before 1 |
Provides a count of the cells that are discarded due to uncorrectable header errors. Range: 0 to (240-1) cells |
13 |
Corrected header errors |
No |
Before 1 |
Provides a count of the cells with header errors that are corrected. Range: 0 to (240-1) cells |
14 |
Idle/unassigned cells |
No |
Before 1 |
Provides a count of the idles or unassigned cells that are received. Range: 0 to (240-1) cells |
15 |
Cells received |
No |
Ingress-1 |
Provides a count of the total cells that are received at the port. Range: 0 to (240-1) cells |
16 |
Cells transmitted |
No |
After 13 |
Provides a count of the total cells that are transmitted. Range: 0 to (240-1) cells |
PXM1E Service Line
This section provides information about the statistics contained in the PXM1E group. The PXM1E connection statistics in this group are applicable to the MGX 8830 and MGX 8850 nodes.
The following table lists the attributes that are common to the PXM1E service line statistics.
Front Cards |
PXM1E-8-T3E3, PXM1E-8-155, PXM1E-2-622, PXM1E-T3E3-155 (combo card) |
Back Cards |
MGX-SMB-8T3, MGX-SMB-8E3, MGX-SMFIR-8-155LC/B, MGX-SMFLR-8-155LC/B, MGB-MMF-8-155/B, MGX-SMFIR-8-155LC/C, MGX-SMFLR-8-155LC/C, MGB-MMF-8-155/C, MGX-SMFIR-2-622/B, MGX-SMFLR-2-622/B, MGX-SMFIR-2-622/C, MGX-SMFLR-2-622/C, MGX-FRU-T3E3-155 |
Object Type |
1 |
Subobject Type |
13 |
Allowable Peak Intervals |
60 seconds, 300 seconds |
Default Peak Interval |
300 seconds |
The PXM1E service line statistics are primarily used for gathering troubleshooting and performance data.
The tables in this section include the description of each statistic and the point during the data flow at which the statistic gathers the appropriate information. Each measurement point refers to the corresponding point in Figure 4-1.
|
Stat ID
|
PXM1E Line Statistics
|
Subset of Other Stats
|
Ingress/Egress Measurement Point
|
Description
|
0 |
CLP0 Cells before Policing (Ingress) |
No |
Ingress-2, 8 |
Provides a count of the ingress cells with cell loss priority (CLP) equal to 0 that are received prior to policing. Range: 0 to (240-1) cells |
1 |
CLP1 Cells before Policing (Ingress) |
No |
Ingress-2, 8 |
Provides a count of the ingress cells with CLP equal to 1 that are received prior to policing. Range: 0 to (240-1) cells |
2 |
Total Valid OAM Cells (Ingress) |
No |
Ingress-2, 8 |
Provides a count of the ingress operation, administration, and maintenance (OAM) cells that have a valid cell type and function type. Range: 0 to (240-1) cells |
3 |
Total Valid RM Cells (Ingress) |
No |
Ingress-2, 8 |
Provides a count of the ingress resource management (RM) cells that have a valid cell type and function type. Range: 0 to (240-1) cells |
4 |
Non-zero GFC Cells (Ingress) |
No |
Ingress-2, 8 |
Provides a count of the cells with a non-zero generic flow control (GFC) field. This statistic is applicable only for UNI and ingress directions. Range: 0 to (240-1) cells |
5 |
Invalid OAM+RM Cells (Ingress) |
No |
Ingress-2, 8 |
Provides a count of the ingress invalid OAM and RM cells. Range: 0 to (240-1) cells |
6 |
Invalid Header Cells (Ingress) |
No |
Ingress-2, 8 |
Provides a count of the invalid header error control errored cells that are received on the line. Range: 0 to (240-1) cells |
7 |
CLP0 cells (Egress) |
Egress CLP0+1 Cells |
Egress-7, 13 |
Provides a count of the egress cells with CLP equal to 0. Range: 0 to (240-1) cells |
8 |
CLP1 cells(Egress) |
Egress CLP0+1 Cells |
Egress-7, 13 |
Provides a count of the egress cells with CLP equal to 1. Range: 0 to (240-1) cells |
9 |
Valid OAM cells (Egress) |
No |
Egress-7, 13 |
Provides a count of the egress valid OAM cells. Range: 0 to (240-1) cells |
10 |
Valid RM cells (Egress) |
No |
Egress-7, 13 |
Provides a count of the egress RM valid cells. Range: 0 to (240-1) cells |
11 |
InValid OAM cells (Egress) |
No |
Egress-7, 13 |
Provides a count of the egress invalid OAM cells. Range: 0 to (240-1) cells |
12 |
Uncorrectable Header cells (Ingress) |
No |
Ingress-2, 8 |
Provides a count of the header error control errored cells that are not corrected on the line. Range: 0 to (240-1) cells |
13 |
Corrected Header cells (Ingress) |
No |
Ingress-2, 8 |
Provides a count of the HEC errored cells that are corrected on the line. Range: 0 to (240-1) cells |
14 |
Idle cells (Ingress) |
Total cells (Ingress) |
Ingress-2, 8 |
Provides a count of the total idle cells received in the ingress direction. Range: 0 to (240-1) cells |
15 |
Total cells (Ingress) |
No |
Ingress-2, 8 |
Provides a count of the total cells received in the ingress direction. Range: 0 to (240-1) cells |
16 |
Total cells (Egress) |
No |
Egress-7, 13 |
Provides a count of the total cells received in the egress direction. Range: 0 to (240-1) cells |
Trunk Statistics
The following trunk statistics are supported in CWM Release 11:
•Narrowband ATM
•IPX ATM
•BXM and BNI ATM Trunk
•MGX Narrowband
•PXM1 and BNM ATM
•BNM SONET
•FastPAD Trunk
•UXM Trunk
Narrowband ATM
This section provides information about the statistics contained in the Narrowband group. The statistics in this group are applicable to the NTC card on the IPX switch.
The following table lists the attributes that are common to all of the narrowband ATM statistics.
Front Cards |
NTC |
Back Cards |
BC-T1/E1 |
Object Type |
2 |
Subobject Type |
0 |
Default Peak Interval |
300 seconds |
The narrowband ATM statistics are primarily used for gathering billing and performance data.
The following table includes the description of each statistic and the point during the data flow at which the statistic gathers the appropriate information. Each measurement point refers to the corresponding point in Figure 4-1.
|
Stat ID
|
Narrowband ATM Statistics
|
Subset of Other Stats
|
Ingress/Egress Measurement Point
|
Description
|
0 |
Bipolar Violations |
— |
— |
Provides a count of the bipolar violations. Range: 0 to (232-1) |
1 |
Frame Slips |
— |
— |
Provides a count of the frame slips. Range: 0 to (232-1) |
2 |
Out of Frames |
No |
Ingress-1 |
Provides a count of the times an out of frame (OOF) is detected. The count includes the number of OOF alarms. Range: 0 to (232-1) |
3 |
Losses of Signal |
No |
Ingress-1 |
Provides a count of the times a loss of signal (LOS) is detected. The count includes the number of LOS alarms. Range: 0 to (232-1) |
4 |
Frame Bit Errors |
— |
— |
Provides a count of the frame bit errors. Range: 0 to (232-1) |
5 |
CRC Errors |
— |
— |
Provides a count of the cyclic redundancy check (CRC) errors. Range: 0 to (232-1) |
8 |
Packet Out of Frames |
— |
— |
Provides a count of the out of frame packets. Range: 0 to (232-1) |
9 |
Packet CRC Errors |
No |
Ingress-1 |
Provides a count of the packets received from the CPE with an invalid cyclic redundancy check (CRC). The calculated CRC does not match the CRC provided by the CPE. Range: 0 to (232-1) |
10 |
Bad Clock Errors |
— |
— |
Provides a count of the bad clock errors. Range: 0 to (232-1) |
11 |
Voice Packets Dropped |
No |
Egress-13 |
Provides a count of the total voice packets that are dropped before transmitting onto the line. Range: 0 to (232-1) |
12 |
TS Packets Dropped |
No |
Egress-6, 7 |
Provides a count of the time-stamped packets that are dropped before the packets in the queue are transmitted. Range: 0 to (232-1) |
13 |
Non-TS Packets Dropped |
No |
Egress-6, 7 |
Provides a count of the non-time-stamped packets that are dropped before the packets in the queue are transmitted. Range: 0 to (232-1) |
14 |
PCC Packets Dropped |
— |
— |
Provides a count of the PCC packets that are dropped. Range: 0 to (232-1) |
15 |
BData A Packets Dropped |
No |
Egress-6, 7 |
Provides a count of the bursty data A packets that are dropped before the packets in the queue are transmitted. Range: 0 to (232-1) |
16 |
BData B Packets Dropped |
No |
Egress-6, 7 |
Provides a count of the bursty data B packets that are dropped before the packets in the queue are transmitted. Range: 0 to (232-1) |
17 |
Voice Packets Transmitted |
Total Packets Transmitted |
Egress-13 |
Provides a count of the total voice packets that are transmitted to the line. Range: 0 to (232-1) |
18 |
TS Packets Transmitted |
Total Packets Transmitted |
Egress-7 |
Provides a count of the packets transmitted from the time-stamped queue. Range: 0 to (232-1) |
19 |
Non-TS Packets Transmitted |
Total Packets Transmitted |
Egress-7 |
Provides a count of the packets transmitted from the non-time-stamped queue. Range: 0 to (232-1) |
20 |
PCC Packets Transmitted |
— |
— |
Provides a count of the PCC packets that are transmitted. Range: 0 to (232-1) |
21 |
BData A Packets Transmitted |
Total Packets Transmitted |
Egress-7 |
Provides a count of the packets transmitted from the bursty data A queue. Range: 0 to (232-1) |
22 |
BData B Packets Transmitted |
Total Packets Transmitted |
Egress-7 |
Provides a count of the packets transmitted from the bursty data B queue. Range: 0 to (232-1) |
23 |
Total Packets Transmitted |
No |
Egress-7, 13 |
Provides a count of the total packets that are transmitted. Range: 0 to (232-1) |
24 |
BData A CLP Packets Dropped |
No |
Egress-7, 13 |
Provides a count of the bursty data A packets with cell loss priority (CLP) equal to 1 that are dropped. These packets are dropped before transmitting onto the line. Range: 0 to (232-1) |
25 |
BData B CLP Packets Dropped |
No |
Egress-7, 13 |
Provides a count of the bursty data B packets with CLP equal to 1 that are dropped. These packets are dropped before transmitting onto the line. Range: 0 to (232-1) |
26 |
BData A EFCN Packets Transmitted |
Total Packets Transmitted |
Egress-13 |
Provides a count of the bursty data A packets with an explicit forward congestion notification (EFCN) bit equal to 1 that are transmitted to the port. This statistic is collected after the packets are received from the bus and have passed egress queuing and servicing. Range: 0 to (232-1) |
27 |
BData B EFCN Packets Transmitted |
Total Packets Transmitted |
Egress-13 |
Provides a count of the bursty data B packets with an EFCN bit equal to 1 that are transmitted to the port. This statistic is collected after the packets are received from the bus and have passed egress queuing and servicing. Range: 0 to (232-1) |
148 |
BDataA CLP Packets Transmitted |
No |
Egress-7, 13 |
Provides a count of the bursty data A packets with CLP equal to 1 that are transmitted from the queue. Range: 0 to (232-1) |
149 |
BDataB CLP Packets Transmitted |
No |
Egress-7, 13 |
Provides a count of the bursty data B packets with CLP equal to 1 that are transmitted from the queue. Range: 0 to (232-1) |
IPX ATM
This section provides information about the statistics contained in the IPX_ATM group. The statistics in this group are applicable to the IPX switch.
The following table lists the attributes that are common to all of the IPX ATM statistics.
Front Card |
BTM |
Back Cards |
AIT-E2, AIT-E3 |
Object Type |
2 |
Subobject Type |
1 |
Default Peak Interval |
300 seconds |
The IPX ATM statistics are primarily used for gathering billing and performance data.
The following table includes the description of each statistic and the point during the data flow at which the statistic gathers the appropriate information. Each measurement point refers to the corresponding point in Figure 4-1.
|
Stat ID
|
IPX ATM Statistics
|
Subset of Other Stats
|
Ingress/Egress Measurement Point
|
Description
|
2 |
Out of Frames |
No |
Ingress-1 |
Provides a count of the times an out of frame (OOF) is detected. The count includes the number of OOF alarms. Range: 0 to (232-1) |
3 |
Losses of Signal |
No |
Ingress-1 |
Provides a count of the times a loss of signal (LOS) is detected. The count includes the number of LOS alarms. Range: 0 to (232-1) |
9 |
Packet CRC Errors |
No |
Ingress-1 |
Provides a count of the packets received from the CPE with an invalid cyclic redundancy check (CRC). The calculated CRC does not match the CRC provided by the CPE. Range: 0 to (232-1) |
11 |
Voice Packets Dropped |
No |
Egress-13 |
Provides a count of the total voice packets that are dropped before transmitting onto the line. Range: 0 to (232-1) |
12 |
TS Packets Dropped |
No |
Egress-6, 7 |
Provides a count of the time-stamped packets that are dropped before the packets in the queue are transmitted. Range: 0 to (232-1) |
13 |
Non-TS Packets Dropped |
No |
Egress-6, 7 |
Provides a count of the non-time-stamped packets that are dropped before the packets in the queue are transmitted. Range: 0 to (232-1) |
14 |
High Priority Packets Dropped |
No |
Egress-6, 7 |
Provides a count of the high priority packets that are dropped before the packets in the queue are transmitted. Range: 0 to (232-1) |
15 |
BData A Packets Dropped |
No |
Egress-6, 7 |
Provides a count of the bursty data A packets that are dropped before the packets in the queue are transmitted. Range: 0 to (232-1) |
16 |
BData B Packets Dropped |
No |
Egress-6, 7 |
Provides a count of the bursty data B packets that are dropped before the packets in the queue are transmitted. Range: 0 to (232-1) |
17 |
Voice Packets Transmitted |
Total Packets Transmitted |
Egress-13 |
Provides a count of the total voice packets that are transmitted to the line. Range: 0 to (232-1) |
18 |
TS Packets Transmitted |
Total Packets Transmitted |
Egress-7 |
Provides a count of the packets transmitted from the time-stamped queue. Range: 0 to (232-1) |
19 |
Non-TS Packets Transmitted |
Total Packets Transmitted |
Egress-7 |
Provides a count of the packets transmitted from the non-time-stamped queue. Range: 0 to (232-1) |
20 |
High Priority Packets Transmitted |
Total Packets Transmitted |
Egress-7 |
Provides a count of the packets transmitted from the high priority queue. Range: 0 to (232-1) |
21 |
BData A Packets Transmitted |
Total Packets Transmitted |
Egress-7 |
Provides a count of the packets transmitted from the bursty data A queue. Range: 0 to (232-1) |
22 |
BData B Packets Transmitted |
Total Packets Transmitted |
Egress-7 |
Provides a count of the packets transmitted from the bursty data B queue. Range: 0 to (232-1) |
23 |
Total Packets Transmitted |
No |
Egress-7, 13 |
Provides a count of the total packets that are transmitted. Range: 0 to (232-1) |
24 |
BData A CLP Packets Dropped |
No |
Egress-7, 13 |
Provides a count of the bursty data A packets with cell loss priority (CLP) equal to 1 that are dropped. These packets are dropped before transmitting onto the line. Range: 0 to (232-1) |
25 |
BData B CLP Packets Dropped |
No |
Egress-7, 13 |
Provides a count of the bursty data B packets with CLP equal to 1 that are dropped. These packets are dropped before transmitting onto the line. Range: 0 to (232-1) |
26 |
BData A EFCN Packets Transmitted |
Total Packets Transmitted |
Egress-13 |
Provides a count of the bursty data A packets with an explicit forward congestion notification (EFCN) bit equal to 1 that are transmitted to the port. This statistic is collected after the packets are received from the bus and have passed egress queuing and servicing. Range: 0 to (232-1) |
27 |
BData B EFCN Packets Transmitted |
Total Packets Transmitted |
Egress-13 |
Provides a count of the bursty data B packets with an EFCN bit equal to 1 that are transmitted to the port. This statistic is collected after the packets are received from the bus and have passed egress queuing and servicing. Range: 0 to (232-1) |
28 |
Line Code Violations |
No |
Ingress-1 |
Provides a count of the line code violations that are encountered by the interface. These violations occur when more than three zeroes in a row are transmitted. Range: 0 to (232-1) |
29 |
Line Errored Seconds |
No |
Ingress-1 |
Provides a count of the line code violation errored seconds. Range: 0 to (232-1) |
30 |
Line Severely Errored Seconds |
Line Errored Seconds |
Ingress-1 |
Provides a count of the line code violation severely errored seconds (SES) that are encountered by the interface. Severely errored seconds are classified as errored seconds that are greater than the total line bits per second multiplied by 10-6. Range: 0 to (232-1) |
31 |
P-bit Parity Code Violations |
No |
Ingress-1 |
Provides a count of the P-bit parity codes that do not match the locally calculated parity code. Range: 0 to (232-1) |
32 |
Errored Seconds - Parity |
No |
Ingress-1 |
Provides a count of the seconds with at least one P-bit parity code violation. Range: 0 to (232-1) |
33 |
Severely Errored Seconds - Parity |
Line Errored Seconds |
Ingress-1 |
Provides a count of the P-bit parity code violation severely errored seconds (SES) that are encountered by the interface. Severely errored seconds are classified as errored seconds that are greater than the total line bits per second multiplied by 10-6. Range: 0 to (232-1) |
34 |
C-bit Parity Code Violations |
No |
Ingress-1 |
Provides a count of the C-bit parity code violations that do not match the locally calculated parity code. Range: 0 to (232-1) |
35 |
Errored Seconds - Path |
No |
Ingress-1 |
Provides a count of the C-bit parity code violation (PCV) errored seconds that are encountered by the interface. Range: 0 to (232-1) |
36 |
Severely Errored Seconds - Path |
Errored Seconds-Path |
Ingress-1 |
Provides a count of the C-bit PCV severely errored seconds that are encountered by the interface. Severely errored seconds are classified as errored seconds that are greater than the total line bits per second multiplied by 10-6. Range: 0 to (232-1) |
37 |
Severely Errored Framing Seconds |
No |
Ingress-1 |
Provides a count of the severely errored framing seconds that are encountered by the interface. Range: 0 to (232-1) |
38 |
Alarm Indication Signal Seconds |
No |
Ingress-1 |
Provides a count of the alarm indication signal (AIS) seconds that are encountered by the interface. Range: 0 to (232-1) |
39 |
Unavailable Seconds |
No |
Ingress-1 |
Provides a count of the seconds that service is not available because of LOS, OOF, AIS, or a yellow alarm. Range: 0 to (232-1) |
45 |
ATM Cell Header HEC Errors |
No |
Ingress-1 |
Provides a count of the header error checksum mismatches that are detected. Range: 0 to (232-1) |
47 |
Tx Voice Cells Dropped |
No |
Egress-7, 13 |
Provides a count of voice cells that are discarded in the transmit direction. Range: 0 to (232-1) |
48 |
Tx TS Cells Dropped |
No |
Egress-7, 13 |
Provides a count of time-stamped cells that are discarded in the transmit direction. Range: 0 to (232-1) |
49 |
Tx Non-TS Cells Dropped |
No |
Egress-7, 13 |
Provides a count of non-time-stamped cells that are discarded in the transmit direction. Range: 0 to (232-1) |
50 |
Tx High Priority Cells Dropped |
No |
Egress-7, 13 |
Provides a count of the high priority cells that are discarded in the transmit direction. Range: 0 to (232-1) |
51 |
Tx BData A Cells Dropped |
No |
Egress-7, 13 |
Provides a count of bursty data A cells that are discarded in the transmit direction. Range: 0 to (232-1) |
52 |
Tx BData B Cells Dropped |
No |
Egress-7, 13 |
Provides a count of bursty data B cells that are discarded in the transmit direction. Range: 0 to (232-1) |
53 |
Voice Cells Tx to Line |
Total Cells Tx to Line |
Egress-7, 13 |
Provides a count of the cells that are transmitted from the voice queue. Range: 0 to (232-1) |
54 |
TS Cells Tx to Line |
Total Cells Tx to Line |
Egress-7, 13 |
Provides a count of cells that are transmitted from the time-stamped queue. Range: 0 to (232-1) |
55 |
Non-TS Cells Tx to Line |
Total Cells Tx to Line |
Egress-7, 13 |
Provides a count of the cells that are transmitted from the non-time-stamped queue. Range: 0 to (232-1) |
56 |
High Priority Cells Tx to Line |
Total Cells Tx to Line |
Egress-7, 13 |
Provides a count of the cells that are transmitted from the high priority queue. Range: 0 to (232-1) |
57 |
BData A Cells Tx to Line |
Total Cells Tx to Line |
Egress-7, 13 |
Provides a count of the cells that are transmitted from the bursty data A cells queue. Range: 0 to (232-1) |
58 |
BData B Cells Tx to Line |
Total Cells Tx to Line |
Egress-7, 13 |
Provides a count of the cells that are transmitted from the bursty data B cells queue. Range: 0 to (232-1) |
59 |
Half Full Cells Tx to Line |
Total Cells Tx to Line |
Egress-7, 13 |
Provides a count of the cells containing one packet that are transmitted. Range: 0 to (232-1) |
60 |
Full Cells Tx to Line |
Total Cells Tx to Line |
Egress-7, 13 |
Provides a count of the cells containing two packets that are transmitted. Range: 0 to (232-1) |
61 |
Total Cells Tx to Line |
No |
Egress-7, 13 |
Provides a count of the total cells that are transmitted. Range: 0 to (232-1) |
62 |
Tx BData A CLP Cells Dropped |
No |
Egress-7, 13 |
Provides a count of the bursty data A cells with CLP equal to 1 that are discarded. Range: 0 to (232-1) |
63 |
Tx BData B CLP Cells Dropped |
No |
Egress-7, 13 |
Provides a count of the bursty data B cells with CLP equal to 1 that are discarded. Range: 0 to (232-1) |
64 |
BData A EFCN Cells Tx to Line |
No |
Egress-7, 13 |
Provides a count of the bursty data A cells with EFCN equal to 1 that are transmitted. Range: 0 to (232-1) |
65 |
BData B EFCN Cells Tx to Line |
No |
Egress-7, 13 |
Provides a count of the bursty data B cells with EFCN equal to 1 that are transmitted. Range: 0 to (232-1) |
66 |
Half Full Cells Rx from Line |
Total Cells Rx from Line |
Ingress-1, 8 |
Provides a count of the cells containing one packet that are received. Range: 0 to (232-1) |
67 |
Full Cells Rx from Line |
Total Cells Rx from Line |
Ingress-1, 8 |
Provides a count of the cells containing two packets that are received. Range: 0 to (232-1) |
68 |
Total Cells Rx from Line |
No |
Ingress-1 |
Provides a count of total cells that are received. Range: 0 to (232-1) |
69 |
Total Packets Rx from Line |
No |
Ingress-1 |
Provides a count of the total packets that are received. Range: 0 to (232-1) |
70 |
Rx Voice Packets Dropped |
No |
Ingress-4 |
Provides a count of the total voice packets that are dropped before the queue is sent to the bus. Range: 0 to (232-1) |
71 |
Rx TS Packets Dropped |
No |
Ingress-4 |
Provides a count of the time-stamped packets that are dropped before the queue is sent to the bus. Range: 0 to (232-1) |
72 |
Rx Non-TS Packets Dropped |
No |
Ingress-4 |
Provides a count of the non-time-stamped packets that are dropped before the queue is sent to the bus. Range: 0 to (232-1) |
73 |
Rx High Priority Packets Dropped |
No |
Ingress-4 |
Provides a count of the high priority packets that are dropped before the queue is sent to the bus. Range: 0 to (232-1) |
74 |
Rx BData A Packets Dropped |
No |
Ingress-4 |
Provides a count of the bursty data A packets that are dropped before the queue is sent to the bus. Range: 0 to (232-1) |
75 |
Rx BData B Packets Dropped |
No |
Ingress-4 |
Provides a count of the bursty data B packets that are dropped before the queue is sent to the bus. Range: 0 to (232-1) |
82 |
Rx BData A CLP Packets Dropped |
No |
Ingress-4 |
Provides a count of the bursty data A packets with CLP equal to 1 that are dropped. These packets are dropped before the queue is sent to the bus. Range: 0 to (232-1) |
83 |
Rx BData B CLP Packets Dropped |
No |
Ingress-4 |
Provides a count of the bursty data B packets with CLP equal to 1 that are dropped. These packets are dropped before the queue is sent to the bus. Range: 0 to (232-1) |
87 |
Rx Voice Cells Dropped |
No |
Ingress-4 |
Provides a count of voice cells that are discarded in the receive direction. These cells are dropped before the queue is sent to the bus. Range: 0 to (232-1) |
88 |
Rx TS Cells Dropped |
No |
Ingress-4 |
Provides a count of time-stamped cells that are discarded in the receive direction. These cells are dropped before the queue is sent to the bus. Range: 0 to (232-1) |
89 |
Rx Non-TS Cells Dropped |
No |
Ingress-4 |
Provides a count of non-time-stamped cells that are discarded in the receive direction. These cells are dropped before the queue is sent to the bus. Range: 0 to (232-1) |
90 |
Rx High Priority Cells Dropped |
No |
Ingress-4 |
Provides a count of the high priority cells that are discarded in the receive direction. These cells are dropped before the queue is sent to the bus. Range: 0 to (232-1) |
91 |
Rx BData A Cells Dropped |
No |
Egress-7, 13 |
Provides a count of bursty data A cells that are discarded in the receive direction. These cells are dropped before the queue is sent to the bus. Range: 0 to (232-1) |
92 |
Rx BData B Cells Dropped |
No |
Egress-7, 13 |
Provides a count of bursty data B cells that are discarded in the receive direction. These cells are dropped before the queue is sent to the bus. Range: 0 to (232-1) |
93 |
Rx BData A CLP Cells Dropped |
No |
Ingress-4 |
Provides a count of the cells with CLP equal to 1 that are dropped from the bursty data A queue. Range: 0 to (232-1) |
94 |
Rx BData B CLP Cells Dropped |
No |
Ingress-4 |
Provides a count of the cells with CLP equal to 1 that are dropped from the bursty data B queue. Range: 0 to (232-1) |
140 |
FEBE Counts |
No |
Ingress-1 |
Provides a count of the far end block errors (FEBEs) that are detected. Range: 0 to (232-1) |
141 |
FERR Counts (M-bit or F-bit) |
No |
Ingress-2 |
Provides a count of the framing errors in the frame received from the line. Range: 0 to (232-1) |
142 |
PLCP FEBE Err Secs |
No |
Ingress-1 |
Provides a count of the seconds that the physical layer convergence procedure (PLCP) FEBEs are received. Range: 0 to (232-1) |
143 |
PLCP FEBE Severely Err Secs |
PLCP FEBE Err Secs |
Ingress-1 |
Provides a count of the PLCP severely errored FEBE seconds. Severely errored seconds are classified as errored seconds that are greater than the total line bits per second multiplied by 10-6. Range: 0 to (232-1) |
144 |
PLCP FEBE Counts |
No |
Ingress-1 |
Provides a count of the PLCP FEBEs that are detected in the frame. Range: 0 to (232-1) |
145 |
PLCP FE Counts |
No |
Ingress-1 |
Provides a count of the PLCP framing pattern errors that are encountered by a DS3/E3 interface. Range: 0 to (232-1) |
146 |
ATM HEC Errored Seconds |
No |
Ingress-1 |
Provides a count of the seconds that ATM header errored checksum errors are received from the line. Range: 0 to (232-1) |
147 |
ATM HEC Severely Errored Seconds |
No |
Ingress-1 |
Provides a count of the seconds that ATM header errored checksum severe errors are received from the line. Severely errored seconds are classified as errored seconds that are greater than the total line bits per second multiplied by 10-6. Range: 0 to (232-1) |
148 |
BData A CLP Packets Transmitted |
No |
Egress-7, 13 |
Provides a count of the bursty data A packets with CLP equal to 1 that are transmitted from the queue. Range: 0 to (232-1) |
149 |
BData B CLP Packets Transmitted |
No |
Egress-7, 13 |
Provides a count of the bursty data B packets with CLP equal to 1 that are transmitted from the queue. Range: 0 to (232-1) |
160 |
CGW Packets Rx From IPX Net |
No |
— |
Provides a count of the Complex Gateway Packets (CGW) that are received. Range: 0 to (232-1) |
161 |
CGW Cells Tx To Line |
No |
— |
Provides a count of the CGWs that are transmitted. Range: 0 to (232-1) |
162 |
CGW Frames Relayed To Line |
No |
— |
Provides a count of the CGW frames that are transmitted. Range: 0 to (232-1) |
163 |
CGW Aborted Frames Tx To Line |
No |
— |
Provides a count of the CGW frames that are aborted during transmission. Range: 0 to (232-1) |
166 |
CGW Packets Tx To IPX Net |
No |
— |
Provides a count of the CGW packets that are transmitted. Range: 0 to (232-1) |
167 |
CGW Cells Rx From Line |
No |
— |
Provides a count of the CGW cells that are received. Range: 0 to (232-1) |
171 |
CGW Bad CRC-32 Frames Rx From Line |
No |
— |
Provides a count of the CGW frames with bad CRC-32 bit that are received. Range: 0 to (232-1) |
173 |
CGW Bad CRC-16 Frames Rx From IPX |
No |
— |
Provides a count of the CGW frames with bad CRC-16 bit that are received. Range: 0 to (232-1) |
177 |
OAM Loopback Cells Tx |
No |
After 13 |
Provides a count of the OAM segment loopback cells that are transmitted to the port. Range: 0 to (232-1) |
178 |
OAM AIS Cells Tx |
No |
After 13 |
Provides a count of the OAM AIS cells that are transmitted to the port. Range: 0 to (232-1) |
179 |
OAM FERF Cells Tx |
No |
After 13 |
Provides a count of the OAM far end receive failure (FERF) cells that are transmitted to the port. Range: 0 to (232-1) |
180 |
OAM RTD Cells Tx |
No |
— |
Provides a count of the OAM cells measuring round trip delay that are transmitted. Range: 0 to (232-1) |
181 |
OAM RA Cells Tx |
No |
— |
Provides a count of the OAM cells with remote alarm (RA) code that are transmitted. Range: 0 to (232-1) |
183 |
OAM CC Cells Tx |
No |
— |
Provides a count of the OAM cells with internode controller communications (CC) that are transmitted. Range: 0 to (232-1) |
185 |
OAM Loopback Cells Rx |
No |
Before 1 |
Provides a count of the OAM segment loopback cells that are received from the port (from the equipment connected to the port). Range: 0 to (232-1) |
186 |
OAM AIS Cells Rx |
No |
Before 1 |
Provides a count of the OAM AIS cells that are received from the port (from the equipment connected to the port). Range: 0 to (232-1) |
187 |
OAM FERF Cells Rx |
No |
Before 1 |
Provides a count of the OAM FERF cells that are received from the port (from the equipment connected to the port). Range: 0 to (232-1) |
188 |
OAM RTD Cells Rx |
No |
— |
Provides a count of the OAM cells measuring round trip delay that are received. Range: 0 to (232-1) |
189 |
OAM RA Cells Rx |
No |
— |
Provides a count of the OAM cells with RA code that are received. Range: 0 to (232-1) |
191 |
OAM CC Cells Rx |
No |
— |
Provides a count of the OAM cells with internode CC that are received. Range: 0 to (232-1) |
BXM and BNI ATM Trunk
This section provides information about the BXM and BNI statistics contained in the BPX_ATM group. The statistics in this group are applicable to Switch Software Releases 9.2 and 9.3 on the BPX switch.
The following table lists the attributes that are common to all of the BXM and BNI trunk statistics.
Front Cards |
BXM- T3/E3, BXM-155, BXM-622 BNI-T3/E3, BNI-OC-3 |
Back Cards |
BXM - BPX-T3/E3-BC, MMF-155-4/8, SMF-155-4/8 SMFLR-155-4/8, SMF-622-2, SMFLR-622-2, SMFXLR-622-2, SMF-622, SMFLR-622, SMFXLR-622 BNI - LM-3T3/3E, LM-OC-3-SMF/MMF/SMFL |
Object Type |
2 |
Subobject Type |
2 |
Default Peak Interval |
300 seconds |
The BXM and BNI ATM trunk statistics are primarily used for gathering billing and performance data. However, the multilevel statistics listed in this section are typically used for troubleshooting.
Some of the BXM and BNI trunk statistics are measured from different qbins on the BXM. The following list the type of traffic each qbin supports:
•Qbin 1—High priority
•Qbin 2—Time-stamped
•Qbin 3—Non-time-stamped
•Qbin 4—Bursty Data A
•Qbin 5—Bursty Data B
•Qbin 6—CBR
•Qbin 7—VBR-rt and Voice
•Qbin 8—VBR-nrt
•Qbin 9—ABR
•Qbin 10—UBR
•Qbin 11-15—Not assigned service traffic
The following table includes the description of each statistic and the point during the data flow at which the statistic gathers the appropriate information. Each measurement point refers to the corresponding point in Figure 4-1.
Note The statistics IDs in this section do not correspond to the IDs in the statistic file collected by the switch. For the mapping of these statistics IDs, see "BPX Trunk Statistics Mapping".
|
Stat ID
|
BXM and BNI Trunk Statistics
|
Subset of Other Stats
|
Ingress/Egress Measurement Point
|
Description
|
47 |
Tx Voice Cells Dropped |
No |
Egress-6, 7 |
Provides a count of the voice cells that are dropped before the cells in the queue are transmitted onto the line. These cells are dropped due to policing. Range: 0 to (232-1) |
48 |
Tx TS Cells Dropped |
No |
Egress-6, 7 |
Provides a count of the time-stamped cells that are dropped before the cells in the queue are transmitted onto the line. These cells are dropped due to policing. Range: 0 to (232-1) |
49 |
Tx Non-TS Cells Dropped |
No |
Egress-6, 7 |
Provides a count of the non-time-stamped cells that are dropped before the cells in the queue are transmitted onto the line. These cells are dropped due to policing. Range: 0 to (232-1) |
50 |
Tx High Priority Cell Dropped |
No |
Egress-6, 7 |
Provides a count of the high priority cells that are dropped before the cells in the queue are transmitted onto the line. These cells are dropped due to policing. High priority cells include OAM and RM traffic. Range: 0 to (232-1) |
51 |
Tx BData A Cells Dropped |
No |
Egress-6, 7 |
Provides a count of the bursty data A cells that are dropped before the cells in the queue are transmitted onto the line. These cells are dropped due to policing. Range: 0 to (232-1) |
52 |
Tx BData B Cells Dropped |
No |
Egress-6, 7 |
Provides a count of the bursty data B cells that are dropped before the cells in the queue are transmitted onto the line. These cells are dropped due to policing. Range: 0 to (232-1) |
53 |
Voice Cells Tx to Line |
No |
Egress-6, 7 |
Provides a count of the cells that are transmitted from the voice queue onto the line. Range: 0 to (232-1) |
54 |
TS Cells Tx to Line |
Total Cells Tx to Line |
Egress-7 |
Provides a count of the cells that are transmitted from the time-stamped queue onto the line. Range: 0 to (232-1) |
55 |
Non-TS Cells Tx to Line |
Total Cells Tx to Line |
Egress-7 |
Provides a count of the cells that are transmitted from the non-time-stamped queue onto the line. Range: 0 to (232-1) |
56 |
High Priority Cells Tx to Line |
Total Cells Tx to Line |
Egress-7 |
Provides a count of the cells that are transmitted from the high priority queue onto the line. High priority cells include OAM and RM traffic. Range: 0 to (232-1) |
57 |
BData A Cells Tx to Line |
Total Cells Tx to line |
Egress-7 |
Provides a count of the cells that are transmitted from the bursty data A queue onto the line. Range: 0 to (232-1) |
58 |
BData B Cells Tx to Line |
Total Cells Tx to line |
Egress-7 |
Provides a count of the cells that are transmitted from the bursty data B queue onto the line. Range: 0 to (232-1) |
61 |
Total Cells Tx to line |
No |
Egress-7 |
Provides a count of the total number of cells that are transmitted to the line. Range: 0 to (232-1) |
62 |
Tx Bdata A CLP Cells Dropped |
Tx BData A Cells Dropped |
Egress-6, 7 |
Provides a count of the cells with cell loss priority (CLP) equal to 1 that are dropped before being added to the bursty data A transmit queue. The count includes cells that are dropped due to an overflow or selective discard at the egress B-data A Qbin. Range: 0 to (232-1) |
63 |
Tx BData B CLP Cells Dropped |
Tx BData B Cells Dropped |
Egress-6, 7 |
Provides a count of the cells with CLP bit set that are dropped before being added to the bursty data B transmit queue. Range: 0 to (232-1) |
155 |
Tx Voice CLP Cells Dropped |
Tx Voice Cells Dropped |
Egress-6, 7 |
Provides a count of the voice cells with CLP bit set that are dropped before being added to the voice transmit queue. Range: 0 to (232-1) |
156 |
Tx TS CLP Cells Dropped |
Tx TS Cells Dropped |
Egress-6, 7 |
Provides a count of the time-stamped cells with CLP bit set that are dropped before being added to the time-stamp transmit queue. Range: 0 to (232-1) |
157 |
Tx Non-TS CLP Cells Dropped |
Tx Non-TS Cells Dropped |
Egress-6, 7 |
Provides a count of the non-time-stamped cells with the CLP bit set that are dropped before the queue is transmitted. Range: 0 to (232-1) |
158 |
Tx High Priority CLP Cell Dropped |
Tx High Priority Cell Dropped |
Egress-6, 7 |
Provides a count of the high priority cells with the CLP bit set dropped before being added to the transmit queue. High priority cells include OAM and RM traffic. Range: 0 to (232-1) |
160 |
Tx CBR Cells Served |
No |
Egress-6, 7 |
Provides a count of cells with the constant bit rate (CBR) set that are transmitted. Range: 0 to (232-1) |
161 |
Tx VBR Cells Served |
No |
Egress-6, 7 |
Provides a count of cells with the variable bit rate (VBR) set that are transmitted. Range: 0 to (232-1) |
162 |
Tx ABR Cells Served |
No |
Egress-6, 7 |
Provides a count of cells with the available bit rate (ABR) set that are transmitted. Range: 0 to (232-1) |
163 |
Tx CBR CLP Drpd Cells |
No |
Egress-6, 7 |
Provides a count of the CBR cells with the CLP bit set that are dropped before being added to the CBR transmit queue. Range: 0 to (232-1) |
164 |
Tx VBR CLP Drpd Cells |
No |
Egress-6, 7 |
Provides a count of the VBR cells with the CLP bit set that are dropped before being added to the VBR transmit queue. Range: 0 to (232-1) |
165 |
Tx ABR CLP Drpd Cells |
No |
Egress-6, 7 |
Provides a count of the ABR cells with the CLP bit set that are dropped before being added to the ABR transmit queue. Range: 0 to (232-1) |
166 |
Tx CBR Overflow Drpd Cells |
No |
Egress-6, 7 |
Provides a count of the CBR cells that are dropped due to overflow before being added to the CBR transmit queue. These cells are dropped due to policing. Range: 0 to (232-1) |
167 |
Tx VBR Overflow Drpd Cells |
No |
Egress-6, 7 |
Provides a count of the VBR cells that are dropped due to overflow before being added to the VBR transmit queue. These cells are dropped due to policing. Range: 0 to (232-1) |
168 |
Tx ABR Overflow Drpd Cells |
No |
Egress-6, 7 |
Provides a count of the ABR cells that are dropped due to overflow before being added to the ABR transmit queue. These cells are dropped due to policing. Note This statistic cannot be enabled on the BNI card. Range: 0 to (232-1) |
196 |
Tx NTS Cells Discarded |
No |
Egress-6, 7 |
Provides a count of the non-time-stamped cells that are discarded before being added to the transmit queue. These cells are discarded due to errors within the cells. Note This statistic cannot be enabled on the BNI card. Range: 0 to (232-1) |
197 |
Tx Hi-Pri Cells Discarded |
No |
Egress-6, 7 |
Provides a count of the high priority cells that are discarded before being added to the transmit queue. These cells are discarded due to errors within the cells. High priority cells include OAM and RM traffic. Note This statistic cannot be enabled on the BNI card. Range: 0 to (232-1) |
198 |
Tx Voice Cells discarded |
No |
Egress-6, 7 |
Provides a count of the voice cells that are discarded before being added to the voice transmit queue. These cells are discarded due to errors within the cells. Note This statistic cannot be enabled on the BNI card. Range: 0 to (232-1) |
199 |
Tx TS Cells discarded |
No |
Egress-6, 7 |
Provides a count of the time-stamped cells that are discarded before being added to the time-stamped transmit queue. These cells are discarded due to errors within the cells. Note This statistic cannot be enabled on the BNI card. Range: 0 to (232-1) |
200 |
Tx BData A Cells discarded |
No |
Egress-6, 7 |
Provides a count of the bursty data A cells that are discarded before being added to the bursty data A transmit queue. These cells are discarded due to errors within the cells. Note This statistic cannot be enabled on the BNI card. Range: 0 to (232-1) |
201 |
Tx BData B Cells discarded |
No |
Egress-6, 7 |
Provides a count of the bursty data B cells that are discarded before being added to the bursty data B transmit queue. These cells are discarded due to errors within the cells. Note This statistic cannot be enabled on the BNI card. Range: 0 to (232-1) |
202 |
Tx CBR Cells discarded |
No |
Egress-6, 7 |
Provides a count of cells with the CBR bit set that are discarded. These cells are discarded due to errors within the cells. Note This statistic cannot be enabled on the BNI card. Range: 0 to (232-1) |
203 |
Tx ABR Cells discarded |
No |
Egress-6, 7 |
Provides a count of cells with the ABR bit set that are discarded. These cells are discarded due to errors within the cells. Note This statistic cannot be enabled on the BNI card. Range: 0 to (232-1) |
204 |
Tx VBR Cells discarded |
No |
Egress-6, 7 |
Provides a count of cells with the VBR bit set that are discarded. These cells are discarded due to errors within the cells. Note This statistic cannot be enabled on the BNI card. Range: 0 to (232-1) |
205 |
Egress NTS Cells Rx |
Total Cells Rx |
Egress-5 |
Provides a count of the cells that are received from the non-time-stamped queue onto the line. Note This statistic cannot be enabled on the BNI card. Range: 0 to (232-1) |
206 |
Egress Hi-Pri Cells Rx |
Total Cells Rx |
Egress-5 |
Provides a count of the high priority cells that are received. High priority cells include OAM and RM traffic. Note This statistic cannot be enabled on the BNI card. Range: 0 to (232-1) |
207 |
Egress TS Cells Rx |
Total Cells Rx |
Egress-5 |
Provides a count of the time-stamped cells that are received. Note This statistic cannot be enabled on the BNI card. Range: 0 to (232-1) |
208 |
Egress BData A Cells Rx |
Total Cells Rx |
Egress-5 |
Provides a count of the cells that are received from the bursty data A queue. Note This statistic cannot be enabled on the BNI card. Range: 0 to (232-1) |
209 |
Egress BData B Cells Rx |
Total Cells Rx |
Egress-5 |
Provides a count of the cells that are received from the bursty data B queue. Note This statistic cannot be enabled on the BNI card. Range: 0 to (232-1) |
210 |
Egress CBR Cells Rx |
Total Cells Rx |
Egress-5 |
Provides a count of the CBR cells that are received. Range: 0 to (232-1) |
211 |
Egress ABR Cells Rx |
Total Cells Rx |
Egress-5 |
Provides a count of the number ABR cells that are received. Note This statistic cannot be enabled on the BNI card. Range: 0 to (232-1) |
212 |
Egress VBR Cells Rx |
Total Cells Rx |
Egress-5 |
Provides a count of the VBR cells that are received. Note This statistic cannot be enabled on the BNI card. Range: 0 to (232-1) |
213 |
CLP0 cells Rx |
Total Cells Rx |
Ingress-1 |
Provides a count of the cells with CLP equal to 0 that are received from the port. This statistic is classified as level 1 in the multilevel statistics. Note This statistic cannot be enabled on the BNI card. Range: 0 to (232-1) |
214 |
CLP1 cells Rx |
Total Cells Rx |
Ingress-1 |
Provides a count of the cells with CLP equal to 1 that are received from the port. This statistic is classified as level 1 in the multilevel statistics. Note This statistic cannot be enabled on the BNI card. Range: 0 to (232-1) |
215 |
CLP0 cells congestion discard |
CLP0 cells Rx |
Ingress-1 |
Provides a count of the cells with CLP equal to 0 that are received from the port and discarded due to congestion. This statistic is classified as level 1 in the multilevel statistics. Note This statistic cannot be enabled on the BNI card. Range: 0 to (232-1) |
216 |
CLP1 cells congestion discard |
CLP1 cells Rx |
Ingress-1 |
Provides a count of the cells with CLP equal to 1 that are received from the port and discarded due to congestion. This statistic is classified as level 1 in the multilevel statistics. Note This statistic cannot be enabled on the BNI card. Range: 0 to (232-1) |
217 |
CLP0 cells Tx |
Total Cells Tx to line |
Egress-7 |
Provides a count of the cells with CLP equal to 0 that are transmitted. This statistic is classified as level 1 in the multilevel statistics. Note This statistic cannot be enabled on the BNI card. Range: 0 to (232-1) |
218 |
CLP1 cells Tx |
Total Cells Tx to line |
Egress-7 |
Provides a count of the cells with CLP equal to 1 that are transmitted. This statistic is classified as level 1 in the multilevel statistics. Note This statistic cannot be enabled on the BNI card. Range: 0 to (232-1) |
219 |
Total Cells Rx |
No |
Ingress-1 |
Provides a count of the total cells that are received at the port. Note This statistic cannot be enabled on the BNI card. Range: 0 to (232-1) |
220 |
Ingress OAM cell count |
Total Cells Rx |
Ingress-3 |
Provides a count of the operation, administration, and maintenance (OAM) cells that are received from the port. This statistic is classified as level 3 in the multilevel statistics. Note This statistic cannot be enabled on the BNI card. Range: 0 to (232-1) |
221 |
Egress OAM cell count |
Total Cells Tx to line |
Egress-13 |
Provides a count of the OAM cells that are transmitted on the egress port. This statistic is classified as level 3 in the multilevel statistics. Note This statistic cannot be enabled on the BNI card. Range: 0 to (232-1) |
222 |
Ingress RM cell count |
Total Cells Rx |
Ingress-3 |
Provides a count of the resource management (RM) cells that are received from the port. This statistic is classified as level 3 in the multilevel statistics. Note This statistic cannot be enabled on the BNI card. Range: 0 to (232-1) |
223 |
Egress RM cell count |
Total Cells Tx to line |
Egress-13 |
Provides a count of the RM cells that are transmitted to the port. This statistic is classified as level 3 in the multilevel statistics. Note This statistic cannot be enabled on the BNI card. Range: 0 to (232-1) |
224 |
Egress Voice Cells Rx |
Total Cells Rx |
Egress-5 |
Provides a count of the voice cells that are received. Note This statistic cannot be enabled on the BNI card. Range: 0 to (232-1) |
9057 |
Cells served out of Qbin10 |
Total Cells Tx to Line |
Egress-7 |
Provides a count of the cells that are transmitted out of Qbin 10. Qbin 10 is assigned to multiprotocol label switching (MPLS) traffic. Note This statistic cannot be enabled on the BNI card. Range: 0 to (232-1) |
9058 |
Cells discarded by Qbin10 |
Cells RX by Qbin10 |
Ingress-8 |
Provides a count of the cells that are discarded on Qbin 10. Qbin 10 is assigned to MPLS traffic. Note This statistic cannot be enabled on the BNI card. Range: 0 to (232-1) |
9059 |
Cells RX by Qbin10 |
Total Cells Rx |
Ingress-8 |
Provides a count of the cells that are received on Qbin 10. Qbin 10 is assigned to MPLS traffic. Note This statistic cannot be enabled on the BNI card. Range: 0 to (232-1) |
9060 |
Cells served out of Qbin11 |
Total Cells Tx to Line |
Egress-7 |
Provides a count of the cells that are transmitted out of Qbin 11. If Qbin 11 is not assigned a traffic service, the count returns a value of 0. Note This statistic cannot be enabled on the BNI card. Range: 0 to (232-1) |
9061 |
Cells discarded by Qbin11 |
Cells RX by Qbin11 |
Ingress-8 |
Provides a count of the cells that are discarded on Qbin 11. If Qbin 11 is not assigned a traffic service, the count returns a value of 0. Note This statistic cannot be enabled on the BNI card. Range: 0 to (232-1) |
9062 |
Cells RX by Qbin11 |
Total Cells Rx from Line |
Ingress-8 |
Provides a count of the cells that are received on Qbin 11. If Qbin 11 is not assigned a traffic service, the count returns a value of 0. Note This statistic cannot be enabled on the BNI card. Range: 0 to (232-1) |
9063 |
Cells served out of Qbin12 |
Total Cells Tx to Line |
Egress-7 |
Provides a count of the cells that are transmitted out of Qbin 12. If Qbin 12 is not assigned a traffic service, the count returns a value of 0. Note This statistic cannot be enabled on the BNI card. Range: 0 to (232-1) |
9064 |
Cells discarded by Qbin12 |
Cells RX by Qbin12 |
Ingress-8 |
Provides a count of the cells that are discarded on Qbin 12. If Qbin 12 is not assigned a traffic service, the count returns a value of 0. Note This statistic cannot be enabled on the BNI card. Range: 0 to (232-1) |
9065 |
Cells RX by Qbin12 |
Total Cells Rx |
Ingress-8 |
Provides a count of the cells that are received on Qbin 12. If Qbin 12 is not assigned a traffic service, the count returns a value of 0. Note This statistic cannot be enabled on the BNI card. Range: 0 to (232-1) |
9066 |
Cells served out of Qbin13 |
Total Cells Tx to Line |
Egress-7 |
Provides a count of the cells that are transmitted out of Qbin 13. If Qbin 13 is not assigned a traffic service, the count returns a value of 0. Note This statistic cannot be enabled on the BNI card. Range: 0 to (232-1) |
9067 |
Cells discarded by Qbin13 |
Cells RX by Qbin13 |
Ingress-8 |
Provides a count of the cells that are discarded on Qbin 13. If Qbin 13 is not assigned a traffic service, the count returns a value of 0. Note This statistic cannot be enabled on the BNI card. Range: 0 to (232-1) |
9068 |
Cells RX by Qbin13 |
Total Cells Rx |
Ingress-8 |
Provides a count of the cells that are received on Qbin 13. If Qbin 13 is not assigned a traffic service, the count returns a value of 0. Note This statistic cannot be enabled on the BNI card. Range: 0 to (232-1) |
9069 |
Cells served out of Qbin14 |
Total Cells Tx to Line |
Egress-7 |
Provides a count of the cells that are transmitted out of Qbin 14. If Qbin 14 is not assigned a traffic service, the count returns a value of 0. Note This statistic cannot be enabled on the BNI card. Range: 0 to (232-1) |
9070 |
Cells discarded by Qbin14 |
Cells RX by Qbin14 |
Ingress-8 |
Provides a count of the cells that are discarded on Qbin 14. If Qbin 14 is not assigned a traffic service, the count returns a value of 0. Note This statistic cannot be enabled on the BNI card. Range: 0 to (232-1) |
9071 |
Cells RX by Qbin14 |
Total Cells Rx |
Ingress-8 |
Provides a count of the cells that are received on Qbin 14. If Qbin 14 is not assigned a traffic service, the count returns a value of 0. Note This statistic cannot be enabled on the BNI card. Range: 0 to (232-1) |
9072 |
Cells served out of Qbin15 |
Total Cells Tx to Line |
Egress-7 |
Provides a count of the cells that are transmitted out of Qbin 15. If Qbin 15 is not assigned a traffic service, the count returns a value of 0. Note This statistic cannot be enabled on the BNI card. Range: 0 to (232-1) |
9073 |
Cells discarded by Qbin15 |
Cells RX by Qbin15 |
Ingress-8 |
Provides a count of the cells that are discarded on Qbin 15. If Qbin 15 is not assigned a traffic service, the count returns a value of 0. Note This statistic cannot be enabled on the BNI card. Range: 0 to (232-1) |
9074 |
Cells RX by Qbin15 |
Total Cells Rx |
Ingress-8 |
Provides a count of the cells that are received on Qbin 15. If Qbin 15 is not assigned a traffic service, the count returns a value of 0. Note This statistic cannot be enabled on the BNI card. Range: 0 to (232-1) |
MGX Narrowband
The statistics contained in the MGX Narrowband group are not used by any cards in SCM but are listed in the database.
The following statistics are contained in this group:
•Out of Frames
•Losses of Signal
•Frame Bit Errors
PXM1 and BNM ATM
This section provides information about the statistics contained in the MGX_ATM group. The statistics in this group are applicable to the PXM1 and BNM cards on the MGX 8220, MGX 8230, MGX 8250, and MGX 8850 Release 1 nodes.
The following table lists the attributes that are common to the PXM1 and BNM ATM statistics.
Front Cards |
PXM1, BNM-T3E3 |
Back Cards |
PXM-UI - RJ-45/48, BNC, DB-15 BNM - T3E3-D-BC, T3E3-B-BC |
Object Type |
2 (Trunks) |
Subobject Type |
4 (Basis PLCP trunk) |
Default Peak Interval |
60 seconds (fixed setting) |
The PXM1 and BNM ATM statistics are primarily used for gathering billing and performance data.
The following table includes the description of each statistic and the point during the data flow at which the statistic gathers the appropriate information. Each measurement point refers to the corresponding point in Figure 4-1.
|
Stat ID
|
PXM1 and BNM ATM Statistics
|
Subset of Other Stats
|
Ingress/Egress Measurement Point
|
Description
|
2 |
Out of Frames |
No |
Ingress-1 |
Provides a count of the times an out of frame (OOF) is detected. The count includes OOF alarms. Range: 0 to (232-1) |
3 |
Losses of Signal |
No |
Ingress-1 |
Provides a count of the times a loss of signal (LOS) is detected. The count includes OOF alarms. Range: 0 to (232-1) |
45 |
ATM Cell Header HEC Errors |
No |
Ingress-1 |
Provides a count of the header checksum errors that occur within the collection interval. Range: 0 to (232-1) |
51 |
Tx BData A Cells Dropped |
No |
Egress-13 |
Provides a count of the transmitted bursty data A cells that are dropped. Range: 0 to (232-1) |
142 |
PLCP FEBE Err Secs |
No |
Ingress-1 |
Provides a count of the physical layer convergence protocol (PLCP) far end block error (FEBE) seconds that occur within the collection interval. Range: 0 to (232-1) |
143 |
PLCP FEBE Severely Err Secs |
PLCP FEBE Err Secs |
Ingress-1 |
Provides a count of the severely errored FEBE seconds that occur within the collection interval. Range: 0 to (232-1) |
144 |
PLCP FEBE Counts |
No |
Ingress-1 |
Provides a count of the FEBEs that are detected. Range: 0 to (232-1) |
145 |
PLCP FE Counts |
No |
Ingress-1 |
Provides a count of the framing errors that are detected. Range: 0 to (232-1) |
150 |
DS3 Yellow Transition Counts |
No |
Ingress-1 |
Provides a count of the times a remote alarm indicator (RAI) is detected. Range: 0 to (232-1) |
BNM SONET
This section provides information about the statistics contained in the SONET group. The statistics in this group are applicable to the BNM card on the MGX 8220 switch.
The following table lists the attributes that are common to all of the BNM SONET statistics.
Front Card |
BNM-155 |
Back Card |
SMF-155 |
Object Type |
2 (Trunks) |
Subobject Type |
5 (Basis SONET trunk) |
Default Peak Interval |
60 seconds (fixed setting) |
The BNM SONET path interface statistics are primarily used for gathering billing and performance data.
The following table includes the description of each statistic and the point during the data flow at which the statistic gathers the appropriate information. Each measurement point refers to the corresponding point in Figure 4-1.
|
Stat ID
|
BNM SONET Statistics
|
Subset of Other Stats
|
Ingress/Egress Measurement Point
|
Description
|
2 |
sonetSectionLOFCounter |
No |
Ingress-1 |
Provides a count of the loss of frames (LOFs) that are encountered by a SONET/SDH section. Range: 0 to (232-1) |
3 |
sonetSectionLOSCounter |
No |
Ingress-1 |
Provides a count of the loss of signals (LOSs) that are encountered by a SONET/SDH. Range: 0 to (232-1) |
171 |
sonetPathAISCounter |
No |
Ingress-1 |
Provides a count of the alarm indicator signals (AIS) that are encountered by a SONET/SDH. Range: 0 to (232-1) |
196 |
LNsonetLineCounterAISs |
No |
Ingress-1 |
Provides a count of the AIS encountered by a SONET/SDH. Range: 0 to (232-1) |
197 |
LNsonetLineCounterRFIs |
No |
Ingress-1 |
Provides a count of the remote failure indications (RFIs) that are encountered by a SONET/SDH line. Range: 0 to (232-1) |
198 |
LNsonetPathCounterRFIs |
No |
Ingress-1 |
Provides a count of the RFIs that are encountered by a SONET/SDH line. Range: 0 to (232-1) |
FastPAD Trunk
This section provides information about the FastPAD trunk statistics contained in the FTC Trunk group. The following table lists the attributes that are common to all of the FastPAD trunk statistics.
Front Cards |
— |
Back Cards |
— |
Object Type |
2 |
Subobject Type |
6 |
Default Peak Interval |
60 seconds (fixed setting) |
The FastPAD trunk statistics are primarily used for gathering billing and performance data.
The following table includes the description of each statistic and the point during the data flow at which the statistic gathers the appropriate information. Each measurement point refers to the corresponding point in Figure 4-1.
|
Stat ID
|
FastPAD Trunk Statistics
|
Subset of Other Stats
|
Ingress/Egress Measurement Point
|
Description
|
205 |
Packets Received |
— |
— |
Provides a count of the packets that are received. Range: 0 to (232-1) |
206 |
Packets Transmitted |
— |
— |
Provides a count of the packets that are transmitted. Range: 0 to (232-1) |
207 |
Bytes Received |
— |
— |
Provides a count of the frame bytes that are received. Range: 0 to (232-1) |
208 |
Bytes Transmitted |
— |
— |
Provides a count of the frame bytes that are received from the bus and then transmitted. Range: 0 to (232-1) |
209 |
FTC Management packets Received |
— |
— |
Provides a count of the operation, maintenance, and administration (OAM) and resource management (RM) cells that are received. Range: 0 to (232-1) |
210 |
FTC Management packets Transmitted |
— |
— |
Provides a count of the OAM and RM cells that are transmitted. Range: 0 to (232-1) |
211 |
Tx Cells dropped, Q Overflow |
— |
— |
Provides a count of the cells that are dropped during transmission due to an overflow in the Qbin. Range: 0 to (232-1) |
212 |
Tx Cells dropped, No Destination |
— |
— |
Provides a count of the cells that are dropped during transmission due to an unspecified destination. Range: 0 to (232-1) |
213 |
Rx Cells dropped, Unknown DLCI/mux-byte |
— |
— |
Provides a count of the cells that are dropped due to an unknown DLCI or mux-byte. Range: 0 to (232-1) |
UXM Trunk
This section provides information about the statistics contained in the IGX_ATM group. The UXM trunk statistics are applicable to Switch Software Releases 9.2 and 9.3 on the IGX switch.
Note The UXM trunk statistics are also applicable to the UXM-E card.
The following table lists the attributes that are common to all of the UXM trunk statistics.
Front Card |
UXM |
Back Cards |
BC-UAI-6-T3/E3, BC-UAI-3-T3/E3, BC-UAI-2/4-155-SMF, BC-UAI-2/4-SMFXLR, BC-UAI-4-STM1E, BC-UAI-4-155-MMF |
Object Type |
2 |
Subobject Type |
7 |
Default Peak Interval |
300 seconds |
The UXM trunk statistics are primarily used for gathering billing, performance, and troubleshooting data.
The following table includes the description of each statistic and the point during the data flow at which the statistic gathers the appropriate information. Each measurement point refers to the corresponding point in Figure 4-1.
|
Stat ID
|
UXM Trunk Statistics
|
Subset of Other Stats
|
Ingress/Egress Measurement Point
|
Description
|
0 |
Voice Cells Transmitted To Line |
Total Cells Transmitted |
Egress-7, 13 |
Provides a count of the voice cells transmitted. Range: 0 to (224-1) |
1 |
TS Cells Transmitted To Line |
Total Cells Transmitted |
Egress-7, 13 |
Provides a count of time-stamped cells transmitted. Range: 0 to (224-1) |
2 |
Non-TS Cells Transmitted To Line |
Total Cells Transmitted |
Egress-7, 13 |
Provides a count of non-time-stamped cells transmitted. Range: 0 to (224-1) |
3 |
High Priority Cells Tx to Line |
Total Cells Transmitted |
Egress-7, 13 |
Provides a count of high priority cells that are transmitted. High priority cells include OAM and RM traffic. Range: 0 to (224-1) |
4 |
BData A Cells Transmitted To Line |
Total Cells Transmitted |
Egress-7, 13 |
Provides a count of the bursty data A cells that are transmitted. Range: 0 to (224-1) |
5 |
BData B Cells Transmitted To Line |
Total Cells Transmitted |
Egress-7, 13 |
Provides a count of the bursty data B cells that are transmitted. Range: 0 to (224-1) |
6 |
CBR Cells Transmitted To Line |
Total Cells Transmitted |
Egress-7, 13 |
Provides a count of the constant bit rate (CBR) ATM cells that are transmitted. The count includes operation, administration, and maintenance (OAM) cells. Range: 0 to (224-1) |
7 |
VBR Cells Transmitted To Line |
Total Cells Transmitted |
Egress-7, 13 |
Provides a count of non-real-time variable bit rate (VBR) cells that are transmitted. Range: 0 to (224-1) |
8 |
ABR Cells Transmitted To Line |
Total Cells Transmitted |
Egress-7, 13 |
Provides a count of the available bit rate (ABR) ATM cells that are transmitted. The count includes OAM cells. Range: 0 to (224-1) |
9 |
Transmit Non-TS Cells Discarded |
No |
Egress-7, 13 |
Provides a count of non-time-stamped cells that are discarded in the transmit direction. Range: 0 to (224-1) |
10 |
Transmit HP Cells Discarded |
No |
Egress-7, 13 |
Provides a count of high priority (HP) cells that are discarded in the transmit direction. High priority cells include OAM and RM traffic. Range: 0 to (224-1) |
11 |
Transmit Voice Cells Discarded |
No |
Egress-7, 13 |
Provides a count of voice cells that are discarded in the transmit direction. Range: 0 to (224-1) |
12 |
Transmit TS Cells Discarded |
No |
Egress-7, 13 |
Provides a count of time-stamped cells that are discarded in the transmit direction. Range: 0 to (224-1) |
13 |
Transmit BData A Cells Discarded |
No |
Egress-7, 13 |
Provides a count of bursty data A cells that are discarded in the transmit direction. Range: 0 to (224-1) |
14 |
Transmit BData B Cells Discarded |
No |
Egress-7, 13 |
Provides a count of bursty data B cells that are discarded in the transmit direction. Range: 0 to (224-1) |
15 |
Transmit CBR Cells Discarded |
No |
Egress-7, 13 |
Provides a count of CBR cells that are discarded in the transmit direction. Range: 0 to (224-1) |
16 |
Transmit ABR Cells Discarded |
No |
Egress-7, 13 |
Provides a count of ABR cells that are discarded in the transmit direction. Range: 0 to (224-1) |
17 |
Transmit VBR Cells Discarded |
No |
Egress-7, 13 |
Provides a count of non-real-time VBR cells that are discarded in the transmit direction. Range: 0 to (224-1) |
18 |
Egress Non-TS Cells Received |
No |
Egress-5, 11 |
Provides a count of non-time-stamped cells that are received from the bus. Range: 0 to (224-1) |
19 |
Egress HP Cells Received |
No |
Egress-5, 11 |
Provides a count of high priority cells (congestion control traffic) received in the egress direction. High priority cells include OAM and RM traffic. Range: 0 to (224-1) |
20 |
Egress Voice Cells Received |
No |
Egress-5, 11 |
Provides a count of voice cells that are received from the bus. Range: 0 to (224-1) |
21 |
Egress TS Cells Received |
No |
Egress-5, 11 |
Provides a count of time-stamped cells that are received from the bus. Range: 0 to (224-1) |
22 |
Egress BData A Cells Received |
No |
Egress-5, 11 |
Provides a count of the bursty data A cells that are received by the Qbin in the transmit direction. Range: 0 to (224-1) |
23 |
Egress BData B Cells Received |
No |
Egress-5, 11 |
Provides a count of the bursty data B cells that are received by the Qbin in the transmit direction. Range: 0 to (224-1) |
24 |
Egress CBR Cells Received |
No |
Egress-5, 11 |
Provides a count of the CBR cells that are received by the Qbin in the transmit direction. Range: 0 to (224-1) |
25 |
Egress ABR Cells Received |
No |
Egress-5, 11 |
Provides a count of the ABR cells that are received by the Qbin in the transmit direction. Range: 0 to (224-1) |
26 |
Egress VBR Cells Received |
No |
Egress-5, 11 |
Provides a count of non-real-time VBR cells that are received from the bus. Range: 0 to (224-1) |
27 |
VI Cells Received With CLP Set |
Total Cells Received |
Ingress-1, 8 |
Provides a count of virtual interface (VI) cells with cell loss priority (CLP) equal to 1 that are received. Range: 0 to (232-1) |
28 |
VI OAM Cells Received |
Total Cells Received |
Ingress-1, 8 |
Provides a count of VI OAM cells that are received. Range: 0 to (232-1) |
29 |
VI Cells Transmitted With CLP Set |
Total Cells Transmitted |
Egress-7, 13 |
Provides a count of VI cells with CLP equal to 1 that are transmitted. Range: 0 to (232-1) |
30 |
VI Cells Received With CLP0 |
Total Cells Received |
Ingress-1, 8 |
Provides a count of VI cells with CLP equal to 0 that are received. Range: 0 to (232-1) |
31 |
VI Cells Discarded With CLP0 |
VI Cells Received With CLP0 |
Ingress-1, 8 |
Provides a count of VI cells with CLP equal to 0 that are discarded. Range: 0 to (232-1) |
32 |
VI Cells Discarded With CLP Set |
VI Cells Received With CLP Set |
Ingress-1, 8 |
Provides a count of VI cells with the CLP bit set (equal to 1) that are discarded. Range: 0 to (232-1) |
33 |
VI Cells Transmitted With CLP0 |
Total Cells Transmitted |
Egress-7, 13 |
Provides a count of VI cells with CLP equal to 0 that are transmitted. Range: 0 to (232-1) |
34 |
Egress OAM Cells Count |
Total Cells Transmitted |
Egress-7, 13 |
Provides a count of OAM cells that are transmitted. Range: 0 to (232-1) |
35 |
Ingress RM Cells Count |
Total Cells Received |
Ingress-1, 8 |
Provides a count of resource management (RM) cells that are received. Range: 0 to (232-1) |
36 |
Egress RM Cells Count |
Total Cells Transmitted |
Egress-7, 13 |
Provides a count of RM cells that are transmitted. Range: 0 to (232-1) |
37 |
Total Cells Transmitted |
No |
Egress-7, 13 |
Provides a count of total cells that are transmitted. Range: 0 to (232-1) |
38 |
Total Cells Received |
No |
Ingress-1, 8 |
Provides a count of total cells that are received. Range: 0 to (232-1) |
39 |
Egress FP From Cellbus |
No |
Egress-5, 11 |
Provides a count of FastPackets that are received from the bus. Range: 0 to (232-1) |
40 |
Egress Cells Transmitted |
No |
Egress-7, 13 |
Provides a count of network-interworking FastPackets that are transmitted. Range: 0 to (232-1) |
41 |
Egress NIW FP Transmitted |
No |
Egress-7, 13 |
Provides a count of service-interworking FastPackets that are transmitted. Range: 0 to (232-1) |
42 |
Egress SIW FP Transmitted |
No |
Egress-5, 11 |
Provides a count of aborted FastPackets that are received from the bus. FastPackets are aborted due to a problem with the cellbus that causes a failure with the FastPacket. Range: 0 to (224-1) |
43 |
Egress Aborted FP From Cellbus |
No |
Egress-5, 11 |
Provides a count of aborted FastPackets that are received from the bus. FastPackets are aborted due to a problem with the cellbus that causes a failure with the FastPacket. Range: 0 to (224-1) |
44 |
Egress Discarded FP |
No |
Egress-7, 13 |
Provides a count of FastPackets that are discarded in the egress direction. Range: 0 to (232-1) |
45 |
Egress Zero Length FP From Cellbus |
No |
Egress-5, 11 |
Provides a count of zero-length FastPackets that are received from the bus. Range: 0 to (232-1) |
46 |
Egress Bad CRC16 From Cellbus |
No |
Egress-5, 11 |
Provides a count of frames with bad cyclic redundancy check (CRC) 16 bit that are received from the cellbus. Range: 0 to (232-1) |
47 |
Egress Bad Length FP From Cellbus |
No |
Egress-5, 11 |
Provides a count of bad length FastPackets that are received from the cellbus. Range: 0 to (232-1) |
48 |
Egress ForeSight Cells Transmitted |
ABR Cells Transmitted To Line Egress Cells Transmitted |
Egress-7, 13 |
Provides a count of the number of ForeSight cells that are transmitted. Range: 0 to (232-1) |
49 |
Egress CF FP Sequence Error |
No |
Egress-7, 13 |
Provides a count of the egress cell forwarding FastPacket sequence errors. Range: 0 to (232-1) |
50 |
Egress CF Bad HEC From Cellbus |
No |
Egress-5, 11 |
Provides a count of forwarding cells with bad header error control (HEC) that are received from the bus. Range: 0 to (232-1) |
51 |
Egress CF From Cellbus |
No |
Egress-7, 13 |
Provides a count of the forwarding cells that are received from the bus. Range: 0 to (232-1) |
52 |
Egress CF Cells Transmitted |
Total Cells Transmitted |
Egress-7, 13 |
Provides a count of the number of forwarding cells that are transmitted. Range: 0 to (232-1) |
53 |
Ingress FP To Cellbus |
No |
Ingress-4, 10 |
Provides a count of FastPackets that are sent to the bus. Range: 0 to (232-1) |
54 |
Ingress Cells Received |
Total Cells Received |
Ingress-1, 8 |
Provides a count of cells that are received. Range: 0 to (232-1) |
55 |
Ingress NIW FP Received |
No |
Ingress-1, 8 |
Provides a count of network-interworking FastPackets that are received. Range: 0 to (232-1) |
56 |
Ingress SIW FP Received |
No |
Ingress-1, 8 |
Provides a count of service-interworking FastPackets that are received. Range: 0 to (232-1) |
57 |
Ingress Aborted FP To Cellbus |
Ingress FP From Cellbus |
Egress-5, 11 |
Provides a count of the cells that contain aborted FastPackets that are received from the cellbus. FastPackets are aborted due to a problem with the cellbus that causes a failure with the FastPacket. Although the statistic name indicates ingress, the count is actually taken on the egress side. Range: 0 to (232-1) |
58 |
Ingress Discarded FP |
No |
Ingress-1, 8 |
Provides a count of FastPackets that are discarded. Range: 0 to (232-1) |
59 |
Ingress Zero Length FP Received |
No |
Ingress-1, 8 |
Provides a count of zero length FastPackets that are received. Zero length frames do not have payload. Range: 0 to (232-1) |
60 |
Ingress Bad CRC32 Received |
No |
Ingress-1, 8 |
Provides a count of frames with bad
CRC 32 bit that are received. Range: 0 to (232-1) |
61 |
Ingress Bad Length FP Received |
No |
Ingress-1, 8 |
Provides a count of bad length FastPackets that are received. Range: 0 to (232-1) |
62 |
Ingress ForeSight Cells To Cellbus |
No |
Egress-5, 11 |
Provides a count of the ForeSight cells that are sent to the cellbus. Range: 0 to (232-1) |
63 |
Ingress Bad CRC10 OAM/RM Cells |
No |
Ingress-1, 8 |
Provides a count of OAM or RM cells with a bad CRC 10 value. Range: 0 to (232-1) |
72 |
Cells served out of egress Qbin10 |
Total Cells Tx to Line |
Egress-7 |
Provides a count of the cells that are transmitted out of Qbin 10. Qbin 10 is assigned to multiprotocol label switching (MPLS) traffic. Note This statistic is only available in Switch Software Release 9.3 and above. Range: 0 to (232-1) |
73 |
Cells discarded by egress Qbin10 |
Cells received by egress Qbin10 |
Ingress-8 |
Provides a count of the cells that are discarded on Qbin 10. Qbin 10 is assigned to MPLS traffic. Note This statistic is only available in Switch Software Release 9.3 and above. Range: 0 to (232-1) |
74 |
Cells received by egress Qbin 10 |
Total Cells Rx |
Ingress-8 |
Provides a count of the cells that are received on Qbin 10. Qbin 10 is assigned to MPLS traffic. Note This statistic is only available in Switch Software Release 9.3 and above. Range: 0 to (232-1) |
75 |
Cells served out of egress Qbin11 |
Total Cells Tx to Line |
Egress-7 |
Provides a count of the cells that are transmitted out of Qbin 11. If Qbin 11 is not assigned a traffic service, the count returns a value of 0. Note This statistic is only available in Switch Software Release 9.3 and above. Range: 0 to (232-1) |
76 |
Cells discarded by egress Qbin11 |
Cells received by egress Qbin11 |
Ingress-8 |
Provides a count of the cells that are discarded on Qbin 11. If Qbin 11 is not assigned a traffic service, the count returns a value of 0. Note This statistic is only available in Switch Software Release 9.3 and above. Range: 0 to (232-1) |
77 |
Cells received by egress Qbin11 |
Total Cells Rx from Line |
Ingress-8 |
Provides a count of the cells that are received on Qbin 11. If Qbin 11 is not assigned a traffic service, the count returns a value of 0. Note This statistic is only available in Switch Software Release 9.3 and above. Range: 0 to (232-1) |
78 |
Cells served out of egress Qbin12 |
Total Cells Tx to Line |
Egress-7 |
Provides a count of the cells that are transmitted out of Qbin 12. If Qbin 12 is not assigned a traffic service, the count returns a value of 0. Note This statistic is only available in Switch Software Release 9.3 and above. Range: 0 to (232-1) |
79 |
Cells discarded by egress Qbin12 |
Cells received by egress Qbin12 |
Ingress-8 |
Provides a count of the cells that are discarded on Qbin 12. If Qbin 12 is not assigned a traffic service, the count returns a value of 0. Note This statistic is only available in Switch Software Release 9.3 and above. Range: 0 to (232-1) |
80 |
Cells received by egress Qbin12 |
Total Cells Rx |
Ingress-8 |
Provides a count of the cells that are received on Qbin 12. If Qbin 12 is not assigned a traffic service, the count returns a value of 0. Note This statistic is only available in Switch Software Release 9.3 and above. Range: 0 to (232-1) |
81 |
Cells served out of egress Qbin13 |
Total Cells Tx to Line |
Egress-7 |
Provides a count of the cells that are transmitted out of Qbin 13. If Qbin 13 is not assigned a traffic service, the count returns a value of 0. Note This statistic is only available in Switch Software Release 9.3 and above. Range: 0 to (232-1) |
82 |
Cells discarded by egress Qbin13 |
Cells received by egress Qbin13 |
Ingress-8 |
Provides a count of the cells that are discarded on Qbin 13. If Qbin 13 is not assigned a traffic service, the count returns a value of 0. Note This statistic is only available in Switch Software Release 9.3 and above. Range: 0 to (232-1) |
83 |
Cells received by egress Qbin13 |
Total Cells Rx |
Ingress-8 |
Provides a count of the cells that are received on Qbin 13. If Qbin 13 is not assigned a traffic service, the count returns a value of 0. Note This statistic is only available in Switch Software Release 9.3 and above. Range: 0 to (232-1) |
84 |
Cells served out of egress Qbin14 |
Total Cells Tx to Line |
Egress-7 |
Provides a count of the cells that are transmitted out of Qbin 14. If Qbin 14 is not assigned a traffic service, the count returns a value of 0. Note This statistic is only available in Switch Software Release 9.3 and above. Range: 0 to (232-1) |
85 |
Cells discarded by egress Qbin14 |
Cells received by egress Qbin14 |
Ingress-8 |
Provides a count of the cells that are discarded on Qbin 14. If Qbin 14 is not assigned a traffic service, the count returns a value of 0. Note This statistic is only available in Switch Software Release 9.3 and above. Range: 0 to (232-1) |
86 |
Cells received by egress Qbin14 |
Total Cells Rx |
Ingress-8 |
Provides a count of the cells that are received on Qbin 14. If Qbin 14 is not assigned a traffic service, the count returns a value of 0. Note This statistic is only available in Switch Software Release 9.3 and above. Range: 0 to (232-1) |
87 |
Cells served out of egress Qbin 15 |
Total Cells Tx to Line |
Egress-7 |
Provides a count of the cells that are transmitted out of Qbin 15. If Qbin 15 is not assigned a traffic service, the count returns a value of 0. Note This statistic is only available in Switch Software Release 9.3 and above. Range: 0 to (232-1) |
88 |
Cells discarded by egress Qbin 15 |
Cells received by egress Qbin15 |
Ingress-8 |
Provides a count of the cells that are discarded on Qbin 15. If Qbin 15 is not assigned a traffic service, the count returns a value of 0. Note This statistic is only available in Switch Software Release 9.3 and above. Range: 0 to (232-1) |
89 |
Cells received by egress Qbin 15 |
Total Cells Rx |
Ingress-8 |
Provides a count of the cells that are received on Qbin 15. If Qbin 15 is not assigned a traffic service, the count returns a value of 0. Note This statistic is only available in Switch Software Release 9.3 and above. Range: 0 to (232-1) |
Port Statistics
The following port statistics are supported in CWM Release 11:
•IGX Frame Relay Port
•UXM and URM Port
•BXM and ASI Port
•FastPAD Port
•FRSM Port
•AUSM Port
•IGX Voice Port
•PXM1 Port
•AXSM Port
•BXM and ASI Virtual Port
•AXSM-E Port
•PXM1E Port
•FRSM12 Port
IGX Frame Relay Port
This section provides information about the statistics contained in the Frame Relay Port group. The statistics in this group are applicable to the FRM and UFM cards on the IGX switch.
The following table lists the attributes that are common to all of the IGX Frame Relay port statistics.
Front Cards |
FRM, UFM-4C, UFM-8C, UFM-U |
Back Cards |
FRI-T1, FRI-E1, UFI-8T1-DB-15, UFI-8E1-DB-15, UFI-8E1-BNC, UFI-12V.35, UFI-12X.21, UFI-4HSSI |
Object Type |
3 |
Subobject Type |
0 |
Default Peak Interval |
300 seconds |
The IGX Frame Relay port statistics are primarily used for gathering billing and performance data.
The following table includes the description of each statistic and the point during the data flow at which the statistic gathers the appropriate information. Each measurement point refers to the corresponding point in Figure 4-1, with the exception of the following ingress points:
•1—Frame is validated against errors at the port level, for example CRC, alignment errors, and undefined DCLI.
•2—Frame is checked for queue depth and queue threshold.
•3— Policing occurs.
•4—Frame is queued and transmitted to the cell bus in ATM cells.
|
Stat ID
|
IGX Frame Relay Port Statistics
|
Subset of Other Stats
|
Ingress/Egress Measurement Point
|
Description
|
0 |
Frames Received |
No |
Ingress-1 |
Provides a count of the frames received from the customer premises equipment (CPE). The count includes signaling protocol frames that are received from the CPE. This statistic also increments when the received frame is invalid or discarded for any reason. Range: 0 to (232-1) |
1 |
Frames Transmitted |
No |
Egress-13 |
Provides a count of the frames that are transmitted to the CPE. The count includes signaling protocol frames transmitted to the CPE. Range: 0 to (232-1) |
2 |
Bytes Received |
No |
Ingress-1 |
Provides the number of bytes in the frames counted in the port Frames Received statistic. The count includes Frame Relay header and FCS/CRC bytes. Range: 0 to (232-1) |
3 |
Bytes Transmitted |
No |
Egress-13 |
Provides the number of bytes in the frames counted in the port Frames Transmitted statistic. The count includes Frame Relay header and FCS/CRC bytes. Range: 0 to (232-1) |
4 |
Frames Transmitted with FECN |
Frames Transmitted |
Egress-13 |
Provides a count of the frames with the forward explicit congestion notification (FECN) bit set that are transmitted to the CPE. The congestion can occur anywhere in the network. Range: 0 to (232-1) |
5 |
Frames Transmitted with BECN |
Frames Transmitted |
Egress-13 |
Provides a count of the frames with the backward explicit congestion notification (BECN) bit set that are transmitted to the CPE. The congestion can occur anywhere in the network. Range: 0 to (232-1) |
6 |
Receive Frames CRC Errors |
Frames Received |
Ingress-1 |
Provides a count of the frames with an invalid CRC that are received from the CPE. The CRC calculated by the FRSM card does not match the CRC provided by the CPE. The count includes inconsistencies in the last two bytes of the Frame Relay header. Any frame with an incorrect CRC is discarded by the network. If the CRC is incorrect because of a bit error in the DLCI field, then the error is also recorded in the Receive Frame with Undefined DLCI Err statistic. Range: 0 to (232-1) |
7 |
Invalid Format Receive Frames |
Frames Received |
Ingress-1 |
Provides a count of the frames with incorrect extended address (EA) bits (the least significant bits in the two Frame Relay header bytes) that are received from the CPE. The first octet equals 0, and the second octet equals 1. Any frame received with an incorrect EA bit is discarded. Range: 0 to (232-1) |
8 |
Receive Frames Alignment Errors |
Frames Received |
Ingress-1 |
Provides a count of the frames with an incorrect total frame length that are received from the CPE. Any frame received with an incorrect alignment is discarded by the network. Range: 0 to (232-1) |
9 |
Illegal Length Receive Frames |
Frames Received |
Ingress-1 |
Provides a count of the frames with the total frame length more than 4510 bytes that are received from the CPE. The frame length includes the Frame Relay header and the FCS/CRC bytes. Any frame received with an invalid length is discarded by the network. Range: 0 to (232-1) |
10 |
Number of DMA Overruns |
— |
— |
Provides a count of the direct memory access (DMA) overruns. Range: 0 to (232-1) |
11 |
LMI Status Enquiries |
Frames Received |
Ingress-1 |
Provides a count of the status enquiry frames that are received from the CPE as part of the selected signaling protocol. This statistic is valid for the signaling protocol chosen (StrataLMI, Annex A UNI, Annex D UNI, Annex A NNI, or Annex D NNI). If the configuration of the T391 timer on the CPE and the card is equal, the count is the same as the Received Status Counter statistic for NNI Annex A and Annex D. Range: 0 to (232-1) |
12 |
LMI Status Transmit Count |
Frames Transmitted |
Egress-13 |
Provides a count of the status frames that are transmitted to the CPE as part of the signaling protocol. This statistic is valid for the signaling protocol chosen (StrataLMI, Annex A UNI, Annex D UNI, Annex A NNI, or Annex D NNI). If the configuration of the T391 timer on the CPE and the card is equal, the count is the same as the Transmit Status Enquiries statistic for NNI Annex A and Annex D. Range: 0 to (232-1) |
13 |
LMI Status Update Count |
Frames Received |
Ingress-1 |
Provides a count of the asynchronous status update frames that are received from the CPE as part of the selected signaling protocol. This statistic is valid for both NNI signaling protocols (Annex A and Annex D). Range: 0 to (232-1) |
14 |
LMI Invalid Status Enquiries |
Frames Received |
Ingress-1 |
Provides a count of the status enquiry frames with an invalid format that are received from the CPE as part of the selected signaling protocol. This statistic is valid for the signaling protocol chosen (StrataLMI, Annex A UNI, Annex D UNI, Annex A NNI, or Annex D NNI). Range: 0 to (232-1) |
15 |
LMI Link Timeout Errors |
No |
Not applicable |
Provides a count of the times that the T392 polling verification timer expires before receiving a status enquiry frame. This statistic is valid for the signaling protocol chosen (StrataLMI, Annex A UNI, Annex D UNI, Annex A NNI, or Annex D NNI). Range: 0 to (232-1) |
16 |
LMI Keepalive Sequence Errors |
— |
— |
Provides a count of the polling device detects keepalive sequence errors. Range: 0 to (232-1) |
17 |
Receive Frames Undefined DLCI Err |
Frames Received |
Ingress-1 |
Provides a count of the frames received that have a DLCI without a PVC provisioned on the port. The count includes frames received with an incorrect or disabled signaling protocol. For example, the StrataLMI signaling protocol is enabled while the CPE is generating Annex A or Annex D signaling protocol frames, or vice versa. Any frame received with an undefined DLCI is discarded. Range: 0 to (232-1) |
18 |
DE Frames Dropped |
Frames Received |
Ingress-2 |
Provides a count of the frames received from the CPE that are dropped because the DE bit is set, and the PVC ingress buffer reached the DE threshold. Range: 0 to (232-1) |
19 |
Transmit Status Enquiries |
Frames Transmitted |
Egress-13 |
Provides a count of the status enquiry frames that are transmitted to the CPE as part of the selected signaling protocol. This statistic is valid for both NNI signaling protocols (Annex A and Annex D). If the configuration of the T391 timer on the CPE and the card is equal, the count is the same as the LMI Status Transmit Count statistic for NNI Annex A and Annex D. Range: 0 to (232-1) |
20 |
Received Status Counter |
Frames Received |
Not applicable |
Provides a count of the status frames received from the CPE that are part of the selected signaling protocol. This statistic is valid for both NNI signaling protocols (Annex A and Annex D). If the configuration of the T391 timer on the CPE and the card is equal, the count is the same as the LMI Status Enquiries statistic for NNI Annex A and Annex D. Range: 0 to (232-1) |
21 |
Asynchronous Status Counter |
Frames Received |
Not applicable |
Provides a count of the asynchronous status update frames received from the CPE that are part of the selected signaling protocol. This statistic is valid for both NNI signaling protocols (Annex A and Annex D). Range: 0 to (232-1) |
22 |
Invalid Sequence Number Count |
No |
Not applicable |
Provides a count of the times discontinuity occurs with the sequence numbers contained in the status enquiry frames received from the CPE. This statistic is valid for the signaling protocol chosen (StrataLMI, Annex A UNI, Annex D UNI, Annex A NNI, or Annex D NNI). Range: 0 to (232-1) |
23 |
Transmit Protocol Timeout Count |
No |
Not applicable |
Provides a count of the times that the T392 polling verification timer expires without receiving a status frame from the CPE. This statistic is valid for both NNI signaling protocols (Annex A NNI and Annex D NNI). Range: 0 to (232-1) |
24 |
CLLM Message Frames Transmitted |
— |
— |
Provides a count of the consolidated link layer message (CLLM) frames transmitted over the NNI port. Range: 0 to (232-1) |
25 |
CLLM Message Bytes Transmitted |
— |
— |
Provides a count of the CLLM bytes transmitted over the NNI port. Range: 0 to (232-1) |
26 |
CLLM Message Frames Received |
— |
— |
Provides a count of the CLLM frames received by the NNI port. Range: 0 to (232-1) |
27 |
CLLM Message Bytes Received |
— |
— |
Provides a count of the CLLM bytes received by the NNI port. Range: 0 to (232-1) |
28 |
CLLM Failures |
— |
— |
Provides a count of the CLLM timeouts with no messages that are received. Range: 0 to (232-1) |
29 |
Tx Frames Discarded-
Q-Overflow |
No |
Egress-12 |
Provides a count of the total frames that are discarded due to an overflow in the queue. Range: 0 to (232-1) |
30 |
Tx Bytes Discarded-
Q-Overflow |
No |
Egress-12 |
Provides the number of bytes in the frames counted in the Tx Frames Discarded-Q-Overflow statistic. The count includes Frame Relay header and FCS/CRC bytes. Range: 0 to (232-1) |
31 |
Tx Frames while Ingress LMI Fail |
No |
Egress-13 |
Provides a count of the frames that are discarded while the LMI signaling protocol on the local port is in a failed state. Range: 0 to (232-1) |
32 |
Tx Bytes while Ingress LMI Fail |
Bytes Transmitted |
Egress-13 |
Provides the number of bytes in the frames counted in the Tx Frames while Ingress LMI Fail statistic. The count includes Frame Relay header and FCS/CRC bytes. Range: 0 to (232-1) |
UXM and URM Port
This section provides information about the statistics contained in the ASI Port group. The UXM and URM statistics are applicable to Switch Software Releases 9.2 and 9.3 on the IGX switch.
Note The UXM port statistics in this section are also applicable to the UXM-E card.
The following table lists the attributes that are common to the UXM and URM port statistics.
Front Cards |
UXM, URM |
Back Cards |
UXM - BC-UAI-6-T3/E3, BC-UAI-3-T3/E3, BC-UAI-2/4-155-SMF, BC-UAI-2/4-SMFXLR, BC-UAI-4-STM1E, BC-UAI-4-155-MMF URM - BC-URI-2FE2V-T1/E1 |
Object Type |
3 |
Subobject Type |
1 |
Default Peak Interval |
300 seconds |
The UXM and URM port statistics are primarily used for gathering billing data.
Some of the port statistics are measured from different qbins on the cards. The following list the type of traffic each qbin supports:
•Qbin 0—CBR
•Qbin 1—UBR/ABR
•Qbin 2—VBR-nrt
•Qbin 3—ATM
•Qbins 4-8—SVC
•Qbin 9—VBR-rt
•Qbins 10-15—Virtual switch interface (VSI)
The following table includes the description of each statistic and the point during the data flow at which the statistic gathers the appropriate information. Each measurement point refers to the corresponding point in Figure 4-1.
|
Stat ID
|
UXM and URM Port Statistics
|
Subset of Other Stats
|
Ingress/Egress Measurement Point
|
Description
|
0 |
Unknown VPI/VCI |
No |
Ingress-2, 3 |
Provides the last unknown virtual path indicator (VPI)/virtual channel indicator (VCI) value on the port. Note This statistic is only available on the UXM card. Range: VPI/VCI value |
7 |
Number of Cells Rx |
No |
Ingress-1 |
Provides a count of the total cells that are received at the port prior to policing and virtual channel (VC) queuing. The count is the sum of cell loss priority (CLP) cells (0+1). Note This statistic is only available on the UXM card. Range: 0 to (232-1) cells |
8 |
Number of Cells Rx
w/CLP set |
Number of Cells Rx |
Ingress-2 |
Provides a count of the total cells that are received with CLP equal to 1. Range: 0 to (232-1) cells |
11 |
Number of Cells Tx |
No |
Egress-12, 13 |
Provides a count of the total cells that are transmitted to the port after VC queuing. The count includes both data and operation, administration, and maintenance (OAM) cells. Note This statistic is only available on the UXM card. Range: 0 to (232-1) cells |
12 |
OAM Cells Rx Count |
Number of Cells Rx |
Ingress-2 |
Provides a count of the total OAM cells that are received from the port. Range: 0 to (232-1) cells |
14 |
Number of Cells Tx w/CLP set |
Number of Cells Tx |
Egress-12 |
Provides a count of the total cells with CLP equal to 1 that are transmitted to the port. Range: 0 to (232-1) cells |
17 |
Get Request Rx |
No |
Ingress-3 |
Provides a count of the Integrated Local Management Interface (ILMI) GetRequest messages that are received from the port. The count is measured after segmentation and reassembly (SAR) processing. Range: 0 to (232-1) cells |
18 |
GetNext Request Rx |
No |
Measured after SAR processing-3 |
Provides a count of the ILMI GetNextRequest messages that are received from the port. Range: 0 to (232-1) cells |
19 |
GetNext Request Tx |
No |
Measured after SAR processing-12 |
Provides a count of the ILMI GetNextRequest messages that are transmitted to the port. Range: 0 to (232-1) cells |
20 |
SetRequest Rx |
No |
Measured after SAR processing-3 |
Provides a count of the ILMI SetRequest messages that are received from the port. Range: 0 to (232-1) cells |
21 |
Trap Rx |
No |
Measured after SAR processing-3 |
Provides a count of the traps that are received from the port. Range: 0 to (232-1) cells |
22 |
Get Response Rx |
No |
Measured after SAR processing-3 |
Provides a count of the ILMI GetResponse messages that are received from the port. Range: 0 to (232-1) cells |
23 |
Get Request Tx |
No |
Measured after SAR processing-12 |
Provides a count of the ILMI GetRequest messages that are transmitted to the port. Range: 0 to (232-1) cells |
24 |
Get Response Tx |
No |
Measured after SAR processing-12 |
Provides a count of the ILMI GetResponse messages that are transmitted to the port. Range: 0 to (232-1) cells |
25 |
Trap Tx |
No |
Measured after SAR processing-12 |
Provides a count of the traps that are transmitted to the port. Range: 0 to (232-1) cells |
27 |
Status Tx |
No |
Measured after SAR processing-12 |
Provides a count of the Local Management Interface (LMI) Status messages that are transmitted to the port. Note This statistic is only available on the UXM card. Range: 0 to (232-1) cells |
28 |
Update Status Tx |
No |
Measured after SAR processing-12 |
Provides a count of the LMI UpdateStatus messages that are transmitted to the port. Note This statistic is only available on the UXM card. Range: 0 to (232-1) cells |
29 |
Status Ack Tx |
No |
Measured after SAR processing-12 |
Provides a count of the LMI Status Acknowledgement (StatusAck) messages that are transmitted to the port. Note This statistic is only available on the UXM card. Range: 0 to (232-1) cells |
30 |
Status Enq Rx |
No |
Measured after SAR processing-3 |
Provides a count of the LMI StatusEnquiry messages that are received from the port. Note This statistic is only available on the UXM card. Range: 0 to (232-1) cells |
31 |
Status Enq Tx |
No |
Measured after SAR processing-12 |
Provides a count of the LMI StatusEnquiry messages that are transmitted to the port. Note This statistic is only available on the UXM card. Range: 0 to (232-1) cells |
32 |
Status Rx |
No |
Measured after SAR processing-3 |
Provides a count of the LMI Status messages that are received from the port. Note This statistic is only available on the UXM card. Range: 0 to (232-1) cells |
33 |
Update Status Rx |
No |
Measured after SAR processing-3 |
Provides a count of the LMI UpdateStatus messages that are received from the port. Note This statistic is only available on the UXM card. Range: 0 to (232-1) cells |
34 |
Status Ack Rx |
No |
Measured after SAR processing-3 |
Provides a count of the LMI Status Acknowledgement (StatusAck) messages that are received from the port. Note This statistic is only available on the UXM card. Range: 0 to (232-1) cells |
35 |
Invalid LMI Rx |
No |
Measured after SAR processing-3 |
Provides a count of the invalid LMI protocol data units (PDUs) that are received from the port. Note This statistic is only available on the UXM card. Range: 0 to (232-1) cells |
36 |
Invalid LMI length Rx |
Invalid LMI Rx |
Measured after SAR processing-3 |
Provides a count of the invalid LMI PDU lengths that are received from the port. Note This statistic is only available on the UXM card. Range: 0 to (232-1) cells |
37 |
Unknown LMI Rx |
Invalid LMI Rx |
Measured after SAR processing-3 |
Provides a count of the unknown LMI PDUs that are received from the port. Note This statistic is only available on the UXM card. Range: 0 to (232-1) cells |
38 |
Invalid LMI IE Rx |
Invalid LMI Rx |
Measured after SAR processing-3 |
Provides a count of the LMI information elements (IEs) that are received from the port. Note This statistic is only available on the UXM card. Range: 0 to (232-1) cells |
39 |
Invalid Transaction IDs |
Invalid LMI Rx |
Measured after SAR processing-3 |
Provides a count of the invalid LMI transaction IDs that are received from the port. Note This statistic is only available on the UXM card. Range: 0 to (232-1) cells |
40 |
Cells Rx w/CLP=0 |
Number of Cells RX |
Ingress-2 |
Provides a count of the total cells with CLP equal to 0 that are received from the port. Range: 0 to (232-1) cells |
41 |
Cells Rx w/CLP=0 discarded |
Cells Rx w/CLP=0 |
Ingress-2 |
Provides a count of the total cells with CLP equal to 0 that are received from the port and then discarded. Range: 0 to (232-1) cells |
42 |
Cells Rx w/CLP discarded |
Number of Cells Rx w/CLP set |
Ingress-2 |
Provides a count of the total cells with CLP equal to 1 that are received from the port and then discarded. Range: 0 to (232-1) cells |
43 |
Cells Tx w/CLP=0 |
Number of Cells Tx |
Egress-12 |
Provides a count of the total cells with CLP equal to 0 that are transmitted to the port. Range: 0 to (232-1) cells |
44 |
Egress OAM Cell Count |
Number of Cells Tx |
Egress-13 |
Provides a count of the valid OAM cells that are transmitted to the port. Range: 0 to (232-1) cells |
45 |
Ingress RM Cell Count |
Number of Cells Rx |
Ingress-1 |
Provides a count of the valid resource management (RM) cells that are received from the port. Range: 0 to (232-1) cells |
46 |
Egress RM Cell Count |
Number of Cells Tx |
Egress-13 |
Provides a count of the valid RM cells that are transmitted to the port. Range: 0 to (232-1) cells |
49 |
Maximum Diff Delay |
— |
— |
Provides the maximum tolerance delay for cells. Note This statistic is only available on the UXM card. Range: 0 to (232-1) cells |
50 |
HEC Cell Errors |
— |
— |
Provides a count of the cells that have header error control (HEC) errors. Note This statistic is only available on the UXM card. Range: 0 to (232-1) cells |
51 |
LCP Cell Errors |
— |
— |
Provides a count of the LCP cell errors. Note This statistic is only available on the UXM card. Range: 0 to (232-1) cells |
52 |
Cell Hunt Count |
— |
— |
Provides a count of the cell hunts on the port. Note This statistic is only available on the UXM card. Range: 0 to (232-1) cells |
53 |
Bandwidth Change Count |
— |
— |
Provides a count of the bandwidth changes. Note This statistic is only available on the UXM card. Range: 0 to (232-1) cells |
69 |
SetRequest Tx |
No |
Measured after SAR processing-3 |
Provides a count of the ILMI Set Request messages that are transmitted to the port. Range: 0 to (232-1) cells |
70 |
Last known VPI/VCI |
No |
Ingress-2, 3 |
Provides the last known VPI.VCI value on the port. Range: VPI/VCI value |
71 |
Unknown ILMI Rx |
No |
Measured after SAR processing-3 |
Provides a count of the unknown ILMI PDUs that are received from the port. Range: 0 to (232-1) cells |
78 |
Unavailable Seconds |
— |
— |
Provides a count of the unavailable seconds (UAS). UAS are defined as 10 contiguous severely errored seconds. Note This statistic is only available on the UXM card. Range: 0 to (232-1) |
79 |
Near End Fail Count |
— |
— |
Provides a count of the times that the near end goes from an active state to a fail state. Note This statistic is only available on the UXM card. Range: 0 to (232-1) |
80 |
Last Proto Fail Code |
— |
— |
Provides the last protocol failure code on the port. Note This statistic is only available on the UXM card. Range: 0 to (232-1) |
81 |
Slowest Link |
— |
— |
Provides a count of the slowest links on the port. Note This statistic is only available on the UXM card. Range: 0 to (232-1) |
9054 |
Cells served out of egress Qbin 2 |
Number of Cells Tx |
Egress-7 |
Provides a count of the cells that are transmitted out of Qbin 2. Qbin 2 is assigned to VBR-nrt traffic. Note This statistic is only available in Switch Software Release 9.3 and above. Range: 0 to (232-1) |
9055 |
Cells discarded by egress Qbin 2 |
Cells received by egress
Qbin 2 |
Ingress-8 |
Provides a count of the cells that are discarded on Qbin 2. Qbin 2 is assigned to VBR-nrt traffic. Note This statistic is only available in Switch Software Release 9.3 and above. Range: 0 to (232-1) |
9056 |
Cells received by egress Qbin 2 |
Number of Cells Rx |
Ingress-8 |
Provides a count of the cells that are received on Qbin 2. Qbin 2 is assigned to VBR-nrt traffic. Note This statistic is only available in Switch Software Release 9.3 and above. Range: 0 to (232-1) |
9057 |
Cells served out of egress Qbin 3 |
Number of Cells Tx |
Egress-7 |
Provides a count of the cells that are transmitted out of Qbin 3. Qbin 3 is assigned to ATM traffic. Note This statistic is only available in Switch Software Release 9.3 and above. Range: 0 to (232-1) |
9058 |
Cells discarded by egress Qbin 3 |
Cells received by egress
Qbin 3 |
Ingress-8 |
Provides a count of the cells that are discarded on Qbin 3. Qbin 3 is assigned to ATM traffic. Note This statistic is only available in Switch Software Release 9.3 and above. Range: 0 to (232-1) |
9059 |
Cells received by egress Qbin 3 |
Number of Cells Rx |
Ingress-8 |
Provides a count of the cells that are received on Qbin 3. Qbin 3 is assigned to ATM traffic. Note This statistic is only available in Switch Software Release 9.3 and above. Range: 0 to (232-1) |
9069 |
Cells served out of egress Qbin 7 |
Number of Cells Tx |
Egress-7 |
Provides a count of the cells that are transmitted out of Qbin 7. Qbin 7 is assigned to SVC traffic. Note This statistic is only available in Switch Software Release 9.3 and above. Range: 0 to (232-1) |
9070 |
Cells discarded by egress Qbin 7 |
Cells received by egress
Qbin 7 |
Ingress-8 |
Provides a count of the cells that are discarded on Qbin 7. Qbin 7 is assigned to SVC traffic. Note This statistic is only available in Switch Software Release 9.3 and above. Range: 0 to (232-1) |
9071 |
Cells received by egress Qbin 7 |
Number of Cells Rx |
Ingress-8 |
Provides a count of the cells that are received on Qbin 7. Qbin 7 is assigned to SVC traffic. Note This statistic is only available in Switch Software Release 9.3 and above. Range: 0 to (232-1) |
9072 |
Cells served out of egress Qbin 8 |
Number of Cells Tx |
Egress-7 |
Provides a count of the cells that are transmitted out of Qbin 8. Qbin 8 is assigned to SVC traffic. Note This statistic is only available in Switch Software Release 9.3 and above. Range: 0 to (232-1) |
9073 |
Cells discarded by egress Qbin 8 |
Cells received by egress
Qbin 8 |
Ingress-8 |
Provides a count of the cells that are discarded on Qbin 8. Qbin 8 is assigned to SVC traffic. Note This statistic is only available in Switch Software Release 9.3 and above. Range: 0 to (232-1) |
9074 |
Cells received by egress Qbin 8 |
Number of Cells Rx |
Ingress-8 |
Provides a count of the cells that are received on Qbin 8. Qbin 8 is assigned to SVC traffic. Note This statistic is only available in Switch Software Release 9.3 and above. Range: 0 to (232-1) |
9075 |
Cells served out of egress Qbin 9 |
Number of Cells Tx |
Egress-7 |
Provides a count of the cells that are transmitted out of Qbin 9. Qbin 9 is assigned to VBR-rt traffic. Note This statistic is only available in Switch Software Release 9.3 and above. Range: 0 to (232-1) |
9076 |
Cells discarded by egress Qbin 9 |
Cells received by egress
Qbin 9 |
Ingress-8 |
Provides a count of the cells that are discarded on Qbin 9. Qbin 9 is assigned to VBR-rt traffic. Note This statistic is only available in Switch Software Release 9.3 and above. Range: 0 to (232-1) |
9077 |
Cells received by egress Qbin 9 |
Number of Cells Rx |
Ingress-8 |
Provides a count of the cells that are received on Qbin 9. Qbin 9 is assigned to VBR-rt traffic. Note This statistic is only available on the UXM card in Switch Software Release 9.3 and above. Range: 0 to (232-1) |
9078 |
Cells served out of egress Qbin10 |
Number of Cells Tx |
Egress-7 |
Provides a count of the cells that are transmitted out of Qbin 10. Qbin 10 is assigned to multiprotocol label switching (MPLS) traffic. Note This statistic is only available in Switch Software Release 9.3 and above. Range: 0 to (232-1) |
9079 |
Cells discarded by egress Qbin10 |
Cells received by egress Qbin10 |
Ingress-8 |
Provides a count of the cells that are discarded on Qbin 10. Qbin 10 is assigned to MPLS traffic. Note This statistic is only available in Switch Software Release 9.3 and above. Range: 0 to (232-1) |
9080 |
Cells received by egress Qbin 10 |
Number of Cells Rx |
Ingress-8 |
Provides a count of the cells that are received on Qbin 10. Qbin 10 is assigned to MPLS traffic. Note This statistic is only available in Switch Software Release 9.3 and above. Range: 0 to (232-1) |
9081 |
Cells served out of egress Qbin11 |
Number of Cells Tx |
Egress-7 |
Provides a count of the cells that are transmitted out of Qbin 11. If Qbin 11 is not assigned a traffic service, the count returns a value of 0. Note This statistic is only available in Switch Software Release 9.3 and above. Range: 0 to (232-1) |
9082 |
Cells discarded by egress Qbin11 |
Cells received by egress Qbin11 |
Ingress-8 |
Provides a count of the cells that are discarded on Qbin 11. If Qbin 11 is not assigned a traffic service, the count returns a value of 0. Note This statistic is only available in Switch Software Release 9.3 and above. Range: 0 to (232-1) |
9083 |
Cells received by egress Qbin11 |
Number of Cells Rx |
Ingress-8 |
Provides a count of the cells that are received on Qbin 11. If Qbin 11 is not assigned a traffic service, the count returns a value of 0. Note This statistic is only available in Switch Software Release 9.3 and above. Range: 0 to (232-1) |
9084 |
Cells served out of egress Qbin12 |
Number of Cells Tx |
Egress-7 |
Provides a count of the cells that are transmitted out of Qbin 12. If Qbin 12 is not assigned a traffic service, the count returns a value of 0. Note This statistic is only available in Switch Software Release 9.3 and above. Range: 0 to (232-1) |
9085 |
Cells discarded by egress Qbin12 |
Cells received by egress Qbin12 |
Ingress-8 |
Provides a count of the cells that are discarded on Qbin 12. If Qbin 12 is not assigned a traffic service, the count returns a value of 0. Note This statistic is only available in Switch Software Release 9.3 and above. Range: 0 to (232-1) |
9086 |
Cells received by egress Qbin12 |
Number of Cells Rx |
Ingress-8 |
Provides a count of the cells that are received on Qbin 12. If Qbin 12 is not assigned a traffic service, the count returns a value of 0. Note This statistic is only available in Switch Software Release 9.3 and above. Range: 0 to (232-1) |
9087 |
Cells served out of egress Qbin13 |
Number of Cells Tx |
Egress-7 |
Provides a count of the cells that are transmitted out of Qbin 13. If Qbin 13 is not assigned a traffic service, the count returns a value of 0. Note This statistic is only available in Switch Software Release 9.3 and above. Range: 0 to (232-1) |
9088 |
Cells discarded by egress Qbin13 |
Cells received by egress Qbin13 |
Ingress-8 |
Provides a count of the cells that are discarded on Qbin 13. If Qbin 13 is not assigned a traffic service, the count returns a value of 0. Note This statistic is only available in Switch Software Release 9.3 and above. Range: 0 to (232-1) |
9089 |
Cells received by egress Qbin13 |
Number of Cells Rx |
Ingress-8 |
Provides a count of the cells that are received on Qbin 13. If Qbin 13 is not assigned a traffic service, the count returns a value of 0. Note This statistic is only available in Switch Software Release 9.3 and above. Range: 0 to (232-1) |
9090 |
Cells served out of egress Qbin14 |
Number of Cells Tx |
Egress-7 |
Provides a count of the cells that are transmitted out of Qbin 14. If Qbin 14 is not assigned a traffic service, the count returns a value of 0. Note This statistic is only available in Switch Software Release 9.3 and above. Range: 0 to (232-1) |
9091 |
Cells discarded by egress Qbin14 |
Cells received by egress Qbin14 |
Ingress-8 |
Provides a count of the cells that are discarded on Qbin 14. If Qbin 14 is not assigned a traffic service, the count returns a value of 0. Note This statistic is only available in Switch Software Release 9.3 and above. Range: 0 to (232-1) |
9092 |
Cells received by egress Qbin14 |
Number of Cells Rx |
Ingress-8 |
Provides a count of the cells that are received on Qbin 14. If Qbin 14 is not assigned a traffic service, the count returns a value of 0. Note This statistic is only available in Switch Software Release 9.3 and above. Range: 0 to (232-1) |
9093 |
Cells served out of egress Qbin 15 |
Number of Cells Tx |
Egress-7 |
Provides a count of the cells that are transmitted out of Qbin 15. If Qbin 15 is not assigned a traffic service, the count returns a value of 0. Note This statistic is only available in Switch Software Release 9.3 and above. Range: 0 to (232-1) |
9094 |
Cells discarded by egress Qbin 15 |
Cells received by egress Qbin15 |
Ingress-8 |
Provides a count of the cells that are discarded on Qbin 15. If Qbin 15 is not assigned a traffic service, the count returns a value of 0. Note This statistic is only available in Switch Software Release 9.3 and above. Range: 0 to (232-1) |
9095 |
Cells received by egress Qbin 15 |
Number of Cells Rx |
Ingress-8 |
Provides a count of the cells that are received on Qbin 15. If Qbin 15 is not assigned a traffic service, the count returns a value of 0. Note This statistic is only available in Switch Software Release 9.3 and above. Range: 0 to (232-1) |
BXM and ASI Port
This section provides information about the BXM and ASI statistics contained in the ASI Port group. These statistics are applicable to Switch Software Releases 9.2 and 9.3 on the BPX switch.
The following table lists the attributes that are common to the BXM and ASI port statistics.
Front Cards |
BXM-T3/E3, BXM-155, BXM-622 ASI-T3/E3, ASI-155, ASI-155e |
Back Cards |
BXM - BPX-T3/E3-BC, MMF-155-4/8, SMF-155-4/8 SMFLR-155-4/8, SMF-622-2, SMFLR-622-2, SMFXLR-622-2, SMF-622, SMFLR-622, SMFXLR-622 ASI - LM-3T3/3E3, LM-2OC-3-SMF, LM-2OC-3-SMFLR, LM-2OC-3-MMF |
Object Type |
3 |
Subobject Type |
1 |
Default Peak Interval |
300 seconds |
The BXM and ASI port statistics are primarily used for gathering billing data.
Some of the port statistics are measured from different qbins on the cards. The following list the type of traffic each qbin supports:
•Qbin 0—CBR
•Qbin 1—UBR/ABR
•Qbin 2—VBR-nrt
•Qbin 3—ATM
•Qbins 4-8—SVC
•Qbin 9—VBR-rt
•Qbins 10-15—Virtual switch interface (VSI)
The following table includes the description of each statistic and the point during the data flow at which the statistic gathers the appropriate information. Each measurement point refers to the corresponding point in Figure 4-1.
|
Stat ID
|
BXM and ASI Port Statistics
|
Subset of Other Stats
|
Ingress/Egress Measurement Point
|
Description
|
0 |
Unknown VPI/VCI |
No |
Ingress-2, 3 |
Provides the last unknown virtual path indicator (VPI)/virtual channel indicator (VCI) value on the port. Range: VPI/VCI value |
1 |
Cell Buffer Overflow |
— |
— |
Provides a count of the cells that are received and dropped due to an overflow in the ingress buffer. Range: 0 to (232-1) cells |
2 |
Non-zero GFC Count |
— |
— |
Provides a count of the cells received from the port that have a non-zero value for the generic flow control (GFC) field. Range: 0 to (232-1) cells |
5 |
Rx AIS Cell |
— |
— |
Provides a count of the operation, administration, and maintenance (OAM) alarm indication signal (AIS) cells that are received from the port (from the equipment connected to the port). Range: 0 to (232-1) cells |
6 |
Rx FERF Cell |
— |
— |
Provides a count of the OAM far end receive failure (FERF) cells that are received from the port (from the equipment connected to the port). Range: 0 to (232-1) cells |
7 |
Number of Cells Rx |
No |
Ingress-1 |
Provides a count of the total cells that are received at the port prior to policing and virtual channel (VC) queuing. The count is the sum of cell loss priority (CLP) cells (0+1). Range: 0 to (232-1) cells |
8 |
Number of Cells Rx
w/CLP set |
Number of Cells Rx |
Ingress-2 |
Provides a count of the total cells that are received with CLP equal to 1. Range: 0 to (232-1) cells |
9 |
Number of Cells Rx w/EFCI Set |
— |
— |
Provides a count of the cells with the explicit forward congestion indication (EFCI) bit set to 1 that are received from the ingress side (from equipment connected to the port). Range: 0 to (232-1) |
10 |
Number of BCM Cell Rx |
— |
— |
Provides a count of the bit compression multiplexor (BCM) cells that are received at the port. Range: 0 to (232-1) cells |
11 |
Number of Cells Tx |
No |
Egress-12, 13 |
Provides a count of the total cells that are transmitted to the port after VC queuing. The count includes both data and operation, administration, and maintenance (OAM) cells. Range: 0 to (232-1) cells |
12 |
OAM Cells Rx Count |
Number of Cells Rx |
Ingress-2 |
Provides a count of the total OAM cells that are received from the port. Range: 0 to (232-1) cells |
13 |
Tx Payload Err Due to BIP-16 Err |
— |
— |
Provides a count of the transmitted errors due to BIP-16 errors. Range: 0 to (232-1) cells |
14 |
Number of Cells Tx w/CLP set |
Number of Cells Tx |
Egress-12 |
Provides a count of the total cells with CLP equal to 1 that are transmitted to the port. Range: 0 to (232-1) cells |
15 |
Number of Cells Tx w/EFCI set |
— |
— |
Provides a count of the cells with an EFCI bit equal to 1that are transmitted to the port (to the equipment connected to the port). This statistic is collected after the cells are received from the bus and have passed egress queuing and servicing. Range: 0 to (232-1) |
16 |
Tx Header Err Discard |
— |
— |
Provides a count of the transmitted cells that are discarded due to errors in the header. Range: 0 to (232-1) |
17 |
Get Request Rx |
No |
Ingress-3 |
Provides a count of the Integrated Local Management Interface (ILMI) GetRequest messages that are received from the port. The count is measured after segmentation and reassembly (SAR) processing. Range: 0 to (232-1) cells |
18 |
GetNext Request Rx |
No |
Measured after SAR processing-3 |
Provides a count of the ILMI GetNextRequest messages that are received from the port. Range: 0 to (232-1) cells |
19 |
GetNext Request Tx |
No |
Measured after SAR processing-12 |
Provides a count of the ILMI GetNextRequest messages that are transmitted to the port. Range: 0 to (232-1) cells |
20 |
SetRequest Rx |
No |
Measured after SAR processing-3 |
Provides a count of the ILMI SetRequest messages that are received from the port. Range: 0 to (232-1) cells |
21 |
Trap Rx |
No |
Measured after SAR processing-3 |
Provides a count of the traps that are received from the port. Range: 0 to (232-1) cells |
22 |
Get Response Rx |
No |
Measured after SAR processing-3 |
Provides a count of the ILMI GetResponse messages that are received from the port. Range: 0 to (232-1) cells |
23 |
Get Request Tx |
No |
Measured after SAR processing-12 |
Provides a count of the ILMI GetRequest messages that are transmitted to the port. Range: 0 to (232-1) cells |
24 |
Get Response Tx |
No |
Measured after SAR processing-12 |
Provides a count of the ILMI GetResponse messages that are transmitted to the port. Range: 0 to (232-1) cells |
25 |
Trap Tx |
No |
Measured after SAR processing-12 |
Provides a count of the traps that are transmitted to the port. Range: 0 to (232-1) cells |
26 |
Unknown LMI Tx |
— |
— |
Provides a count of the Local Management Interface (LMI) Status messages that are transmitted to the port that are not understood. Range: 0 to (232-1) cells |
27 |
Status Tx |
No |
Measured after SAR processing-12 |
Provides a count of the Local Management Interface (LMI) Status messages that are transmitted to the port. Range: 0 to (232-1) cells |
28 |
Update Status Tx |
No |
Measured after SAR processing-12 |
Provides a count of the LMI UpdateStatus messages that are transmitted to the port. Range: 0 to (232-1) cells |
29 |
Status Ack Tx |
No |
Measured after SAR processing-12 |
Provides a count of the LMI Status Acknowledgement (StatusAck) messages that are transmitted to the port. Range: 0 to (232-1) cells |
30 |
Status Enq Rx |
No |
Measured after SAR processing-3 |
Provides a count of the LMI StatusEnquiry messages that are received from the port. Range: 0 to (232-1) cells |
31 |
Status Enq Tx |
No |
Measured after SAR processing-12 |
Provides a count of the LMI StatusEnquiry messages that are transmitted to the port. Range: 0 to (232-1) cells |
32 |
Status Rx |
No |
Measured after SAR processing-3 |
Provides a count of the LMI Status messages that are received from the port. Range: 0 to (232-1) cells |
33 |
Update Status Rx |
No |
Measured after SAR processing-3 |
Provides a count of the LMI UpdateStatus messages that are received from the port. Range: 0 to (232-1) cells |
34 |
Status Ack Rx |
No |
Measured after SAR processing-3 |
Provides a count of the LMI Status Acknowledgement (StatusAck) messages that are received from the port. Range: 0 to (232-1) cells |
35 |
Invalid LMI Rx |
No |
Measured after SAR processing-3 |
Provides a count of the invalid LMI protocol data units (PDUs) that are received from the port. Range: 0 to (232-1) cells |
36 |
Invalid LMI length Rx |
Invalid LMI Rx |
Measured after SAR processing-3 |
Provides a count of the invalid LMI PDU lengths that are received from the port. Range: 0 to (232-1) cells |
37 |
Unknown LMI Rx |
Invalid LMI Rx |
Measured after SAR processing-3 |
Provides a count of the unknown LMI PDUs that are received from the port. Range: 0 to (232-1) cells |
38 |
Invalid LMI IE Rx |
Invalid LMI Rx |
Measured after SAR processing-3 |
Provides a count of the LMI information elements (IEs) that are received from the port. Range: 0 to (232-1) cells |
39 |
Invalid Transaction IDs |
Invalid LMI Rx |
Measured after SAR processing-3 |
Provides a count of the invalid LMI transaction IDs that are received from the port. Range: 0 to (232-1) cells |
40 |
Cells Rx w/CLP=0 |
Number of Cells RX |
Ingress-2 |
Provides a count of the total cells with CLP equal to 0 that are received from the port. Range: 0 to (232-1) cells |
41 |
Cells Rx w/CLP=0 discarded |
Cells Rx w/CLP=0 |
Ingress-2 |
Provides a count of the total cells with CLP equal to 0 that are received from the port and then discarded. Range: 0 to (232-1) cells |
42 |
Cells Rx w/CLP discarded |
Number of Cells Rx w/CLP set |
Ingress-2 |
Provides a count of the total cells with CLP equal to 1 that are received from the port and then discarded. Range: 0 to (232-1) cells |
43 |
Cells Tx w/CLP=0 |
Number of Cells Tx |
Egress-12 |
Provides a count of the total cells with CLP equal to 0 that are transmitted to the port. Range: 0 to (232-1) cells |
44 |
Egress OAM Cell Count |
Number of Cells Tx |
Egress-13 |
Provides a count of the valid OAM cells that are transmitted to the port. Range: 0 to (232-1) cells |
45 |
Ingress RM Cell Count |
Number of Cells Rx |
Ingress-1 |
Provides a count of the valid resource management (RM) cells that are received from the port. Range: 0 to (232-1) cells |
46 |
Egress RM Cell Count |
Number of Cells Tx |
Egress-13 |
Provides a count of the valid RM cells that are transmitted to the port. Range: 0 to (232-1) cells |
9048 |
Cells served out of egress Qbin 0 |
Number of Cells Tx |
Egress-13 |
Provides a count of the cells that are transmitted out of Qbin 0. Qbin 0 is assigned to CBR traffic. Note This statistic is only applicable to Switch Software Release 9.3 and above. Range: 0 to (232-1) |
9049 |
Cells discarded by egress Qbin 0 |
Cells received by egress
Qbin 0 |
Egress-13 |
Provides a count of the cells that are discarded on Qbin 0. Qbin 0 is assigned to CBR traffic. Note This statistic is only applicable to Switch Software Release 9.3 and above. Range: 0 to (232-1) |
9050 |
Cells received by egress Qbin 0 |
Number of Cells Rx |
Egress-13 |
Provides a count of the cells that are received on Qbin 0. Qbin 0 is assigned to CBR traffic. Note This statistic is only applicable to Switch Software Release 9.3 and above. Range: 0 to (232-1) |
9051 |
Cells served out of egress Qbin 1 |
Number of Cells Tx |
Egress-13 |
Provides a count of the cells that are transmitted out of Qbin 1. Qbin 1 is assigned to UBR/ABR traffic. Note This statistic is only applicable to Switch Software Release 9.3 and above. Range: 0 to (232-1) |
9052 |
Cells discarded by egress Qbin 1 |
Cells received by egress
Qbin 1 |
Egress-13 |
Provides a count of the cells that are discarded on Qbin 1. Qbin 1 is assigned to UBR/ABR traffic. Note This statistic is only applicable to Switch Software Release 9.3 and above. Range: 0 to (232-1) |
9053 |
Cells received by egress Qbin 1 |
Number of Cells Rx |
Egress-13 |
Provides a count of the cells that are received on Qbin 1. Qbin 1 is assigned to UBR/ABR traffic. Note This statistic is only applicable to Switch Software Release 9.3 and above. Range: 0 to (232-1) |
9054 |
Cells served out of egress Qbin 2 |
Number of Cells Tx |
Egress-13 |
Provides a count of the cells that are transmitted out of Qbin 2. Qbin 2 is assigned to VBR-nrt traffic. Note This statistic is only applicable to Switch Software Release 9.3 and above. Range: 0 to (232-1) |
9055 |
Cells discarded by egress Qbin 2 |
Cells received by egress
Qbin 2 |
Egress-13 |
Provides a count of the cells that are discarded on Qbin 2. Qbin 2 is assigned to VBR-nrt traffic. Note This statistic is only applicable to Switch Software Release 9.3 and above. Range: 0 to (232-1) |
9056 |
Cells received by egress Qbin 2 |
Number of Cells Rx |
Egress-13 |
Provides a count of the cells that are received on Qbin 2. Qbin 2 is assigned to VBR-nrt traffic. Note This statistic is only applicable to Switch Software Release 9.3 and above. Range: 0 to (232-1) |
9057 |
Cells served out of egress Qbin 3 |
Number of Cells Tx |
Egress-13 |
Provides a count of the cells that are transmitted out of Qbin 3. Qbin 3 is assigned to ATM traffic. Note This statistic is only applicable to Switch Software Release 9.3 and above. Range: 0 to (232-1) |
9058 |
Cells discarded by egress Qbin 3 |
Cells received by egress
Qbin 3 |
Egress-13 |
Provides a count of the cells that are discarded on Qbin 3. Qbin 3 is assigned to ATM traffic. Note This statistic is only applicable to Switch Software Release 9.3 and above. Range: 0 to (232-1) |
9059 |
Cells received by egress Qbin 3 |
Number of Cells Rx |
Egress-13 |
Provides a count of the cells that are received on Qbin 3. Qbin 3 is assigned to ATM traffic. Note This statistic is only applicable to Switch Software Release 9.3 and above. Range: 0 to (232-1) |
9075 |
Cells served out of egress Qbin 9 |
Number of Cells Tx |
Egress-13 |
Provides a count of the cells that are transmitted out of Qbin 9. Qbin 9 is assigned to VBR-rt traffic. Note This statistic is only applicable to Switch Software Release 9.3 and above. Range: 0 to (232-1) |
9076 |
Cells discarded by egress Qbin 9 |
Cells received by egress
Qbin 9 |
Egress-13 |
Provides a count of the cells that are discarded on Qbin 9. Qbin 9 is assigned to VBR-rt traffic. Note This statistic is only applicable to Switch Software Release 9.3 and above. Range: 0 to (232-1) |
9077 |
Cells received by egress Qbin 9 |
Number of Cells Rx |
Egress-13 |
Provides a count of the cells that are received on Qbin 9. Qbin 9 is assigned to VBR-rt traffic. Note This statistic is only applicable to Switch Software Release 9.3 and above. Range: 0 to (232-1) |
9078 |
Cells served out of egress Qbin10 |
Number of Cells Tx |
Egress-13 |
Provides a count of the cells that are transmitted out of Qbin 10. Qbin 10 is assigned to multiprotocol label switching (MPLS) traffic. Note This statistic is only applicable to Switch Software Release 9.3 and above. Range: 0 to (232-1) |
9079 |
Cells discarded by egress Qbin10 |
Cells received by egress Qbin10 |
Egress-13 |
Provides a count of the cells that are discarded on Qbin 10. Qbin 10 is assigned to MPLS traffic. Note This statistic is only applicable to Switch Software Release 9.3 and above. Range: 0 to (232-1) |
9080 |
Cells received by egress Qbin 10 |
Number of Cells Rx |
Egress-13 |
Provides a count of the cells that are received on Qbin 10. Qbin 10 is assigned to MPLS traffic. Note This statistic is only applicable to Switch Software Release 9.3 and above. Range: 0 to (232-1) |
9081 |
Cells served out of egress Qbin11 |
Number of Cells Tx |
Egress-13 |
Provides a count of the cells that are transmitted out of Qbin 11. If Qbin 11 is not assigned a traffic service, the count returns a value of 0. Note This statistic is only applicable to Switch Software Release 9.3 and above. Range: 0 to (232-1) |
9082 |
Cells discarded by egress Qbin11 |
Cells received by egress Qbin11 |
Egress-13 |
Provides a count of the cells that are discarded on Qbin 11. If Qbin 11 is not assigned a traffic service, the count returns a value of 0. Note This statistic is only applicable to Switch Software Release 9.3 and above. Range: 0 to (232-1) |
9083 |
Cells received by egress Qbin11 |
Number of Cells Rx |
Egress-13 |
Provides a count of the cells that are received on Qbin 11. If Qbin 11 is not assigned a traffic service, the count returns a value of 0. Note This statistic is only applicable to Switch Software Release 9.3 and above. Range: 0 to (232-1) |
9084 |
Cells served out of egress Qbin12 |
Number of Cells Tx |
Egress-13 |
Provides a count of the cells that are transmitted out of Qbin 12. If Qbin 12 is not assigned a traffic service, the count returns a value of 0. Note This statistic is only applicable to Switch Software Release 9.3 and above. Range: 0 to (232-1) |
9085 |
Cells discarded by egress Qbin12 |
Cells received by egress Qbin12 |
Egress-13 |
Provides a count of the cells that are discarded on Qbin 12. If Qbin 12 is not assigned a traffic service, the count returns a value of 0. Note This statistic is only applicable to Switch Software Release 9.3 and above. Range: 0 to (232-1) |
9086 |
Cells received by egress Qbin12 |
Number of Cells Rx |
Egress-13 |
Provides a count of the cells that are received on Qbin 12. If Qbin 12 is not assigned a traffic service, the count returns a value of 0. Note This statistic is only applicable to Switch Software Release 9.3 and above. Range: 0 to (232-1) |
9087 |
Cells served out of egress Qbin13 |
Number of Cells Tx |
Egress-13 |
Provides a count of the cells that are transmitted out of Qbin 13. If Qbin 13 is not assigned a traffic service, the count returns a value of 0. Note This statistic is only applicable to Switch Software Release 9.3 and above. Range: 0 to (232-1) |
9088 |
Cells discarded by egress Qbin13 |
Cells received by egress Qbin13 |
Egress-13 |
Provides a count of the cells that are discarded on Qbin 13. If Qbin 13 is not assigned a traffic service, the count returns a value of 0. Note This statistic is only applicable to Switch Software Release 9.3 and above. Range: 0 to (232-1) |
9089 |
Cells received by egress Qbin13 |
Number of Cells Rx |
Egress-13 |
Provides a count of the cells that are received on Qbin 13. If Qbin 13 is not assigned a traffic service, the count returns a value of 0. Note This statistic is only applicable to Switch Software Release 9.3 and above. Range: 0 to (232-1) |
9090 |
Cells served out of egress Qbin14 |
Number of Cells Tx |
Egress-13 |
Provides a count of the cells that are transmitted out of Qbin 14. If Qbin 14 is not assigned a traffic service, the count returns a value of 0. Note This statistic is only applicable to Switch Software Release 9.3 and above. Range: 0 to (232-1) |
9091 |
Cells discarded by egress Qbin14 |
Cells received by egress Qbin14 |
Egress-13 |
Provides a count of the cells that are discarded on Qbin 14. If Qbin 14 is not assigned a traffic service, the count returns a value of 0. Note This statistic is only applicable to Switch Software Release 9.3 and above. Range: 0 to (232-1) |
9092 |
Cells received by egress Qbin14 |
Number of Cells Rx |
Egress-13 |
Provides a count of the cells that are received on Qbin 14. If Qbin 14 is not assigned a traffic service, the count returns a value of 0. Note This statistic is only applicable BXM cards in Switch Software Release 9.3 and above. Range: 0 to (232-1) |
9093 |
Cells served out of egress Qbin 15 |
Number of Cells Tx |
Egress-13 |
Provides a count of the cells that are transmitted out of Qbin 15. If Qbin 15 is not assigned a traffic service, the count returns a value of 0. Note This statistic is only applicable to Switch Software Release 9.3 and above. Range: 0 to (232-1) |
9094 |
Cells discarded by egress Qbin 15 |
Cells received by egress Qbin15 |
Egress-13 |
Provides a count of the cells that are discarded on Qbin 15. If Qbin 15 is not assigned a traffic service, the count returns a value of 0. Note This statistic is only applicable to Switch Software Release 9.3 and above. Range: 0 to (232-1) |
9095 |
Cells received by egress Qbin 15 |
Number of Cells Rx |
Egress-13 |
Provides a count of the cells that are received on Qbin 15. If Qbin 15 is not assigned a traffic service, the count returns a value of 0. Note This statistic is only applicable to Switch Software Release 9.3 and above. Range: 0 to (232-1) |
FastPAD Port
This section provides information about the statistics contained in the FastPAD Port group. The following table lists the attributes that are common to the FastPAD port statistics.
Front Card |
FTM |
Back Cards |
FPC-T1, FPC-E1, FPC-V35, FPC-X21 |
Object Type |
3 |
Subobject Type |
2 |
Default Peak Interval |
300 seconds |
The FastPAD port statistics are primarily used for gathering billing and performance data.
The following table includes the description of each statistic and the point during the data flow at which the statistic gathers the appropriate information. Each measurement point refers to the corresponding point in Figure 4-1.
|
Stat ID
|
FastPAD Port Statistics
|
Subset of Other Stats
|
Ingress/Egress Measurement Point
|
Description
|
0 |
Frames Received |
No |
Ingress-1 |
Provides a count of the frames received by the FastPAD port. This statistic also increments when the received frame is invalid or discarded for any reason. Range: 0 to (232-1) |
1 |
Frames Transmitted |
No |
Egress-13 |
Provides a count of the frames that are transmitted out of the FastPAD port. Range: 0 to (232-1) |
2 |
Bytes Received |
No |
Ingress-1 |
Provides the number of bytes in the frames counted in the port Frames Received statistic. The count includes Frame Relay header and FCS/CRC bytes. Range: 0 to (232-1) |
3 |
Bytes Transmitted |
No |
Egress-13 |
Provides the number of bytes in the frames counted in the port Frames Transmitted statistic. The count includes Frame Relay header and FCS/CRC bytes. Range: 0 to (232-1) |
4 |
Frames Transmitted with FECN |
Frames Transmitted |
Egress-13 |
Provides a count of the frames with the forward explicit congestion notification (FECN) bit set that are transmitted to the CPE. The congestion can occur anywhere in the network. Range: 0 to (232-1) |
5 |
Frames Transmitted with BECN |
Frames Transmitted |
Egress-13 |
Provides a count of the frames with the backward explicit congestion notification (BECN) bit set that are transmitted to the CPE. The congestion can occur anywhere in the network. Range: 0 to (232-1) |
6 |
Receive Frames CRC Errors |
Frames Received |
Ingress-1 |
Provides a count of the frames with an invalid CRC that are received from the CPE. The count includes inconsistencies in the last two bytes of the Frame Relay header. Any frame with an incorrect CRC is discarded by the network. If the CRC is incorrect because of a bit error in the DLCI field, then the error is also recorded in the Receive Frame Undefined DLCI Err statistic. Range: 0 to (232-1) |
7 |
Invalid Format Receive Frames |
Frames Received |
Ingress-1 |
Provides a count of the frames with incorrect extended address (EA) bits (the least significant bits in the two Frame Relay header bytes) that are received from the CPE. Any frame received with incorrect EA bit is discarded. Range: 0 to (232-1) |
8 |
Receive Frames Alignment Errors |
Frames Received |
Ingress-1 |
Provides a count of the frames with an incorrect total frame length that are received from the CPE. Any frame received with an incorrect alignment is discarded by the network. Range: 0 to (232-1) |
9 |
Illegal Length Receive Frames |
Frames Received |
Ingress-1 |
Provides a count of the frames with the total frame length more than 4510 bytes that are received from the CPE. The frame length includes Frame Relay header and FCS/CRC bytes. Any frame received with an invalid length is discarded by the network. Range: 0 to (232-1) |
10 |
Number of DMA Overruns |
No |
Not applicable |
Provides a count of the direct memory access (DMA) overruns on the port. Range: 0 to (232-1) |
11 |
LMI Status Enquiries |
Frames Received |
Ingress-1 |
Provides a count of the status enquiry frames that are received by the FastPAD port from the CPE as part of the selected signaling protocol. Range: 0 to (232-1) |
12 |
LMI Status Transmit Count |
Frames Transmitted |
Egress-13 |
Provides a count of the status frames that are transmitted from the FastPAD port to the CPE as part of the signaling protocol. Range: 0 to (232-1) |
13 |
LMI Status Update Count |
Frames Received |
Ingress-1 |
Provides a count of the asynchronous status update frames that are received by the FastPAD port as part of the selected signaling protocol. Range: 0 to (232-1) |
14 |
LMI Invalid Status Enquiries |
Frames Received |
Ingress-1 |
Provides a count of the status enquiry frames with an invalid format that are received from the FastPAD port as part of the selected signaling protocol. Range: 0 to (232-1) |
15 |
LMI Link Timeout Errors |
No |
Not applicable |
Provides a count of the times that the T392 polling verification timer expires before receiving a status enquiry frame. Range: 0 to (232-1) |
16 |
LMI Keepalive Sequence Errors |
No |
Ingress-1 |
Provides a count of the LMI keepalive sequence errors on the FastPAD port. Range: 0 to (232-1) |
17 |
Receive Frames Undefined DLCI Err |
Frames Received |
Ingress-1 |
Provides a count of the frames received that have a DLCI without a PVC provisioned on the FastPAD port. Any frame received with an undefined DLCI is discarded. Range: 0 to (232-1) |
18 |
DE Frames Dropped |
Frames Received |
Ingress-2 |
Provides a count of the frames received on the FastPAD port that are dropped because the DE bit is set, and the PVC ingress buffer reached the DE threshold. Range: 0 to (232-1) |
19 |
Transmit Status Enquiries |
Frames Transmitted |
Egress-13 |
Provides a count of the status enquiry frames that are transmitted to the remote network as part of the selected signaling protocol. Range: 0 to (232-1) |
20 |
Received Status Counter |
Frames Received |
Not applicable |
Provides a count of the status frames received from the remote network that are part of the selected signaling Range: 0 to (232-1) |
21 |
Asynchronous Status Counter |
Frames Received |
Not applicable |
Provides a count of the asynchronous status update frames received from the remote network that are part of the selected signaling protocol. Range: 0 to (232-1) |
22 |
Invalid Sequence Number Count |
No |
Not applicable |
Provides a count of the times discontinuity occurs with the sequence numbers contained in the status enquiry frames received from the CPE. Range: 0 to (232-1) |
23 |
Transmit Protocol Timeout Count |
No |
Not applicable |
Provides a count of the times that the T392 polling verification timer expires without receiving a status frame from the CPE. Range: 0 to (232-1) |
24 |
CLLM Message Frames Transmitted |
No |
Egress-13 |
Provides a count of the consolidated link layer message (CLLM) frames transmitted over the NNI port. Range: 0 to (232-1) |
25 |
CLLM Message Bytes Transmitted |
No |
Egress-13 |
Provides a count of the CLLM bytes transmitted over the NNI port. Range: 0 to (232-1) |
26 |
CLLM Message Frames Received |
No |
Ingress-1 |
Provides a count of the CLLM frames received by the NNI port. Range: 0 to (232-1) |
27 |
CLLM Message Bytes Received |
No |
Ingress-1 |
Provides a count of the CLLM bytes received by the NNI port. Range: 0 to (232-1) |
28 |
CLLM Failures |
No |
Ingress-1 |
Provides a count of the CLLM timeouts with no messages that are received. Range: 0 to (232-1) |
29 |
Tx Frames Discarded-
Q-Overflow |
No |
Egress-12 |
Provides a count of the total frames that are discarded due to an overflow in the queue. Range: 0 to (232-1) |
30 |
Tx Bytes Discarded-
Q-Overflow |
No |
Egress-12 |
Provides the number of bytes in the frames counted in the Tx Frames Discarded-Q-Overflow statistic. The count includes Frame Relay header and FCS/CRC bytes. Range: 0 to (232-1) |
31 |
Tx Frames while Ingress LMI Fail |
No |
Egress-13 |
Provides a count of the frames that are discarded while the LMI signaling protocol on the local port is in a failed state. Range: 0 to (232-1) |
32 |
Tx Bytes while Ingress LMI Fail |
Bytes Transmitted |
Egress-13 |
Provides the number of bytes in the frames counted in the Tx Frames while Ingress LMI Fail statistic. The count includes Frame Relay header and FCS/CRC bytes. Range: 0 to (232-1) |
FRSM Port
This section provides information about the Frame Relay statistics contained in the MGX Frame Relay Port group. The statistics in this group are applicable to the FRSM card on the MGX 8220, MGX 8230, MGX 8250, and MGX 8850 Release 1 nodes.
The following table lists the attributes that are common to the FRSM port statistics.
Front Cards |
FRSM-8T1, FRSM-8E1, FRSM-2CT3, FRSM-2T3, FRSM-2E3, FRSM-HS2, FRSM-HS1 |
Back Cards |
RJ48-8T1, RJ48-8E1, BNC-2T3, BNC-2E3, SCSC2-2HSSI |
Object Type |
3 |
Subobject Type |
3 |
Default Peak Interval |
300 seconds |
The FRSM port statistics are primarily used for gathering billing and performance data.
The following table includes the description of each statistic and the point during the data flow at which the statistic gathers the appropriate information. Each measurement point refers to the corresponding point in Figure 4-1, with the exception of the following ingress points:
•1—Frame is validated against errors at the port level, for example CRC, alignment errors, and undefined DCLI.
•2—Frame is checked for queue depth and queue threshold.
•3— Policing occurs.
•4—Frame is queued and transmitted to the cell bus in the ATM cells.
|
Stat ID
|
FRSM Port Statistics
|
Subset of Other Stats
|
Ingress/Egress Measurement Point
|
Description
|
0 |
Frames Received |
No |
Ingress-1 |
Provides a count of the frames received from the customer premises equipment (CPE). The count includes signaling protocol frames that are received from the CPE. This statistic also increments when the received frame is invalid or discarded for any reason. Range: 0 to (232-1) |
1 |
Frames Transmitted |
No |
Egress-13 |
Provides a count of the frames that are transmitted to the CPE. The count includes signaling protocol frames transmitted to the CPE. Range: 0 to (232-1) |
2 |
Bytes Received |
No |
Ingress-1 |
Provides the number of bytes in the frames counted in the port Frames Received statistic. The count includes Frame Relay header and FCS/CRC bytes. Range: 0 to (232-1) |
3 |
Bytes Transmitted |
No |
Egress-13 |
Provides the number of bytes in the frames counted in the port Frames Transmitted statistic. The count includes Frame Relay header and FCS/CRC bytes. Range: 0 to (232-1) |
4 |
Frames Transmitted with FECN |
Frames Transmitted |
Egress-13 |
Provides a count of the frames with the forward explicit congestion notification (FECN) bit set. These frames are transmitted to the CPE. The congestion can occur anywhere in the network. Range: 0 to (232-1) |
5 |
Frames Transmitted with BECN |
Frames Transmitted |
Egress-13 |
Provides a count of the frames with the backward explicit congestion notification (BECN) bit. These frames are transmitted to the CPE. The congestion can occur anywhere in the network. Range: 0 to (232-1) |
6 |
Receive Frames CRC Errors |
Frames Received |
Ingress-1 |
Provides a count of the frames with an invalid CRC that are received from the CPE. The CRC calculated by the FRSM card does not match the CRC provided by the CPE. The count includes inconsistencies in the last two bytes of the Frame Relay header. Any frame with an incorrect CRC is discarded by the network. If the CRC is incorrect because of a bit error in the DLCI field, then the error is also recorded in the Receive Frame with Undefined DLCI Err statistic. Range: 0 to (232-1) |
7 |
Invalid Format Receive Frames |
Frames Received |
Ingress-1 |
Provides a count of the frames with incorrect extended address (EA) bits (the least significant bits in the two Frame Relay header bytes) that are received from the CPE. The first octet equals 0, and the second octet equals 1. Any frame received with incorrect EA bit is discarded. Range: 0 to (232-1) |
8 |
Receive Frames Alignment Errors |
Frames Received |
Ingress-1 |
Provides a count of the frames with an incorrect total frame length that are received from the CPE. Any frame received with an incorrect alignment is discarded by the network. Range: 0 to (232-1) |
9 |
Illegal Length Receive Frames |
Frames Received |
Ingress-1 |
Provides a count of the frames with the total frame length more than 4510 bytes that are received from the CPE. The frame length includes Frame Relay header and FCS/CRC bytes. Any frame received with an invalid length is discarded by the network. Range: 0 to (232-1) |
11 |
LMI Status Enquiries |
Frames Received |
Ingress-1 |
Provides a count of the status enquiry frames that are received from the CPE as part of the selected signaling protocol. This statistic is valid for the signaling protocol chosen (StrataLMI, Annex A UNI, Annex D UNI, Annex A NNI, or Annex D NNI). If the configuration of the T391 timer on the CPE and FRSM is equal, the count is the same as the Received Status Counter statistic for NNI Annex A and Annex D. Range: 0 to (232-1) |
12 |
LMI Status Transmit Count |
Frames Transmitted |
Egress-13 |
Provides a count of the status frames that are transmitted to the CPE as part of the signaling protocol. This statistic is valid for the signaling protocol chosen (StrataLMI, Annex A UNI, Annex D UNI, Annex A NNI, or Annex D NNI). If the configuration of the T391 timer on the CPE and FRSM is equal, the count is the same as the Transmit Status Enquiries statistic for NNI Annex A and Annex D. Range: 0 to (232-1) |
13 |
LMI Status Update Count |
Frames Received |
Ingress-1 |
Provides a count of the asynchronous status update frames that are received from the CPE as part of the selected signaling protocol. This statistic is valid for both NNI signaling protocols (Annex A and Annex D). Range: 0 to (232-1) |
14 |
LMI Invalid Status Enquiries |
Frames Received |
Ingress-1 |
Provides a count of the status enquiry frames with an invalid format that are received from the CPE as part of the selected signaling protocol. This statistic is valid for the signaling protocol chosen (StrataLMI, Annex A UNI, Annex D UNI, Annex A NNI, or Annex D NNI). Range: 0 to (232-1) |
15 |
LMI Link Timeout Errors |
No |
Not applicable |
Provides a count of the times that the T392 polling verification timer expires before receiving a status enquiry frame. This statistic is valid for the signaling protocol chosen (StrataLMI, Annex A UNI, Annex D UNI, Annex A NNI, or Annex D NNI). Range: 0 to (232-1) |
17 |
Receive Frames Undefined DLCI Err |
Frames Received |
Ingress-1 |
Provides a count of the frames received that have a DLCI without a PVC provisioned on the port. The count includes frames received with an incorrect or disabled signaling protocol. For example, the StrataLMI signaling protocol is enabled while the CPE is generating Annex A or Annex D signaling protocol frames, or vice versa. Any frame received with an undefined DLCI is discarded. Range: 0 to (232-1) |
18 |
DE Frames Dropped |
Frames Received |
Ingress-2 |
Provides a count of the frames received from the CPE that are dropped because the DE bit is set, and the PVC ingress buffer reached the DE threshold. Range: 0 to (232-1) |
19 |
Transmit Status Enquiries |
Frames Transmitted |
Egress-13 |
Provides a count of the status enquiry frames that are transmitted to the CPE as part of the selected signaling protocol. This statistic is valid for both NNI signaling protocols (Annex A and Annex D). If the configuration of the T391 timer on the CPE and FRSM is equal, the count is the same as the LMI Status Transmit Count statistic for NNI Annex A and Annex D. Range: 0 to (232-1) |
20 |
Received Status Counter |
Frames Received |
Not applicable |
Provides a count of the status frames received from the CPE that are part of the selected signaling protocol. This statistic is valid for both NNI signaling protocols (Annex A and Annex D). If the configuration of the T391 timer on the CPE and FRSM is equal, the count is the same as the LMI Status Enquiries statistic for NNI Annex A and Annex D. Range: 0 to (232-1) |
21 |
Asynchronous Status Counter |
Frames Received |
Not applicable |
Provides a count of the asynchronous status update frames received from the CPE that are part of the selected signaling protocol. This statistic is valid for both NNI signaling protocols (Annex A and Annex D). Range: 0 to (232-1) |
22 |
Invalid Sequence Number Count |
No |
Not applicable |
Provides a count of the times discontinuity occurs with the sequence numbers contained in the status enquiry frames received from the CPE. This statistic is valid for the signaling protocol chosen (StrataLMI, Annex A UNI, Annex D UNI, Annex A NNI, or Annex D NNI). Range: 0 to (232-1) |
23 |
Transmit Protocol Timeout Count |
No |
Not applicable |
Provides a count of the times that the T392 polling verification timer expires without receiving a status frame from the CPE. This statistic is valid for both NNI signaling protocols (Annex A NNI and Annex D NNI). Range: 0 to (232-1) |
29 |
Tx Frames Discarded-
Q-Overflow |
No |
Egress-12 |
Provides a count of the total frames that are discarded due to an overflow in the queue. Range: 0 to (232-1) |
30 |
Tx Bytes Discarded-
Q-Overflow |
No |
Egress-12 |
Provides the number of bytes in the frames counted in the Tx Frames Discarded-Q-Overflow statistic. The count includes Frame Relay header and FCS/CRC bytes. Range: 0 to (232-1) |
31 |
Tx Frames while Ingress LMI Fail |
No |
Egress-13 |
Provides a count of the frames that are discarded while the LMI signaling protocol on the local port is in a failed state. Range: 0 to (232-1) |
32 |
Tx Bytes while Ingress LMI Fail |
Bytes Transmitted |
Egress-13 |
Provides the number of bytes in the frames counted in the Tx Frames while Ingress LMI Fail statistic. The count includes Frame Relay header and FCS/CRC bytes. Range: 0 to (232-1) |
33 |
Receive NNI Sequence Mismatch |
No |
Ingress-1 |
Provides a count of the times a mismatch occurs in the sequence numbers contained in the status frames that are received from the CPE. These numbers are normally consecutive. This statistic is valid for both NNI signaling protocols (Annex A and Annex D). Range: 0 to (232-1) |
AUSM Port
This section provides information about the ATM port statistics contained in the MGX ATM Port group. The statistics in this group are applicable to the AUSM card on the MGX 8220, MGX 8230, MGX 8250, and MGX 8850 Release 1 nodes.
The following table lists the attributes that are common to the AUSM port statistics.
Front Card |
AUSM-8T1E1 Revision B |
Back Card |
LM-RJ48-8T1/LM-RJ48-8E1 |
Object Type |
3 (Port) |
Subobject Type |
4 (ATM Port) |
Default Peak Interval |
300 seconds |
The AUSM port statistics are primarily used for gathering billing and performance data.
The following table includes the description of each statistic and the point during the data flow at which the statistic gathers the appropriate information. Each measurement point refers to the corresponding point in Figure 4-1.
|
Stat ID
|
AUSM Port Statistics
|
Subset of Other Stats
|
Ingress/Egress Measurement Point
|
Description
|
0 |
Unknown VPI/VCI |
Total Cells Rx from Line |
Not applicable |
Provides a count of the cells received from the port that have invalid or unknown virtual path identifier (VPI)/virtual channel identifier (VCI) combinations. Range: 0 to (232-1) |
2 |
Non-zero GFC count |
Total Cells Rx from Line |
Not applicable |
Provides a count of the cells received from the port that have a non-zero value for the generic flow control (GFC) field. Range: 0 to (232-1) |
5 |
Rx AIS Cells |
No |
Before 1 |
Provides a count of the operation, administration, and maintenance (OAM) alarm indication signal (AIS) cells that are received from the port (from the equipment connected to the port). Range: 0 to (232-1) |
6 |
Rx FERF Cells |
No |
Before 1 |
Provides a count of the OAM far end receive failure (FERF) cells that are received from the port (from the equipment connected to the port). Range: 0 to (232-1) |
14 |
Number of Cells Tx w/CLP Set |
Total Cell Tx to Line |
After the egress queuing stage-13 |
Provides a count of the cells with a cell loss priority (CLP) bit in the ATM cell header equal to 1 that are transmitted to the port (to the equipment connected to the port). This statistic is collected after the cells are received from the bus and have passed egress queuing and servicing. Range: 0 to (232-1) |
15 |
Number of Cells Tx w/EFCI Set |
Total Cell Tx to Line |
After the egress queuing stage-13 |
Provides a count of the cells with an explicit forward congestion indicator (EFCI) bit equal to 1 that are transmitted to the port (to the equipment connected to the port). This statistic is collected after the cells are received from the bus and have passed egress queuing and servicing. Range: 0 to (232-1) |
17 |
Get Request Rx |
No |
Not applicable |
Provides a count of the SNMP GetRequest messages that are received from the port (from the equipment connected to the port). Range: 0 to (232-1) |
18 |
GetNext Request Rx |
No |
Not applicable |
Provides a count of the SNMP GetNextRequest messages that are received from the port (from the equipment connected to the port). Range: 0 to (232-1) |
20 |
Set Request Rx |
No |
Not applicable |
Provides a count of the SNMP SetRequest messages that are received from the port (from the equipment connected to the port). Range: 0 to (232-1) |
21 |
Trap Rx |
No |
Not applicable |
Provides a count of the trap protocol data units (PDUs) that are received from the port (from the equipment connected to the port). Range: 0 to (232-1) |
22 |
Get Response Rx |
No |
Not applicable |
Provides a count of the SNMP GetResponse messages that are received from the port (from the equipment connected to the port). Range: 0 to (232-1) |
23 |
Get Request Tx |
No |
Not applicable |
Provides a count of the SNMP GetRequest messages that are transmitted to the port (to the equipment connected to the port). Range: 0 to (232-1) |
24 |
Get Response Tx |
No |
Not applicable |
Provides a count of the SNMP GetResponse messages that are transmitted to the port (to the equipment connected to the port). Range: 0 to (232-1) |
25 |
Trap Tx |
No |
Not applicable |
Provides a count of the trap PDUs that are transmitted to the port (to the equipment connected to the port). Range: 0 to (232-1) |
40 |
Total Cells Rx from Line |
No |
Before the policing stage-1 |
Provides a count of the total cells that are received from the port (from the equipment connected to the port). The count includes the following cell types: •Data cells that are received. •OAM cells that are received. •Cells that are dropped because of invalid VPI/VCI or GFC errors. The statistic encompasses all ingress channel statistics for the VCs on the port. Range: 0 to (232-1) |
41 |
Total Cells Tx to Line |
No |
After 13 |
Provides a count of the total cells that are transmitted to the port (to the equipment connected to the port). This statistic includes both data and OAM cells that are sent to the port. Range: 0 to (232-1) |
42 |
OAM Loopback Cells Rx |
No |
Before 1 |
Provides a count of the OAM segment loopback cells that are received from the port (from the equipment connected to the port). Range: 0 to (232-1) |
43 |
OAM Loopback Cells Tx |
No |
After 13 |
Provides a count of the OAM segment loopback cells that are transmitted to the port (to the equipment connected to the port). Range: 0 to (232-1) |
44 |
OAM CRC Err
Cells Rx |
No |
Before 1 |
Provides a count of the OAM cells with a cyclic redundancy check (CRC) error that are received from the port (from the equipment connected to the port). Range: 0 to (232-1) |
45 |
Tx AIS Cells |
No |
After 13 |
Provides a count of the OAM AIS cells that are transmitted to the port (to the equipment connected to the port). Range: 0 to (232-1) |
46 |
Discard Cells Tx for Port Alarm |
No |
After the egress queuing stage-13 |
Provides a count of the cells transmitted to a port (to equipment connected to port) that are discarded because the port is in alarm. Range: 0 to (232-1) |
47 |
SNMP PDU Received |
No |
Not applicable |
Provides a count of the SNMP PDUs that are received from the port (from the equipment connected to the port). Range: 0 to (232-1) |
48 |
Invalid PDU Rx |
No |
Not applicable |
Provides a count of the invalid PDUs that are received from the port (from equipment connected to the port). An invalid PDU is not a Get, GetNext, or Set type. Range: 0 to (232-1) |
49 |
ASN1 Parse Error |
No |
Not applicable |
Provides a count of the Integrated Local Management Interface (ILMI) PDUs with a parsing error that are received from the port. These PDUs are not parsed because of an ASN1 notation parsing error. Range: 0 to (232-1) |
50 |
No Such Name Error |
No |
Not applicable |
Provides a count of the SNMP PDUs with an undefined error that are received from the port (from the equipment connected to the port). Range: 0 to (232-1) |
51 |
Too Big Error |
No |
Not applicable |
Provides a count of the SNMP messages that are received with more than 484 bytes, the maximum size for an ILMI message. Range: 0 to (232-1) |
52 |
ACP Cells Received |
No |
Not applicable |
Provides a count of the ATM control protocol (ACP) cells that are received from the line for an IMA group. Range: 0 to (232-1) |
53 |
ACP Cells Received with CRC-10 Error |
No |
Not applicable |
Provides a count of the ACP cells with CRC-10 errors that are received from the line for an IMA group. Range: 0 to (232-1) |
54 |
ACP Cells Transmitted |
No |
Not applicable |
Provides a count of the total ACP cells that are transmitted to the line for the IMA Group. Range: 0 to (232-1) |
55 |
ACP Cell Transmission Failures |
No |
Not applicable |
Provides a count of the ACP cells not transmitted to the IMA group because memory is not available for queuing. Range: 0 to (232-1) |
56 |
HEC Errored cells received per IMA group |
No |
Not applicable |
Provides a count of the cells with header error control (HEC) errors that are received from the port by an IMA group. Range: 0 to (232-1) |
57 |
Near-end Group Failures |
No |
Not applicable |
Provides a count of the times a near-end (local end) IMA group goes from an active state to a fail state. This statistic is a local counter that is maintained per IMA group. Range: 0 to (232-1) |
58 |
Discard Qfull Rx Port |
— |
— |
Provides a count of the cells that are discarded due to transmit queue overflow. Range: 0 to (232-1) cells |
59 |
Discard CLPth Rx Port |
— |
— |
Provides a count of the CLP cells that are received at the port and then discarded. Range: 0 to (232-1) cells |
60 |
Total Cells Rx From Network |
— |
— |
Provides a count of the number of cells received from the bus. Range: 0 to (232-1) |
IGX Voice Port
This section provides information about the statistics contained in the Voice Port group. The IGX voice port statistics in this group are applicable to the CVM and UVM cards.
The following table lists the attributes that are common to the IGX voice port group statistics.
Front Cards |
CVM, UVM |
Back Cards |
BC-T1, BC-E1, BC-J1, BC-Y1, UVI-2T1, UVI-2E1, UVI-2J1 |
Object Type |
3 (Port) |
Subobject Type |
5 |
Default Peak Interval |
300 seconds |
The IGX voice port statistics are primarily used for gathering billing and performance data.
The following table includes the description of each statistic and the point during the data flow at which the statistic gathers the appropriate information. Each measurement point refers to the corresponding point in Figure 4-1.
|
Stat ID
|
IGX Voice Port Statistics
|
Subset of Other Stats
|
Ingress/Egress Measurement Point
|
Description
|
60 |
Voice Packets Transmitted |
No |
Egress-13 |
Provides a count of the total number voice packets transmitted to the network. Range: 0 to (232-1) |
61 |
Voice Packets Received |
No |
Ingress-1 |
Provides a count of the total number of voice packets received from the port. Range: 0 to (232-1) |
62 |
TS Packets Tx |
Voice Packets Transmitted |
Egress-13 |
Provides a count of the timestamped (TS) voice packets transmitted to the network. Range: 0 to (232-1) |
63 |
TS Packets Rx |
Voice Packets Received |
Ingress-1 |
Provides a count of the timestamped voice packets received from the port. Range: 0 to (232-1) |
64 |
Receive Voice Packets Lost |
Voice Packets Received |
Ingress-1 |
Provides a count of the voice packets received from the port that are lost. Range: 0 to (232-1) |
65 |
Transmit Voice Packets Replayed |
Voice Packets Transmitted |
Egress-13 |
Provides a count of the voice packets that are sent again. Range: 0 to (232-1) |
66 |
Onhooks |
No |
— |
Provides the umber of seconds onhook. Range: 0 to (232-1) |
67 |
Offhooks |
No |
— |
Provides the umber of seconds offhook. Range: 0 to (232-1) |
68 |
Seizures |
No |
— |
Provides the number of seizures. Range: 0 to (232-1) |
PXM1 Port
This section provides information about the statistics contained in the Broadband Interface group. The statistics in this group are applicable to the PXM1 card on the MGX 8230, MGX 8250, and MGX 8850 Release 1 nodes.
The following table lists the attributes that are common to all of the PXM1 port statistics.
Front Card |
PXM |
Back Card |
PXM-UI RJ-45/48, BNC, DB-15 |
Object Type |
3 (Ports) |
Subobject Type |
8 |
Default Peak Interval |
60 seconds (fixed setting) |
The PXM1 port statistics are primarily used for gathering billing and performance data.
The following table includes the description of each statistic and the point during the data flow at which the statistic gathers the appropriate information. Each measurement point refers to the corresponding point in Figure 4-1.
|
Stat ID
|
PXM1 Port Statistics
|
Subset of Other Stats
|
Ingress/Egress Measurement Point
|
Description
|
1 |
Total Cells Rx from Line |
No |
Ingress-1 |
Provides a count of the total cells (VC plus Qbin) that are received from the line. Range: 0 to (232-1) |
2 |
OAM Loopback Cells Rx |
Total Cells Rx from Line |
After validating the frame against errors-1 |
Provides a count of the total operation, administration, and maintenance (OAM) cells that are received. Range: 0 to (232-1) |
3 |
Rx RM Cells |
Total Cells Rx from Line |
After validating the frame against errors-1 |
Provides a count of the total resource management (RM) cells that are received. Range: 0 to (232-1) |
4 |
Cells Rx w/CLP=0 |
Total Cells Rx from Line |
After validating the frame against errors-1 |
Provides a count of the total cells with cell loss priority (CLP) equal to 0 that are received. Range: 0 to (232-1) |
5 |
Cells Rx w/CLP |
Total Cells Rx from Line |
After validating the frame against errors-1 |
Provides a count of the total cells with CLP equal to 1 that are received. Range: 0 to (232-1) |
6 |
Cells Rx w/CLP=0 discarded |
Cells Rx w/CLP=0 |
Ingress-2, 3 |
Provides a count of the total cells with CLP equal to 0 that are discarded at ingress. Range: 0 to (232-1) |
7 |
Cells Rx w/CLP discarded |
Cells Rx w/CLP |
Ingress-2, 3 |
Provides a count of the total cells with CLP equal to 1 that are discarded at ingress. Range: 0 to (232-1) |
8 |
OAM Loopback Cells Tx |
No |
Egress-12, 13 |
Provides a count of the total OAM cells that are transmitted. Range: 0 to (232-1) |
9 |
Tx RM Cells |
No |
Egress-12, 13 |
Provides a count of the total RM cells that are transmitted. Range: 0 to (232-1) |
10 |
Number of Cells Tx w/CLP=0 |
No |
Egress-12, 13 |
Provides a count of the total cells with CLP equal to 0 that are transmitted. Range: 0 to (232-1) |
11 |
Number of Cells Tx w/CLP Set |
No |
Egress-12, 13 |
Provides a count of the total cells with CLP equal to 1 that are transmitted. Range: 0 to (232-1) |
AXSM Port
This section provides information about the statistics contained in the AXSM_ATM_ port group. The statistics in this group are applicable to the MGX 8850 Release 2 switch.
The following table lists the attributes that are common to all of the AXSM port statistics.
Front Cards |
MGX-AXSM-16-T3E3, MGX-AXSM-16-155, MGX-AXSM-4-622, MGX-AXSM-1-2488 |
Back Cards |
MGX-SMB-8-T3, MGX-SMB-8-E3, MGX-SMB-4-155, MGX-SMFIR-8-155, MGX-SMFLR-8-155, MGX-MMF-8-155, MGX-SMFLR-2-622, MGX-SMFIR-2-622, MGX-SMFSR-1-2488, MGX-SMFLR-1-2488, MGX-SMFXLR-1-2488 |
Object Type |
3 |
Subobject Type |
9 |
Default Peak Interval |
300 seconds |
The AXSM port statistics are primarily used for gathering performance data.
The following table includes the description of each statistic and the point during the data flow at which the statistic gathers the appropriate information. Each measurement point refers to the corresponding point in Figure 4-1.
|
Stat ID
|
AXSM Port Statistics
|
Subset of Other Stats
|
Ingress/Egress Measurement Point
|
Description
|
0 |
Ingress CLP0 Cells From Policer |
No |
Ingress-3, 9 |
Provides a count of the cells with cell loss priority (CLP) equal to 0 that arrive at the queueing engine. The count includes both discarded and non-discarded cells. Range: 0 to (240-1) cells |
1 |
Ingress CLP1 Cells From Policer |
No |
Ingress-3, 9 |
Provides a count of the cells with CLP equal to 1 that arrive at the queueing engine. The count includes both discarded and non-discarded cells. Range: 0 to (240-1) cells |
2 |
Ingress CLP0 Cells Discarded (dropped) |
Ingress CLP0 Cells From Policer |
Ingress-3, 9 |
Provides a count of ingress cells with CLP equal to 0 that are discarded by the queueing engine. Range: 0 to (240-1) cells |
3 |
Ingress CLP1 Cells Discarded (dropped) |
Ingress CLP0 Cells From Policer |
Ingress-3, 9 |
Provides a count of ingress cells with CLP equal to 1 that are discarded by the queueing engine. Range: 0 to (240-1) cells |
4 |
Ingress CLP0 Cells to backplane |
No |
Ingress-3, 9 |
Provides a count of the cells with CLP equal to 0 that travel from the queueing engine to the bus. Range: 0 to (240-1) cells |
5 |
Ingress CLP1 Cells to backplane |
No |
Ingress-3, 9 |
Provides a count of the cells with CLP equal to 1 that travel from the queueing engine to the bus. Range: 0 to (240-1) cells |
6 |
Egress CLP0 Cells From backplane |
No |
Egress-6, 12 |
Provides a count of the cells with CLP equal to 0 that arrive at the queueing engine. The count includes both discarded and non-discarded cells. Range: 0 to (240-1) cells |
7 |
Egress CLP1 Cells From backplane |
No |
Egress-6, 12 |
Provides a count of the cells with CLP equal to 1 that arrive at the queueing engine. The count includes both discarded and non-discarded cells. Range: 0 to (240-1) cells |
8 |
Egress CLP0 Cells Discarded (dropped) |
Egress CLP0 Cells From backplane |
Egress-6, 12 |
Provides a count of egress cells with CLP equal to 0 that are discarded by the queueing engine. Range: 0 to (240-1) cells |
9 |
Egress CLP1 Cells Discarded (dropped) |
Egress CLP1 Cells From backplane |
Egress-6, 12 |
Provides a count of egress cells with CLP equal to 1 that are discarded by the queueing engine. Range: 0 to (240-1) cells |
10 |
Egress CLP0 Cells to port |
No |
Egress-6, 12 |
Provides a count of the cells with CLP equal to 0 that travel from the queueing engine to the line. Range: 0 to (240-1) cells |
11 |
Egress CLP1 Cells to port |
No |
Egress-6, 12 |
Provides a count of the cells with CLP equal to 1 that travel from the queueing engine to the line. Range: 0 to (240-1) cells |
12 |
Egress Total OAM Cells |
No |
Egress-6, 12 |
Provides a count of the operation, administration, and maintenance (OAM) cells that travel from the queueing engine to the line. Range: 0 to (240-1) cells |
BXM and ASI Virtual Port
This section provides information about the statistics contained in the Virtual Port group. The BXM and ASI statistics in this group are applicable to the BPX switch.
Virtual port statistics are only applicable to Switch Software Release 9.3 and above.
The following table lists the attributes that are common to the BXM and ASI virtual port statistics.
Front Cards |
BXM-T3/E3, BXM-155, BXM-622 ASI-T3/E3, ASI-155, ASI-155e |
Back Cards |
BXM - BPX-T3/E3-BC, MMF-155-4/8, SMF-155-4/8 SMFLR-155-4/8, SMF-622-2, SMFLR-622-2, SMFXLR-622-2, SMF-622, SMFLR-622, SMFXLR-622 ASI - LM-3T3/3E3, LM-2OC-3-SMF, LM-2OC-3-SMFLR, LM-2OC-3-MMF |
Object Type |
3 |
Subobject Type |
10 |
Default Peak Interval |
300 seconds |
The BXM and ASI virtual port statistics are primarily used for gathering billing data.
Some of the BXM and ASI virtual port statistics are measured from different qbins. The following list the type of traffic each qbin supports:
•Qbin 0—CBR
•Qbin 1—UBR/ABR
•Qbin 2—VBR-nrt
•Qbin 3—ATM
•Qbins 4-8—SVC
•Qbin 9—VBR-rt
•Qbins 10-15—Virtual switch interface (VSI)
The following table includes the description of each statistic and the point during the data flow at which the statistic gathers the appropriate information. Each measurement point refers to the corresponding point in Figure 4-1.
|
Stat ID
|
BXM and ASI Virtual Port Statistics
|
Subset of Other Stats
|
Ingress/Egress Measurement Point
|
Description
|
0 |
Unknown VPI/VCI |
No |
Ingress-2, 3 |
Provides the last unknown virtual path indicator (VPI)/virtual channel indicator (VCI) value on the port. Range: VPI/VCI value |
1 |
Cell Buffer Overflow |
— |
— |
Provides a count of the cells that are received and dropped due to an overflow in the buffer. Range: 0 to (232-1) cells |
2 |
Non-zero GFC Count |
— |
— |
Provides a count of the cells received from the port that have a non-zero value for the generic flow control (GFC) field. Range: 0 to (232-1) cells |
5 |
Rx AIS Cell |
— |
— |
Provides a count of the operation, administration, and maintenance (OAM) alarm indication signal (AIS) cells that are received from the port (from the equipment connected to the port). Range: 0 to (232-1) cells |
6 |
Rx FERF Cell |
— |
— |
Provides a count of the OAM far end receive failure (FERF) cells that are received from the port (from the equipment connected to the port). Range: 0 to (232-1) cells |
7 |
Number of Cells Rx |
No |
Ingress-1 |
Provides a count of the total cells that are received at the port prior to policing and virtual channel (VC) queuing. The count is the sum of cell loss priority (CLP) cells (0+1). Range: 0 to (232-1) cells |
8 |
Number of Cells Rx
w/CLP set |
Number of Cells Rx |
Ingress-2 |
Provides a count of the total cells that are received with CLP equal to 1. Range: 0 to (232-1) cells |
9 |
Number of Cells Rx w/EFCI Set |
— |
— |
Provides a count of the cells with the explicit forward congestion indication (EFCI) bit set to 1 that are received from the ingress side (from equipment connected to the port). Range: 0 to (232-1) |
10 |
Number of BCM Cell Rx |
— |
— |
Provides a count of the bit compression multiplexor (BCM) cells that are received at the port. Range: 0 to (232-1) cells |
11 |
Number of Cells Tx |
No |
Egress-12, 13 |
Provides a count of the total cells that are transmitted to the port after VC queuing. The count includes both data and operation, administration, and maintenance (OAM) cells. Range: 0 to (232-1) cells |
12 |
OAM Cells Rx Count |
Number of Cells Rx |
Ingress-2 |
Provides a count of the total OAM cells that are received from the port. Range: 0 to (232-1) cells |
13 |
Tx Payload Err Due to BIP-16 Err |
— |
— |
Provides a count of the transmitted errors due to BIP-16 errors. Range: 0 to (232-1) cells |
14 |
Number of Cells Tx w/CLP set |
Number of Cells Tx |
Egress-12 |
Provides a count of the total cells with CLP equal to 1 that are transmitted to the port. Range: 0 to (232-1) cells |
15 |
Number of Cells Tx w/EFCI set |
— |
— |
Provides a count of the cells with an EFCI bit equal to 1that are transmitted to the port (to the equipment connected to the port). This statistic is collected after the cells are received from the bus and have passed egress queuing and servicing. Range: 0 to (232-1) |
16 |
Tx Header Err Discard |
— |
— |
Provides a count of the transmitted cells that are discarded due to errors in the header. Range: 0 to (232-1) |
17 |
Get Request Rx |
No |
Ingress-3 |
Provides a count of the Integrated Local Management Interface (ILMI) GetRequest messages that are received from the port. The count is measured after segmentation and reassembly (SAR) processing. Range: 0 to (232-1) cells |
18 |
GetNext Request Rx |
No |
Measured after SAR processing-3 |
Provides a count of the ILMI GetNextRequest messages that are received from the port. Range: 0 to (232-1) cells |
19 |
GetNext Request Tx |
No |
Measured after SAR processing-12 |
Provides a count of the ILMI GetNextRequest messages that are transmitted to the port. Range: 0 to (232-1) cells |
20 |
SetRequest Rx |
No |
Measured after SAR processing-3 |
Provides a count of the ILMI SetRequest messages that are received from the port. Range: 0 to (232-1) cells |
21 |
Trap Rx |
No |
Measured after SAR processing-3 |
Provides a count of the traps that are received from the port. Range: 0 to (232-1) cells |
22 |
Get Response Rx |
No |
Measured after SAR processing-3 |
Provides a count of the ILMI GetResponse messages that are received from the port. Range: 0 to (232-1) cells |
23 |
Get Request Tx |
No |
Measured after SAR processing-12 |
Provides a count of the ILMI GetRequest messages that are transmitted to the port. Range: 0 to (232-1) cells |
24 |
Get Response Tx |
No |
Measured after SAR processing-12 |
Provides a count of the ILMI GetResponse messages that are transmitted to the port. Range: 0 to (232-1) cells |
25 |
Trap Tx |
No |
Measured after SAR processing-12 |
Provides a count of the traps that are transmitted to the port. Range: 0 to (232-1) cells |
26 |
Unknown LMI Tx |
— |
— |
Provides a count of the Local Management Interface (LMI) Status messages that are transmitted to the port that are not understood. Range: 0 to (232-1) cells |
27 |
Status Tx |
No |
Measured after SAR processing-12 |
Provides a count of the Local Management Interface (LMI) Status messages that are transmitted to the port. Range: 0 to (232-1) cells |
28 |
Update Status Tx |
No |
Measured after SAR processing-12 |
Provides a count of the LMI UpdateStatus messages that are transmitted to the port. Range: 0 to (232-1) cells |
29 |
Status Ack Tx |
No |
Measured after SAR processing-12 |
Provides a count of the LMI Status Acknowledgement (StatusAck) messages that are transmitted to the port. Range: 0 to (232-1) cells |
30 |
Status Enq Rx |
No |
Measured after SAR processing-3 |
Provides a count of the LMI StatusEnquiry messages that are received from the port. Range: 0 to (232-1) cells |
31 |
Status Enq Tx |
No |
Measured after SAR processing-12 |
Provides a count of the LMI StatusEnquiry messages that are transmitted to the port. Range: 0 to (232-1) cells |
32 |
Status Rx |
No |
Measured after SAR processing-3 |
Provides a count of the LMI Status messages that are received from the port. Range: 0 to (232-1) cells |
33 |
Update Status Rx |
No |
Measured after SAR processing-3 |
Provides a count of the LMI UpdateStatus messages that are received from the port. Range: 0 to (232-1) cells |
34 |
Status Ack Rx |
No |
Measured after SAR processing-3 |
Provides a count of the LMI Status Acknowledgement (StatusAck) messages that are received from the port. Range: 0 to (232-1) cells |
35 |
Invalid LMI Rx |
No |
Measured after SAR processing-3 |
Provides a count of the invalid LMI protocol data units (PDUs) that are received from the port. Range: 0 to (232-1) cells |
36 |
Invalid LMI length Rx |
Invalid LMI Rx |
Measured after SAR processing-3 |
Provides a count of the invalid LMI PDU lengths that are received from the port. Range: 0 to (232-1) cells |
37 |
Unknown LMI Rx |
Invalid LMI Rx |
Measured after SAR processing-3 |
Provides a count of the unknown LMI PDUs that are received from the port. Range: 0 to (232-1) cells |
38 |
Invalid LMI IE Rx |
Invalid LMI Rx |
Measured after SAR processing-3 |
Provides a count of the LMI information elements (IEs) that are received from the port. Range: 0 to (232-1) cells |
39 |
Invalid Transaction IDs |
Invalid LMI Rx |
Measured after SAR processing-3 |
Provides a count of the invalid LMI transaction IDs that are received from the port. Range: 0 to (232-1) cells |
40 |
Cells Rx w/CLP=0 |
Number of Cells RX |
Ingress-2 |
Provides a count of the total cells with CLP equal to 0 that are received from the port. Range: 0 to (232-1) cells |
41 |
Cells Rx w/CLP=0 discarded |
Cells Rx w/CLP=0 |
Ingress-2 |
Provides a count of the total cells with CLP equal to 0 that are received from the port and then discarded. Range: 0 to (232-1) cells |
42 |
Cells Rx w/CLP discarded |
Number of Cells Rx w/CLP set |
Ingress-2 |
Provides a count of the total cells with CLP equal to 1 that are received from the port and then discarded. Range: 0 to (232-1) cells |
43 |
Cells Tx w/CLP=0 |
Number of Cells Tx |
Egress-12 |
Provides a count of the total cells with CLP equal to 0 that are transmitted to the port. Range: 0 to (232-1) cells |
44 |
Egress OAM Cell Count |
Number of Cells Tx |
Egress-13 |
Provides a count of the valid OAM cells that are transmitted to the port. Range: 0 to (232-1) cells |
45 |
Ingress RM Cell Count |
Number of Cells Rx |
Ingress-1 |
Provides a count of the valid resource management (RM) cells that are received from the port. Range: 0 to (232-1) cells |
46 |
Egress RM Cell Count |
Number of Cells Tx |
Egress-13 |
Provides a count of the valid RM cells that are transmitted to the port. Range: 0 to (232-1) cells |
9048 |
Cells served out of egress Qbin 0 |
Number of Cells Tx |
Egress-13 |
Provides a count of the cells that are transmitted out of Qbin 0. Qbin 0 is assigned to CBR traffic. Range: 0 to (232-1) |
9049 |
Cells discarded by egress Qbin 0 |
Cells received by egress
Qbin 0 |
Egress-13 |
Provides a count of the cells that are discarded on Qbin 0. Qbin 0 is assigned to CBR traffic. Range: 0 to (232-1) |
9050 |
Cells received by egress Qbin 0 |
Number of Cells Rx |
Egress-13 |
Provides a count of the cells that are received on Qbin 0. Qbin 0 is assigned to CBR traffic. Range: 0 to (232-1) |
9051 |
Cells served out of egress Qbin 1 |
Number of Cells Tx |
Egress-13 |
Provides a count of the cells that are transmitted out of Qbin 1. Qbin 1 is assigned to UBR/ABR traffic. Range: 0 to (232-1) |
9052 |
Cells discarded by egress Qbin 1 |
Cells received by egress
Qbin 1 |
Egress-13 |
Provides a count of the cells that are discarded on Qbin 1. Qbin 1 is assigned to UBR/ABR traffic. Range: 0 to (232-1) |
9053 |
Cells received by egress Qbin 1 |
Number of Cells Rx |
Egress-13 |
Provides a count of the cells that are received on Qbin 1. Qbin 1 is assigned to UBR/ABR traffic. Range: 0 to (232-1) |
9054 |
Cells served out of egress Qbin 2 |
Number of Cells Tx |
Egress-13 |
Provides a count of the cells that are transmitted out of Qbin 2. Qbin 2 is assigned to VBR-nrt traffic. Range: 0 to (232-1) |
9055 |
Cells discarded by egress Qbin 2 |
Cells received by egress
Qbin 2 |
Egress-13 |
Provides a count of the cells that are discarded on Qbin 2. Qbin 2 is assigned to VBR-nrt traffic. Range: 0 to (232-1) |
9056 |
Cells received by egress Qbin 2 |
Number of Cells Rx |
Egress-13 |
Provides a count of the cells that are received on Qbin 2. Qbin 2 is assigned to VBR-nrt traffic. Range: 0 to (232-1) |
9057 |
Cells served out of egress Qbin 3 |
Number of Cells Tx |
Egress-13 |
Provides a count of the cells that are transmitted out of Qbin 3. Qbin 3 is assigned to ATM traffic. Range: 0 to (232-1) |
9058 |
Cells discarded by egress Qbin 3 |
Cells received by egress
Qbin 3 |
Egress-13 |
Provides a count of the cells that are discarded on Qbin 3. Qbin 3 is assigned to ATM traffic. Range: 0 to (232-1) |
9059 |
Cells received by egress Qbin 3 |
Number of Cells Rx |
Egress-13 |
Provides a count of the cells that are received on Qbin 3. Qbin 3 is assigned to ATM traffic. Range: 0 to (232-1) |
9075 |
Cells served out of egress Qbin 9 |
Number of Cells Tx |
Egress-13 |
Provides a count of the cells that are transmitted out of Qbin 9. Qbin 9 is assigned to VBR-rt traffic. Range: 0 to (232-1) |
9076 |
Cells discarded by egress Qbin 9 |
Cells received by egress
Qbin 9 |
Egress-13 |
Provides a count of the cells that are discarded on Qbin 9. Qbin 9 is assigned to VBR-rt traffic. Range: 0 to (232-1) |
9077 |
Cells received by egress Qbin 9 |
Number of Cells Rx |
Egress-13 |
Provides a count of the cells that are received on Qbin 9. Qbin 9 is assigned to VBR-rt traffic. Range: 0 to (232-1) |
9078 |
Cells served out of egress Qbin10 |
Number of Cells Tx |
Egress-13 |
Provides a count of the cells that are transmitted out of Qbin 10. Qbin 10 is assigned to multiprotocol label switching (MPLS) traffic. Range: 0 to (232-1) |
9079 |
Cells discarded by egress Qbin10 |
Cells received by egress Qbin10 |
Egress-13 |
Provides a count of the cells that are discarded on Qbin 10. Qbin 10 is assigned to MPLS traffic. Range: 0 to (232-1) |
9080 |
Cells received by egress Qbin10 |
Number of Cells Rx |
Egress-13 |
Provides a count of the cells that are received on Qbin 10. Qbin 10 is assigned to MPLS traffic. Range: 0 to (232-1) |
9081 |
Cells served out of egress Qbin11 |
Number of Cells Tx |
Egress-13 |
Provides a count of the cells that are transmitted out of Qbin 11. If Qbin 11 is not assigned a traffic service, the count returns a value of 0. Range: 0 to (232-1) |
9082 |
Cells discarded by egress Qbin11 |
Cells received by egress Qbin11 |
Egress-13 |
Provides a count of the cells that are discarded on Qbin 11. If Qbin 11 is not assigned a traffic service, the count returns a value of 0. Range: 0 to (232-1) |
9083 |
Cells received by egress Qbin11 |
Number of Cells Rx |
Egress-13 |
Provides a count of the cells that are received on Qbin 11. If Qbin 11 is not assigned a traffic service, the count returns a value of 0. Range: 0 to (232-1) |
9084 |
Cells served out of egress Qbin12 |
Number of Cells Tx |
Egress-13 |
Provides a count of the cells that are transmitted out of Qbin 12. If Qbin 12 is not assigned a traffic service, the count returns a value of 0. Range: 0 to (232-1) |
9085 |
Cells discarded by egress Qbin12 |
Cells received by egress Qbin12 |
Egress-13 |
Provides a count of the cells that are discarded on Qbin 12. If Qbin 12 is not assigned a traffic service, the count returns a value of 0. Range: 0 to (232-1) |
9086 |
Cells received by egress Qbin12 |
Number of Cells Rx |
Egress-13 |
Provides a count of the cells that are received on Qbin 12. If Qbin 12 is not assigned a traffic service, the count returns a value of 0. Range: 0 to (232-1) |
9087 |
Cells served out of egress Qbin13 |
Number of Cells Tx |
Egress-13 |
Provides a count of the cells that are transmitted out of Qbin 13. If Qbin 13 is not assigned a traffic service, the count returns a value of 0. Range: 0 to (232-1) |
9088 |
Cells discarded by egress Qbin13 |
Cells received by egress Qbin13 |
Egress-13 |
Provides a count of the cells that are discarded on Qbin 13. If Qbin 13 is not assigned a traffic service, the count returns a value of 0. Range: 0 to (232-1) |
9089 |
Cells received by egress Qbin13 |
Number of Cells Rx |
Egress-13 |
Provides a count of the cells that are received on Qbin 13. If Qbin 13 is not assigned a traffic service, the count returns a value of 0. Range: 0 to (232-1) |
9090 |
Cells served out of egress Qbin14 |
Number of Cells Tx |
Egress-13 |
Provides a count of the cells that are transmitted out of Qbin 14. If Qbin 14 is not assigned a traffic service, the count returns a value of 0. Range: 0 to (232-1) |
9091 |
Cells discarded by egress Qbin14 |
Cells received by egress Qbin14 |
Egress-13 |
Provides a count of the cells that are discarded on Qbin 14. If Qbin 14 is not assigned a traffic service, the count returns a value of 0. Range: 0 to (232-1) |
9092 |
Cells received by egress Qbin14 |
Number of Cells Rx |
Egress-13 |
Provides a count of the cells that are received on Qbin 14. If Qbin 14 is not assigned a traffic service, the count returns a value of 0. Range: 0 to (232-1) |
9093 |
Cells served out of egress Qbin15 |
Number of Cells Tx |
Egress-13 |
Provides a count of the cells that are transmitted out of Qbin 15. If Qbin 15 is not assigned a traffic service, the count returns a value of 0. Range: 0 to (232-1) |
9094 |
Cells discarded by egress Qbin15 |
Cells received by egress Qbin15 |
Egress-13 |
Provides a count of the cells that are discarded on Qbin 15. If Qbin 15 is not assigned a traffic service, the count returns a value of 0. Range: 0 to (232-1) |
9095 |
Cells received by egress Qbin15 |
Number of Cells Rx |
Egress-13 |
Provides a count of the cells that are received on Qbin 15. If Qbin 15 is not assigned a traffic service, the count returns a value of 0. Range: 0 to (232-1) |
AXSM-E Port
This section provides information about the statistics contained in the AXSME_ATM_port group. The AXSM-E port statistics in this group are applicable to the MGX 8850 (PXM45) switch.
The following table lists the attributes that are common to the AXSM-E port statistics.
Front Cards |
AXSM-2-622-E, AXSM-8-155-E, AXSM-16-T3E3-E |
Back Cards |
SMFLR-1-622, SMFIR-1-622, SMFLR-4-155, SMFIR-4-155, MMF-4-155, SMB-4-155, SMB-8-T3, SMB-8-E3 |
Object Type |
3 |
Subobject Type |
11 |
Allowable Peak Intervals |
60 seconds, 300 seconds |
Default Peak Interval |
300 seconds |
The AXSM-E port statistics are primarily used for gathering troubleshooting and performance data.
The tables in this section include the description of each statistic and the point during the data flow at which the statistic gathers the appropriate information. Each measurement point refers to the corresponding point in Figure 4-1.
Note AXSM-E statistics are only collected at measurement points 1, 2, and 13.
|
Stat ID
|
AXSM-E Port Statistics
|
Subset of Other Stats
|
Ingress/Egress Measurement Point
|
Description
|
0 |
CLP0 cells transmitted |
No |
After 13 |
Provides a count of the cells with CLP equal to 0 that are transmitted to the port. Range: 0 to (240-1) cells |
1 |
CLP1 cells transmitted |
No |
After 13 |
Provides a count of the total cells with CLP equal to 1 that are transmitted to the port. Range: 0 to (240-1) cells |
2 |
OAM cells transmitted |
No |
After 13 |
Provides a count of the operation, administration, and maintenance (OAM) cells that are transmitted to the port. Range: 0 to (240-1) cells |
3 |
RM cells transmitted |
No |
After 13 |
Provides a count of the resource management (RM) cells that are transmitted to the port. Range: 0 to (240-1) cells |
4 |
CLP0 cells not discarded |
No |
Ingress-1 |
Provides a count of the cells with CLP equal to 0 that are received at the port. Range: 0 to (240-1) cells |
5 |
CLP1 cells not discarded |
No |
Ingress-1 |
Provides a count of the cells with CLP equal to 1 that are received at the port. Range: 0 to (240-1) cells |
6 |
CLP0 cells discarded due to congestion |
No |
Ingress-1 |
Provides a count of the cells with CLP equal to 0 that are received at the port then discarded due to congestion. Range: 0 to (240-1) cells |
7 |
CLP1 cells discarded due to congestion |
No |
Ingress-1 |
Provides a count of the cells with CLP equal to 1 that are received at the port then discarded due to congestion. Range: 0 to (240-1) cells |
8 |
OAM cells received |
No |
Ingress-1 |
Provides a count of the OAM cells that are received at the port. Range: 0 to (240-1) cells |
9 |
RM cells received |
No |
Ingress-1 |
Provides a count of the RM cells that are received at the port. Range: 0 to (240-1) cells |
10 |
EFCI cells transmitted |
No |
Egress-13 |
Provides a count of the cells with the explicit forward congestion indication (EFCI) bit set that are transmitted to the port. Range: 0 to (240-1) cells |
11 |
EFCI cells received |
No |
Ingress-1 |
Provides a count of the cells with the EFCI bit set that are received at the port. Range: 0 to (240-1) cells |
12 |
Cells received by Qbin 0 |
— |
— |
Provides a count of the cells that are received on Qbin 0. Range: 0 to (240-1) cells |
13 |
Cells discarded by
Qbin 0 |
— |
— |
Provides a count of the cells that are discarded on Qbin 0. Range: 0 to (240-1) cells |
14 |
Cells transmitted by Qbin 0 |
— |
— |
Provides a count of the cells that are transmitted out of Qbin 0. Range: 0 to (240-1) cells |
15 |
Cells received by Qbin 1 |
— |
— |
Provides a count of the cells that are received on Qbin 1. Range: 0 to (240-1) cells |
16 |
Cells discarded by
Qbin 1 |
— |
— |
Provides a count of the cells that are discarded on Qbin 1. Range: 0 to (240-1) cells |
17 |
Cells transmitted by Qbin 1 |
— |
— |
Provides a count of the cells that are transmitted by Qbin 1. Range: 0 to (240-1) cells |
18 |
Cells received by Qbin 2 |
— |
— |
Provides a count of the cells that are received on Qbin 2. Range: 0 to (240-1) cells |
19 |
Cells discarded by
Qbin 2 |
— |
— |
Provides a count of the cells that are discarded on Qbin 2. Range: 0 to (240-1) cells |
20 |
Cells transmitted by Qbin 2 |
— |
— |
Provides a count of the cells that are transmitted by Qbin 2. Range: 0 to (240-1) cells |
21 |
Cells received by Qbin 3 |
— |
— |
Provides a count of the cells that are received on Qbin 3. Range: 0 to (240-1) cells |
22 |
Cells discarded by
Qbin 3 |
— |
— |
Provides a count of the cells that are discarded on Qbin 3. Range: 0 to (240-1) cells |
23 |
Cells transmitted by Qbin 3 |
— |
— |
Provides a count of the cells that are transmitted by Qbin 3. Range: 0 to (240-1) cells |
24 |
Cells received by Qbin 4 |
— |
— |
Provides a count of the cells that are received on Qbin 4. Range: 0 to (240-1) cells |
25 |
Cells discarded by
Qbin 4 |
— |
— |
Provides a count of the cells that are discarded on Qbin 4. Range: 0 to (240-1) cells |
26 |
Cells transmitted by Qbin 4 |
— |
— |
Provides a count of the cells that are transmitted by Qbin 4. Range: 0 to (240-1) cells |
27 |
Cells received by Qbin 5 |
— |
— |
Provides a count of the cells that are received on Qbin 5. Range: 0 to (240-1) cells |
28 |
Cells discarded by
Qbin 5 |
— |
— |
Provides a count of the cells that are discarded on Qbin 5. Range: 0 to (240-1) cells |
29 |
Cells transmitted by Qbin 5 |
— |
— |
Provides a count of the cells that are transmitted by Qbin 5. Range: 0 to (240-1) cells |
30 |
Cells received by Qbin 6 |
— |
— |
Provides a count of the cells that are received on Qbin 6. Range: 0 to (240-1) cells |
31 |
Cells discarded by
Qbin 6 |
— |
— |
Provides a count of the cells that are discarded on Qbin 6. Range: 0 to (240-1) cells |
32 |
Cells transmitted by Qbin 6 |
— |
— |
Provides a count of the cells that are transmitted by Qbin 6. Range: 0 to (240-1) cells |
33 |
Cells received by Qbin 7 |
— |
— |
Provides a count of the cells that are received on Qbin 7. Range: 0 to (240-1) cells |
34 |
Cells discarded by
Qbin 7 |
— |
— |
Provides a count of the cells that are discarded on Qbin 7. Range: 0 to (240-1) cells |
35 |
Cells transmitted by Qbin 7 |
— |
— |
Provides a count of the cells that are transmitted by Qbin 7. Range: 0 to (240-1) cells |
36 |
Cells received by Qbin 8 |
— |
— |
Provides a count of the cells that are received on Qbin 8. Range: 0 to (240-1) cells |
37 |
Cells discarded by
Qbin 8 |
— |
— |
Provides a count of the cells that are discarded on Qbin 8. Range: 0 to (240-1) cells |
38 |
Cells transmitted by Qbin 8 |
— |
— |
Provides a count of the cells that are transmitted by Qbin 8. Range: 0 to (240-1) cells |
39 |
Cells received by Qbin 9 |
— |
— |
Provides a count of the cells that are received on Qbin 9. Range: 0 to (240-1) cells |
40 |
Cells discarded by
Qbin 9 |
— |
— |
Provides a count of the cells that are discarded on Qbin 9. Range: 0 to (240-1) cells |
41 |
Cells transmitted by Qbin 9 |
— |
— |
Provides a count of the cells that are transmitted by Qbin 9. Range: 0 to (240-1) cells |
42 |
Cells received by Qbin10 |
— |
— |
Provides a count of the cells that are received on Qbin 10. Range: 0 to (240-1) cells |
43 |
Cells discarded by Qbin10 |
— |
— |
Provides a count of the cells that are discarded on Qbin 10. Range: 0 to (240-1) cells |
44 |
Cells transmitted by Qbin10 |
— |
— |
Provides a count of the cells that are transmitted by Qbin 10. Range: 0 to (240-1) cells |
45 |
Cells received by Qbin11 |
— |
— |
Provides a count of the cells that are received on Qbin 11. If Qbin 11 is not assigned a traffic service, the count returns a value of 0. Range: 0 to (240-1) cells |
46 |
Cells discarded by Qbin11 |
— |
— |
Provides a count of the cells that are discarded on Qbin 11. If Qbin 11 is not assigned a traffic service, the count returns a value of 0. Range: 0 to (240-1) cells |
47 |
Cells transmitted by Qbin11 |
— |
— |
Provides a count of the cells that are transmitted by Qbin 11. If Qbin 11 is not assigned a traffic service, the count returns a value of 0. Range: 0 to (240-1) cells |
48 |
Cells received by Qbin12 |
— |
— |
Provides a count of the cells that are received on Qbin 12. If Qbin 12 is not assigned a traffic service, the count returns a value of 0. Range: 0 to (240-1) cells |
49 |
Cells discarded by Qbin12 |
— |
— |
Provides a count of the cells that are discarded on Qbin 12. If Qbin 12 is not assigned a traffic service, the count returns a value of 0. Range: 0 to (240-1) cells |
50 |
Cells transmitted by Qbin12 |
— |
— |
Provides a count of the cells that are transmitted by Qbin 12. If Qbin 12 is not assigned a traffic service, the count returns a value of 0. Range: 0 to (240-1) cells |
51 |
Cells received by Qbin13 |
— |
— |
Provides a count of the cells that are received on Qbin 13. If Qbin 13 is not assigned a traffic service, the count returns a value of 0. Range: 0 to (240-1) cells |
52 |
Cells discarded by Qbin13 |
— |
— |
Provides a count of the cells that are discarded on Qbin 13. If Qbin 13 is not assigned a traffic service, the count returns a value of 0. Range: 0 to (240-1) cells |
53 |
Cells transmitted by Qbin13 |
— |
— |
Provides a count of the cells that are transmitted by Qbin 13. If Qbin 13 is not assigned a traffic service, the count returns a value of 0. Range: 0 to (240-1) cells |
54 |
Cells received by Qbin14 |
— |
— |
Provides a count of the cells that are received on Qbin 14. If Qbin 14 is not assigned a traffic service, the count returns a value of 0. Range: 0 to (240-1) cells |
55 |
Cells discarded by Qbin14 |
— |
— |
Provides a count of the cells that are discarded on Qbin 14. If Qbin 14 is not assigned a traffic service, the count returns a value of 0. Range: 0 to (240-1) cells |
56 |
Cells transmitted by Qbin14 |
— |
— |
Provides a count of the cells that are transmitted by Qbin 14. If Qbin 14 is not assigned a traffic service, the count returns a value of 0. Range: 0 to (240-1) cells |
57 |
Cells received by Qbin15 |
— |
— |
Provides a count of the cells that are received on Qbin 15. If Qbin 15 is not assigned a traffic service, the count returns a value of 0. Range: 0 to (240-1) cells |
58 |
Cells discarded by Qbin15 |
— |
— |
Provides a count of the cells that are discarded on Qbin 15. If Qbin 15 is not assigned a traffic service, the count returns a value of 0. Range: 0 to (240-1) cells |
59 |
Cells transmitted by Qbin15 |
— |
— |
Provides a count of the cells that are transmitted by Qbin 15. If Qbin 15 is not assigned a traffic service, the count returns a value of 0. Range: 0 to (240-1) |
PXM1E Port
This section provides information about the statistics contained in the PXM1E Port group. The PXM1E port statistics in this group are applicable to the MGX 8830 and MGX 8850 nodes.
The following table lists the attributes that are common to the PXM1E port statistics.
Front Cards |
PXM1E-8-T3E3, PXM1E-8-155, PXM1E-2-622, PXM1E-T3E3-155 (combo card) |
Back Cards |
MGX-SMB-8T3, MGX-SMB-8E3, MGX-SMFIR-8-155LC/B, MGX-SMFLR-8-155LC/B, MGB-MMF-8-155/B, MGX-SMFIR-8-155LC/C, MGX-SMFLR-8-155LC/C, MGB-MMF-8-155/C, MGX-SMFIR-2-622/B, MGX-SMFLR-2-622/B, MGX-SMFIR-2-622/C, MGX-SMFLR-2-622/C, MGX-FRU-T3E3-155 |
Object Type |
3 |
Subobject Type |
12 |
Allowable Peak Intervals |
60 seconds, 300 seconds |
Default Peak Interval |
300 seconds |
The PXM1E port statistics are primarily used for gathering troubleshooting and performance data.
The tables in this section include the description of each statistic and the point during the data flow at which the statistic gathers the appropriate information. Each measurement point refers to the corresponding point in Figure 4-1.
|
Stat ID
|
PXM1E Port Statistics
|
Subset of Other Stats
|
Ingress/Egress Measurement Point
|
Description
|
0 |
CLP0 Cells transmitted |
No |
After 13 |
Provides a count of the cells with CLP equal to 0 that are transmitted to the port. Range: 0 to (240-1) cells |
1 |
CLP1 Cells transmitted |
No |
After 13 |
Provides a count of the total cells with CLP equal to 1 that are transmitted to the port. Range: 0 to (240-1) cells |
2 |
OAM Cells transmitted |
No |
After 13 |
Provides a count of the operation, administration, and maintenance (OAM) cells that are transmitted to the port. Range: 0 to (240-1) cells |
3 |
RM Cells transmitted |
No |
After 13 |
Provides a count of the resource management (RM) cells that are transmitted to the port. Range: 0 to (240-1) cells |
4 |
CLP0 Cells received without discard |
No |
Ingress-1 |
Provides a count of the cells with CLP equal to 0 that are received at the port. Range: 0 to (240-1) cells |
5 |
CLP1 Cells received without discard |
No |
Ingress-1 |
Provides a count of the cells with CLP equal to 1 that are received at the port. Range: 0 to (240-1) cells |
6 |
CLP0 Cells discarded due to congestion |
No |
Ingress-1 |
Provides a count of the cells with CLP equal to 0 that are received at the port then discarded due to congestion. Range: 0 to (240-1) cells |
7 |
CLP1 Cells discarded due to congestion |
No |
Ingress-1 |
Provides a count of the cells with CLP equal to 1 that are received at the port then discarded due to congestion. Range: 0 to (240-1) cells |
8 |
OAM Cells received |
No |
Ingress-1 |
Provides a count of the OAM cells that are received at the port. Range: 0 to (240-1) cells |
9 |
RM Cells received |
No |
Ingress-1 |
Provides a count of the RM cells that are received at the port. Range: 0 to (240-1) cells |
10 |
EFCI Cells transmitted |
No |
Egress-13 |
Provides a count of the cells with the explicit forward congestion indication (EFCI) bit set that are transmitted to the port. Range: 0 to (240-1) cells |
11 |
EFCI Cells received |
No |
Ingress-1 |
Provides a count of the cells with the EFCI bit set that are received at the port. Range: 0 to (240-1) cells |
12 |
Cells Received for
Qbin 0 |
— |
— |
Provides a count of the cells that are received on Qbin 0. Range: 0 to (240-1) cells |
13 |
Cells discarded for
Qbin 0 |
— |
— |
Provides a count of the cells that are discarded on Qbin 0. Range: 0 to (240-1) cells |
14 |
Cells transmitted for Qbin 0 |
— |
— |
Provides a count of the cells that are transmitted out of Qbin 0. Range: 0 to (240-1) cells |
15 |
Cells Received for
Qbin 1 |
— |
— |
Provides a count of the cells that are received on Qbin 1. Range: 0 to (240-1) cells |
16 |
Cells discarded for
Qbin 1 |
— |
— |
Provides a count of the cells that are discarded on Qbin 1. Range: 0 to (240-1) cells |
17 |
Cells transmitted for Qbin 1 |
— |
— |
Provides a count of the cells that are transmitted by Qbin 1. Range: 0 to (240-1) cells |
18 |
Cells Received for Qbin 2 |
— |
— |
Provides a count of the cells that are received on Qbin 2. Range: 0 to (240-1) cells |
19 |
Cells discarded for
Qbin 2 |
— |
— |
Provides a count of the cells that are discarded on Qbin 2. Range: 0 to (240-1) cells |
20 |
Cells transmitted for Qbin 2 |
— |
— |
Provides a count of the cells that are transmitted by Qbin 2. Range: 0 to (240-1) cells |
21 |
Cells Received for
Qbin 3 |
— |
— |
Provides a count of the cells that are received on Qbin 3. Range: 0 to (240-1) cells |
22 |
Cells discarded for
Qbin 3 |
— |
— |
Provides a count of the cells that are discarded on Qbin 3. Range: 0 to (240-1) cells |
23 |
Cells transmitted for Qbin 3 |
— |
— |
Provides a count of the cells that are transmitted by Qbin 3. Range: 0 to (240-1) cells |
24 |
Cells Received for
Qbin 4 |
— |
— |
Provides a count of the cells that are received on Qbin 4. Range: 0 to (240-1) cells |
25 |
Cells discarded for
Qbin 4 |
— |
— |
Provides a count of the cells that are discarded on Qbin 4. Range: 0 to (240-1) cells |
26 |
Cells transmitted for Qbin 4 |
— |
— |
Provides a count of the cells that are transmitted by Qbin 4. Range: 0 to (240-1) cells |
27 |
Cells Received for
Qbin 5 |
— |
— |
Provides a count of the cells that are received on Qbin 5. Range: 0 to (240-1) cells |
28 |
Cells discarded for
Qbin 5 |
— |
— |
Provides a count of the cells that are discarded on Qbin 5. Range: 0 to (240-1) cells |
29 |
Cells transmitted for Qbin 5 |
— |
— |
Provides a count of the cells that are transmitted by Qbin 5. Range: 0 to (240-1) cells |
30 |
Cells Received for
Qbin 6 |
— |
— |
Provides a count of the cells that are received on Qbin 6. Range: 0 to (240-1) cells |
31 |
Cells discarded for
Qbin 6 |
— |
— |
Provides a count of the cells that are discarded on Qbin 6. Range: 0 to (240-1) cells |
32 |
Cells transmitted for Qbin 6 |
— |
— |
Provides a count of the cells that are transmitted by Qbin 6. Range: 0 to (240-1) cells |
33 |
Cells Received for
Qbin 7 |
— |
— |
Provides a count of the cells that are received on Qbin 7. Range: 0 to (240-1) cells |
34 |
Cells discarded for
Qbin 7 |
— |
— |
Provides a count of the cells that are discarded on Qbin 7. Range: 0 to (240-1) cells |
35 |
Cells transmitted for Qbin 7 |
— |
— |
Provides a count of the cells that are transmitted by Qbin 7. Range: 0 to (240-1) cells |
36 |
Cells Received for
Qbin 8 |
— |
— |
Provides a count of the cells that are received on Qbin 8. Range: 0 to (240-1) cells |
37 |
Cells discarded for
Qbin 8 |
— |
— |
Provides a count of the cells that are discarded on Qbin 8. Range: 0 to (240-1) cells |
38 |
Cells transmitted for Qbin 8 |
— |
— |
Provides a count of the cells that are transmitted by Qbin 8. Range: 0 to (240-1) cells |
39 |
Cells Received for
Qbin 9 |
— |
— |
Provides a count of the cells that are received on Qbin 9. Range: 0 to (240-1) cells |
40 |
Cells discarded for
Qbin 9 |
— |
— |
Provides a count of the cells that are discarded on Qbin 9. Range: 0 to (240-1) cells |
41 |
Cells transmitted for Qbin 9 |
— |
— |
Provides a count of the cells that are transmitted by Qbin 9. Range: 0 to (240-1) cells |
42 |
Cells Received for
Qbin 10 |
— |
— |
Provides a count of the cells that are received on Qbin 10. Range: 0 to (240-1) cells |
43 |
Cells discarded for
Qbin 10 |
— |
— |
Provides a count of the cells that are discarded on Qbin 10. Range: 0 to (240-1) cells |
44 |
Cells transmitted for Qbin 10 |
— |
— |
Provides a count of the cells that are transmitted by Qbin 10. Range: 0 to (240-1) cells |
45 |
Cells Received for
Qbin 11 |
— |
— |
Provides a count of the cells that are received on Qbin 11. If Qbin 11 is not assigned a traffic service, the count returns a value of 0. Range: 0 to (240-1) cells |
46 |
Cells discarded for
Qbin 11 |
— |
— |
Provides a count of the cells that are discarded on Qbin 11. If Qbin 11 is not assigned a traffic service, the count returns a value of 0. Range: 0 to (240-1) cells |
47 |
Cells transmitted for Qbin 11 |
— |
— |
Provides a count of the cells that are transmitted by Qbin 11. If Qbin 11 is not assigned a traffic service, the count returns a value of 0. Range: 0 to (240-1) cells |
48 |
Cells Received for
Qbin 12 |
— |
— |
Provides a count of the cells that are received on Qbin 12. If Qbin 12 is not assigned a traffic service, the count returns a value of 0. Range: 0 to (240-1) cells |
49 |
Cells discarded for
Qbin 12 |
— |
— |
Provides a count of the cells that are discarded on Qbin 12. If Qbin 12 is not assigned a traffic service, the count returns a value of 0. Range: 0 to (240-1) cells |
50 |
Cells transmitted for Qbin 12 |
— |
— |
Provides a count of the cells that are transmitted by Qbin 12. If Qbin 12 is not assigned a traffic service, the count returns a value of 0. Range: 0 to (240-1) cells |
51 |
Cells Received for
Qbin 13 |
— |
— |
Provides a count of the cells that are received on Qbin 13. If Qbin 13 is not assigned a traffic service, the count returns a value of 0. Range: 0 to (240-1) cells |
52 |
Cells discarded for
Qbin 13 |
— |
— |
Provides a count of the cells that are discarded on Qbin 13. If Qbin 13 is not assigned a traffic service, the count returns a value of 0. Range: 0 to (240-1) cells |
53 |
Cells transmitted for Qbin 13 |
— |
— |
Provides a count of the cells that are transmitted by Qbin 13. If Qbin 13 is not assigned a traffic service, the count returns a value of 0. Range: 0 to (240-1) cells |
54 |
Cells Received for
Qbin 14 |
— |
— |
Provides a count of the cells that are received on Qbin 14. If Qbin 14 is not assigned a traffic service, the count returns a value of 0. Range: 0 to (240-1) cells |
55 |
Cells discarded for
Qbin 14 |
— |
— |
Provides a count of the cells that are discarded on Qbin 14. If Qbin 14 is not assigned a traffic service, the count returns a value of 0. Range: 0 to (240-1) cells |
56 |
Cells transmitted for Qbin14 |
— |
— |
Provides a count of the cells that are transmitted by Qbin 14. If Qbin 14 is not assigned a traffic service, the count returns a value of 0. Range: 0 to (240-1) cells |
57 |
Cells Received for
Qbin 15 |
— |
— |
Provides a count of the cells that are received on Qbin 15. If Qbin 15 is not assigned a traffic service, the count returns a value of 0. Range: 0 to (240-1) cells |
58 |
Cells discarded for
Qbin 15 |
— |
— |
Provides a count of the cells that are discarded on Qbin 15. If Qbin 15 is not assigned a traffic service, the count returns a value of 0. Range: 0 to (240-1) cells |
59 |
Cells transmitted for Qbin 15 |
— |
— |
Provides a count of the cells that are transmitted by Qbin 15. If Qbin 15 is not assigned a traffic service, the count returns a value of 0. Range: 0 to (240-1) |
FRSM12 Port
This section provides information about the Frame Relay statistics contained in the FRSM12 Port group. The statistics in this group are applicable to the FRSM12 card on the MGX 8850 (PXM45) node.
The following table lists the attributes that are common to the FRSM12 port statistics.
Front Cards |
FRSM-12T3E3 |
Back Cards |
SMB-6T3, SMB-6E3 |
Object Type |
3 |
Subobject Type |
13 |
Default Peak Interval |
300 seconds |
The FRSM12 port statistics are primarily used for gathering billing and performance data.
The following table includes the description of each statistic and the point during the data flow at which the statistic gathers the appropriate information. Each measurement point refers to the corresponding point in Figure 4-1, with the exception of the following ingress points:
•1—Frame is validated against errors at the port level, for example CRC, alignment errors, and undefined DCLI.
•2—Frame is checked for queue depth and queue threshold.
•3— Policing occurs.
•4—Frame is queued and transmitted to the cell bus in the ATM cells.
|
Stat ID
|
FRSM12 Port Statistics
|
Subset of Other Stats
|
Ingress/Egress Measurement Point
|
Description
|
0 |
Frames Transmitted |
No |
Egress-13 |
Provides a count of the frames that are transmitted to the CPE. The count includes signaling protocol frames transmitted to the CPE. Range: 0 to (232-1) |
1 |
Bytes Transmitted |
No |
Egress-13 |
Provides the number of bytes in the frames counted in the port Frames Transmitted statistic. The count includes Frame Relay header and FCS/CRC bytes. Range: 0 to (232-1) |
2 |
Frames txed with FECN already set |
Frames Transmitted |
Egress-13 |
Provides a count of the frames with the forward explicit congestion notification (FECN) bit set. These frames are transmitted to the CPE. The congestion can occur anywhere in the network. Range: 0 to (232-1) |
3 |
Frames txed with BECN already set |
Frames Transmitted |
Egress-13 |
Provides a count of the frames with the backward explicit congestion notification (BECN) bit. These frames are transmitted to the CPE. The congestion can occur anywhere in the network. Range: 0 to (232-1) |
4 |
Frames txed during LMI log. port alarm |
No |
Egress-13 |
Provides a count of frames transmitted during LMI logical port alarm. Range: 0 to (232-1) |
5 |
Bytes txed during LMI log. port alarm |
No |
Egress-13 |
Provides a count of bytes transmitted during LMI logical port alarm. Range: 0 to (232-1) |
6 |
Number of Transmit Frames aborted |
No |
Egress-13 |
Provides a count of frames aborted during transmission. Range: 0 to (232-1) |
7 |
No. of Frames discarded- underrun |
No |
Egress-13 |
Provides a count of frames discarded due to under run. Range: 0 to (232-1) |
8 |
Transmit AIR in KBPS |
No |
Egress-13 |
Provides a count of the average information rate (AIR) in kbps. during transmission. Range: 0 to (232-1) |
9 |
Frames Received |
No |
Ingress-1 |
Provides a count of the frames received from the customer premises equipment (CPE). The count includes signaling protocol frames that are received from the CPE. This statistic also increments when the received frame is invalid or discarded for any reason. Range: 0 to (232-1) |
10 |
Bytes Received |
No |
Ingress-1 |
Provides the number of bytes in the frames counted in the port Frames Received statistic. The count includes Frame Relay header and FCS/CRC bytes. Range: 0 to (232-1) |
11 |
Frames Received with DE set |
No |
Ingress-1 |
Provides a count of frames with DE bit set that are received on the ingress. Range: 0 to (232-1) |
12 |
Frames Received with FECN set |
No |
Ingress-1 |
Provides a count of frames with FECN bit set that are received on the ingress. Range: 0 to (232-1) |
13 |
Frames Received with BECN set |
No |
Ingress-1 |
Provides a count of frames with BECN bit set that are received on the ingress. Range: 0 to (232-1) |
14 |
Ingress Frames
disc -illegal header |
No |
Ingress-1 |
Provides a count of frames discarded on the ingress due to illegal header. Range: 0 to (232-1) |
15 |
Frames rcvd. with Unknown DLCI |
Frames Received |
Ingress-1 |
Provides a count of the frames received that have a DLCI without a PVC provisioned on the port. The count includes frames received with an incorrect or disabled signaling protocol. For example, the StrataLMI signaling protocol is enabled while the CPE is generating Annex A or Annex D signaling protocol frames, or vice versa. Any frame received with an undefined DLCI is discarded. Range: 0 to (232-1) |
16 |
Last known DLCI received |
No |
Ingress-1 |
Provides a count of the frames with the last unknown DLCI that are received. Range: 0 to (232-1) |
17 |
Frames rcvd. with FECN tagged |
No |
Ingress-1 |
Provides a count of frames received that are tagged with FECN bit. Range: 0 to (232-1) |
18 |
Frames rcvd. with BECN tagged |
No |
Ingress-1 |
Provides a count of frames received that are tagged with BECN bit. Range: 0 to (232-1) |
19 |
Frames rcvd. with DE bit tagged |
No |
Ingress-1 |
Provides a count of frames received that are tagged with DE bit. Range: 0 to (232-1) |
20 |
Ingress Frames disc -exceeded DE Th. |
No |
Ingress-1 |
Provides a count of frames discarded on the ingress due to exceeded DE threshold. Range: 0 to (232-1) |
21 |
Recv. Frames disc- no channels |
No |
Ingress-1 |
Provides a count of frames received when no channel is setup. Range: 0 to (232-1) |
22 |
Times receiver is turned off |
No |
Ingress-1 |
Provides a count of times the receiver is turned off. Range: 0 to (232-1) |
23 |
Ingress Frames
disc -illegal length |
No |
Ingress-1 |
Provides a count of frames discarded on the ingress due to illegal length. Range: 0 to (232-1) |
24 |
Ingress Frames
disc -CRC error |
No |
Ingress-1 |
Provides a count of frames discarded on the ingress due to CRC error. Range: 0 to (232-1) |
25 |
Ingress Frames
disc -Alignment error |
No |
Ingress-1 |
Provides a count of frames discarded on the ingress due to alignment error. Range: 0 to (232-1) |
26 |
No. of Rcv Frames aborted |
No |
Ingress-1 |
Provides a count of received frames that are aborted. Range: 0 to (232-1) |
27 |
Frames discarded due to overrun |
No |
Ingress-1 |
Provides a count of frames discarded in ingress direction due to FIFO overrun in HDLC controller. Range: 0 to (232-1) |
28 |
Received AIR in Kbps |
No |
Ingress-1 |
Provides a count of the received average information rate (AIR) in kbps. Range: 0 to (232-1) |
29 |
No.of Status inquiry msgs rcvd. |
No |
Ingress-1 |
Provides a count of status inquiry messages that are received. Range: 0 to (232-1) |
30 |
No of invalid request msgs rcvd. |
No |
Ingress-1 |
Provides a count of invalid request messages that are received. Range: 0 to (232-1) |
31 |
No. of UNI msgs rcvd with seq mismatch |
No |
Ingress-1 |
Provides a count of times UNI messages with sequence number mismatches are received. Range: 0 to (232-1) |
32 |
No. of times status response msgs txed |
No |
Egress-13 |
Provides a count of times status response messages are transmitted. Range: 0 to (232-1) |
33 |
No. of times Async status res msgs txed |
No |
Egress-13 |
Provides a count of times asynchronous status messages are transmitted. Range: 0 to (232-1) |
34 |
No. of times UNI Status req not rcvd |
No |
— |
Provides a count of times UNI status requests are not received. Range: 0 to (232-1) |
35 |
No. of times Status inquiry msgs txed |
No |
Egress-13 |
Provides a count of status inquiry messages that are transmitted. Range: 0 to (232-1) |
36 |
No. of times status response msgs txed |
No |
Ingress-1 |
Provides a count of times status response messages are received. Range: 0 to (232-1) |
37 |
No. of times Async status msgs rcvd |
No |
Ingress-1 |
Provides a count of times asynchronous status messages are received. Range: 0 to (232-1) |
38 |
No. of NNI msgs rcvd with seq mismatch |
No |
Ingress-1 |
Provides a count of times NNI messages with sequence number mismatches are received. Range: 0 to (232-1) |
39 |
No. of times NNI status req not rcvd |
No |
— |
Provides a count of times NNI Status requests are not received. Range: 0 to (232-1) |
40 |
No. of CLLM frames rcvd. |
No |
Ingress-1 |
Provides a count of CLLM frames that are received. Range: 0 to (232-1) |
41 |
No. of CLLM bytes rcvd. |
No |
Ingress-1 |
Provides a count of CLLM bytes that are received. Range: 0 to (232-1) |
42 |
No. of CLLM frames txed. |
No |
Egress-13 |
Provides a count of CLLM frames that are transmitted. Range: 0 to (232-1) |
43 |
No. of CLLM bytes txed. |
No |
Egress-13 |
Provides a count of CLLM bytes that are transmitted. Range: 0 to (232-1) |
44 |
No. of times expected CLLM msg not rcvd |
No |
— |
Provides a count of times an expected CLLM message is not received. Range: 0 to (232-1) |
AXSM Card Statistics
This section provides information about the statistics contained in the AXSM_ATM_card group. The AXSM card statistics are applicable to the MGX 8850 Release 2 switch.
The following table lists the attributes that are common to the AXSM card statistics.
Front Cards |
MGX-AXSM-16-T3E3, MGX-AXSM-16-155, MGX-AXSM-4-622, MGX-AXSM-1-2488 |
Back Cards |
MGX-SMB-8-T3, MGX-SMB-8-E3, MGX-SMB-4-155, MGX-SMFIR-8-155, MGX-SMFLR-8-155, MGX-MMF-8-155, MGX-SMFLR-2-622, MGX-SMFIR-2-622, MGX-SMFSR-1-2488, MGX-SMFLR-1-2488, MGX-SMFXLR-1-2488 |
Object Type |
4 |
Subobject Type |
0 |
Default Peak Interval |
300 seconds |
The AXSM card statistics are primarily used for gathering performance data.
The following table includes the description of each statistic and the point during the data flow at which the statistic gathers the appropriate information. Each measurement point refers to the corresponding point in Figure 4-1.
|
Stat ID
|
AXSM Card Statistics
|
Subset of Other Stats
|
Ingress/Egress Measurement Point
|
Description
|
0 |
Cells to backplane - QLSI |
No |
Ingress-4, 10 |
Provides a count of the cells that are sent to the bus. Range: 0 to (240-1) cells |
1 |
Cells from queue (from QE48) |
No |
Ingress-4, 10 |
Provides a count of the cells traveling from the queueing engine to the bus. Range: 0 to (240-1) cells |
2 |
Cells from backplane - QLSI |
No |
Egress-5, 11 |
Provides a count of the cells that are received from the bus. Range: 0 to (240-1) cells |
3 |
CLP0 Cells dropped due to congestion |
No |
Ingress-3, 9 Egress-6, 12 |
Provides a count of the cells with cell loss priority (CLP) equal to 0 that are discarded due to congestion or buffer management by the queueing engine. Range: 0 to (240-1) cells |
4 |
CLP1 Cells dropped due to congestion |
No |
Ingress-3, 9 Egress-6, 12 |
Provides a count of the cells with CLP equal to 1 that are dropped due to congestion or buffer management by the queueing engine. Range: 0 to (240-1) cells |
5 |
Undefined Cells from port |
No |
Ingress-3, 9 Egress-6, 12 |
Provides a count of the undefined cells from the queuing engine. An undefined cell can be routed, but it might not be discarded. The queueing engine can not distinguish between payload or operation, administration, and maintenance (OAM) cells. Range: 0 to (240-1) cells |
6 |
Errored OAM Cells from port |
No |
Ingress-3, 9 Egress-6, 12 |
Provides a count of OAM cells that have cyclic redundancy check (CRC) errors. Range: 0 to (240-1) cells |
7 |
Invalid OAM Cells from port |
No |
Ingress-3, 9 Egress-6, 12 |
Provides a count of OAM cells with a bad cell or function type that the queueing engine is unable to decode. Range: 0 to (240-1) cells |
8 |
Unsupported OAM Cells from port |
No |
Ingress-3, 9 Egress-6, 12 |
Provides a count of unsupported OAM cells. These cells are discarded at the queuing engine. Range: 0 to (240-1) cells |
9 |
Errored RM Cells from port |
No |
Ingress-3, 9 Egress-6, 12 |
Provides a count of resource management (RM) cells that have CRC errors. Range: 0 to (240-1) cells |
IMA Statistics
The following IMA statistics are supported in CWM Release 11:
•AXSM-E IMA Group Statistics
•AXSM-E IMA Link Statistics
•PXM1E IMA Group Statistics
•PXM1E IMA Link Statistics
AXSM-E IMA Group Statistics
This section provides information about the statistics contained in the AXSME IMA Group. The AXSM-E IMA group statistics are applicable to the MGX 8830, MGX 8850 (PXM1E), and MGX 8850 (PXM45) platforms.
The following table lists the attributes that are common to the AXSM-E IMA group statistics.
Front Cards |
AXSME-32-T1E1-E |
Back Cards |
16 Port T1E1 RJ48, 16 Port E1 MCC |
Object Type |
5 |
Subobject Type |
0 |
Default Peak Interval |
300 seconds |
The following table includes the description of each statistic and the point during the data flow at which the statistic gathers the appropriate information. Each measurement point refers to the corresponding point in Figure 4-1.
|
Stat ID
|
AXSM-E IMA Group Statistics
|
Subset of Other Stats
|
Ingress/Egress Measurement Point
|
Description
|
0 |
IMA Unavailable Seconds |
— |
— |
Provides a count of the total unavailable seconds in the IMA group. Unavailable seconds are defined as 10 contiguous severely errored seconds. |
1 |
Near end failures |
— |
— |
Provides a count of the failure alarms that are received by the near end. |
2 |
Far end failures |
— |
— |
Provides a count of the failure alarms that are received by the far end. |
AXSM-E IMA Link Statistics
This section provides information about the statistics contained in the AXSME IMA Link group. The AXSM-E IMA link statistics are applicable to the MGX 8850 (PXM45) switch.
The following table lists the attributes that are common to the AXSM-E IMA link statistics.
Front Cards |
AXSME-32-T1E1-E |
Back Cards |
16 Port T1E1 RJ48, 16 Port E1 MCC |
Object Type |
5 |
Subobject Type |
1 |
Default Peak Interval |
300 seconds |
The AXSM-E IMA link statistics are primarily used for gathering performance data.
The following table includes the description of each statistic and the point during the data flow at which the statistic gathers the appropriate information. Each measurement point refers to the corresponding point in Figure 4-1.
|
Stat ID
|
AXSM-E IMA Link Statistics
|
Subset of Other Stats
|
Ingress/Egress Measurement Point
|
Description
|
18 |
ICP violations |
— |
— |
Provides a count of the IMA control protocol (ICP) cell violations that are received from the line. Range: 0 to (232-1) |
19 |
ICP OIF violations |
— |
— |
Provides a count of OIF anomalies, except during SES or UAS conditions at the near-end. Range: 0 to (232-1) |
20 |
Severely Errored Seconds |
— |
— |
Provides a count of the severely errored seconds at the near end. Severely errored seconds are classified as errored seconds that are greater than the total line bits per second multiplied by 10-6. Range: 0 to (232-1) |
21 |
FE severely errored seconds |
— |
— |
Provides a count of one second intervals containing one or more remote defect indicators (RDI) at the far end. This count does not include unavailable seconds at the far end condition. Range: 0 to (232-1) |
22 |
Unavailable Seconds |
— |
— |
Provides a count of the unavailable seconds at the near end. Unavailable seconds are defined as 10 contiguous severely errored seconds. Range: 0 to (232-1) |
23 |
FE Unavailable Seconds |
— |
— |
Provides a count of unavailable seconds at far-end. Unavailable seconds are defined as 10 contiguous severely errored seconds. Range: 0 to (232-1) |
24 |
Transmit Unusable seconds |
— |
— |
Provides a count of unusable seconds transmitted at the near-end. Range: 0 to (232-1) |
25 |
Receive Unusable seconds |
— |
— |
Provides a count of unusable seconds received at the near end. Range: 0 to (232-1) |
26 |
FE Transmit Unusable seconds |
— |
— |
Provides a count of the unusable seconds at far-end in the transmit direction. Range: 0 to (232-1) |
27 |
FE Receive Unusable seconds |
— |
— |
Provides a count of the unusable seconds at far-end in the receive direction. Range: 0 to (232-1) |
28 |
Transmit Failure |
— |
— |
Provides a count of the transmit failure alarm condition that has been entered on this link. Range: 0 to (232-1) |
29 |
Receive Failure |
— |
— |
Provides a count of the receive failure alarm condition that has been entered on this link. Range: 0 to (232-1) |
30 |
FE Transmit Failure |
— |
— |
Provides a count of the a far-end transmit failure alarm condition that has been entered on this link. Range: 0 to (232-1) |
31 |
FE Receive Failure |
— |
— |
Provides a count of the times a far-end receive failure alarm condition that has been entered on this link. Range: 0 to (232-1) |
32 |
Transmit Stuff events |
— |
— |
Provides a count of stuff events inserted in the transmit direction. Range: 0 to (232-1) |
33 |
Receive stuff event |
— |
— |
Provides a count of stuff events in the receive direction. Range: 0 to (232-1) |
PXM1E IMA Group Statistics
This section provides information about the statistics contained in the PXM1E group. The PXM1E IMA group statistics are applicable to the MGX 8830 and MGX 8850 (PXM45) switches.
The following table lists the attributes that are common to the PXM1E IMA group statistics.
Front Cards |
PXM1E-16T1E1 |
Back Cards |
16 Port T1E1 RJ48, 16 Port E1 MCC |
Object Type |
5 |
Subobject Type |
2 |
Default Peak Interval |
300 seconds |
The PXM1E IMA group statistics are primarily used for gathering performance data.
The following table includes the description of each statistic and the point during the data flow at which the statistic gathers the appropriate information. Each measurement point refers to the corresponding point in Figure 4-1.
|
Stat ID
|
PXM1E IMA Group Statistics
|
Subset of Other Stats
|
Ingress/Egress Measurement Point
|
Description
|
0 |
IMA Unavailable Seconds |
— |
— |
Provides a count of the total unavailable seconds in the IMA group. Unavailable seconds are defined as 10 contiguous severely errored seconds. Range: 0 to (232-1) |
1 |
Near end failures |
— |
— |
Provides a count of the failure alarms that are received by the near end. Range: 0 to (232-1) |
2 |
Far end failures |
— |
— |
Provides a count of the failure alarms that are received by the far end. Range: 0 to (232-1) |
PXM1E IMA Link Statistics
This section provides information about the statistics contained in the PXM1E IMA link group. The PXM1E IMA link statistics are applicable to the MGX 8830 and MGX 8850 (PXM45) switches.
The following table lists the attributes that are common to the PXM1E IMA link statistics.
Front Cards |
PXM1E-16T1E1 |
Back Cards |
16 Port T1E1 RJ48, 16 Port E1 MCC |
Object Type |
5 |
Subobject Type |
3 |
Default Peak Interval |
300 seconds |
The PXM1E IMA link statistics are primarily used for gathering performance data.
The following table includes the description of each statistic and the point during the data flow at which the statistic gathers the appropriate information. Each measurement point refers to the corresponding point in Figure 4-1.
|
Stat ID
|
PXM1E IMA Link Statistics
|
Subset of Other Stats
|
Ingress/Egress Measurement Point
|
Description
|
18 |
ICP violations |
— |
— |
Provides a count of the IMA control protocol (ICP) cell violations that are received from the line. Range: 0 to (232-1) |
19 |
ICP OIF violations |
— |
— |
Provides a count of OIF anomalies, except during SES or UAS conditions at the near-end. Range: 0 to (232-1) |
20 |
Severely Errored Seconds |
— |
— |
Provides a count of the severely errored seconds at the near end. Severely errored seconds are classified as errored seconds that are greater than the total line bits per second multiplied by 10-6. Range: 0 to (232-1) |
21 |
FE severely errored seconds |
— |
— |
Provides a count of one second intervals containing one or more remote defect indicators (RDI) at the far end. This count does not include unavailable seconds at the far end condition. Range: 0 to (232-1) |
22 |
Unavailable Seconds |
— |
— |
Provides a count of the unavailable seconds at the near end. Unavailable seconds are defined as 10 contiguous severely errored seconds. Range: 0 to (232-1) |
23 |
FE Unavailable Seconds |
— |
— |
Provides a count of unavailable seconds at far-end. Unavailable seconds are defined as 10 contiguous severely errored seconds. Range: 0 to (232-1) |
24 |
Transmit Unusable seconds |
— |
— |
Provides a count of unusable seconds transmitted at the near-end. Range: 0 to (232-1) |
25 |
Receive Unusable seconds |
— |
— |
Provides a count of unusable seconds received at the near end. Range: 0 to (232-1) |
26 |
FE Transmit Unusable seconds |
— |
— |
Provides a count of the unusable seconds at far-end in the transmit direction. Range: 0 to (232-1) |
27 |
FE Receive Unusable seconds |
— |
— |
Provides a count of the unusable seconds at far-end in the receive direction. Range: 0 to (232-1) |
28 |
Transmit Failure |
— |
— |
Provides a count of the transmit failure alarm condition that has been entered on this link. Range: 0 to (232-1) |
29 |
Receive Failure |
— |
— |
Provides a count of the receive failure alarm condition that has been entered on this link. Range: 0 to (232-1) |
30 |
FE Transmit Failure |
— |
— |
Provides a count of the a far-end transmit failure alarm condition that has been entered on this link. Range: 0 to (232-1) |
31 |
FE Receive Failure |
— |
— |
Provides a count of the times a far-end receive failure alarm condition that has been entered on this link. Range: 0 to (232-1) |
32 |
Transmit Stuff events |
— |
— |
Provides a count of stuff events inserted in the transmit direction. Range: 0 to (232-1) |
33 |
Receive stuff event |
— |
— |
Provides a count of stuff events in the receive direction. Range: 0 to (232-1) |
Physical Line Statistics
The following physical line statistics are supported in CWM Release 11:
•UXM T1 Physical Line
•UXM E1 Physical Line
•UXM T3/E3/OC3 Physical Line
•BXM and BNI T3/E3/OC3 Physical Line
•AXSM-E T1/E1 Physical Line
•AXSM-E T1/E1 Physical Line
•AXSM-E SONET Physical Line
•FRSM12 T3 Line
•FRSM12 E3 Line
•PXM1E T3 Physical Line
•PXM1E E3 Physical Line
•PXM1E SONET Physical Line
•PXM1E T1E1 Physical Line Stats
UXM T1 Physical Line
This section provides information about the UXM T1 statistics contained in the Physical Line T1 group. The statistics in this group are applicable to Switch Software Releases 9.2 and 9.3 on the IGX switch.
Note The UXM T1 physical line statistics are also applicable to the UXM-E card.
The following table lists the attributes that are common to the UXM T1 physical line statistics.
Front Card |
UXM |
Back Cards |
BC-UAI-8-T1-DB-15, BC-UAI-4-T1-DB-15 |
Object Type |
11 |
Subobject Type |
0 |
Default Peak Interval |
60 seconds (fixed setting) |
The UXM T1 physical line statistics are primarily used for gathering billing and performance data.
The following table includes the description of each statistic and the point during the data flow at which the statistic gathers the appropriate information. Each measurement point refers to the corresponding point in Figure 4-1.
|
Stat ID
|
UXM T1 Physical Line Statistics
|
Subset of Other Stats
|
Ingress/Egress Measurement Point
|
Description
|
2 |
Out of Frames |
— |
— |
Provides a count of the times an out of frame (OOF) is detected. The count includes the number of OOF alarms. Range: 0 to (232-1) |
3 |
Losses of Signal |
— |
— |
Provides a count of the times a loss of signal (LOS) is detected. The count includes the number of LOS alarms. Range: 0 to (232-1) |
61 |
Total Cells Tx to Line |
— |
— |
Provides a count of the total cells that are transmitted to the line. Range: 0 to (232-1) |
68 |
Total Cells Rx from Line |
— |
— |
Provides a count of total cells that are received from the line. Range: 0 to (232-1) |
169 |
Loss of Cell Delineation |
— |
— |
Provides a count of the loss of cell delineation defect states. Range: 0 to (232-1) |
218 |
IMA Violations |
— |
— |
Provides a count of the IMA line violations. Range: 0 to (232-1) |
219 |
Near End Severely Errored Seconds |
— |
— |
Provides a count of the near end severely errored seconds (SES) that occur within the collection interval. Severely errored seconds are classified as errored seconds that are greater than the total line bits per second multiplied by 10-6. Range: 0 to (232-1) |
220 |
Far End Severely Errored Seconds |
— |
— |
Provides a count of the far end SES that occur within the collection interval. Severely errored seconds are classified as errored seconds that are greater than the total line bits per second multiplied by 10-6. Range: 0 to (232-1) |
221 |
Near End Unavailable Seconds |
— |
— |
Provides a count of the near end unavailable seconds (UAS). UAS are defined as 10 contiguous severely errored seconds. Range: 0 to (232-1) |
222 |
Far End Unavailable Seconds |
— |
— |
Provides a count of the far end UAS. UAS are defined as 10 contiguous severely errored seconds. Range: 0 to (232-1) |
223 |
Near End Tx Unusable Seconds |
— |
— |
Provides a count of the seconds that the near end is not transmitting. Range: 0 to (232-1) |
224 |
Near End Rx Unusable Seconds |
— |
— |
Provides a count of the seconds that the near end is not receiving. Range: 0 to (232-1) |
225 |
Far End Tx Unusable Seconds |
— |
— |
Provides a count of the seconds that the far end is not transmitting. Range: 0 to (232-1) |
226 |
Far End Rx Unusable Second |
— |
— |
Provides a count of the seconds that the far end is not receiving. Range: 0 to (232-1) |
227 |
Near End Tx No. of Failure |
— |
— |
Provides a count of the failure alarms transmitted by the near end. Range: 0 to (232-1) |
228 |
Near end Rx No. of Failure |
— |
— |
Provides a count of the failure alarms that are received by the near end. Range: 0 to (232-1) |
UXM E1 Physical Line
This section provides information about the UXM E1 statistics contained in the Physical Line E1 group. The statistics in this group are applicable to Switch Software Releases 9.2 and 9.3 on the IGX switch.
Note The UXM E1 physical line statistics are also applicable to the UXM-E card.
The following table lists the attributes that are common to all of the UXM E1 physical line statistics.
Front Card |
UXM |
Back Cards |
BC-UAI-8-E1-BNC, BC-UAI-8-E1-DB-15, BC-UAI-4-E1-BNC, BC-UAI-4-E1-DB-15 |
Object Type |
11 |
Subobject Type |
1 |
Default Peak Interval |
60 seconds (fixed setting) |
The UXM E1 physical line statistics are primarily used for gathering billing and performance data.
The following table includes the description of each statistic and the point during the data flow at which the statistic gathers the appropriate information. Each measurement point refers to the corresponding point in Figure 4-1.
|
Stat ID
|
UXM E1 Physical Line Statistics
|
Subset of Other Stats
|
Ingress/Egress Measurement Point
|
Description
|
2 |
Out of Frames |
— |
— |
Provides a count of the times an out of frame (OOF) is detected. The count includes the number of OOF alarms. Range: 0 to (232-1) |
3 |
Losses of Signal |
— |
— |
Provides a count of the times a loss of signal (LOS) is detected. The count includes the number of LOS alarms. Range: 0 to (232-1) |
61 |
Total Cells Tx to Line |
— |
— |
Provides a count of the total cells that are transmitted to the line. Range: 0 to (232-1) |
68 |
Total Cells Rx from Line |
— |
— |
Provides a count of total cells that are received from the line. Range: 0 to (232-1) |
169 |
Loss of Cell Delineation |
— |
— |
Provides a count of the loss of cell delineation defect states. Range: 0 to (232-1) |
218 |
IMA Violations |
— |
— |
Provides a count of the IMA line violations. Range: 0 to (232-1) |
219 |
Near End Severely Errored Seconds |
— |
— |
Provides a count of the near end severely errored seconds (SES) that occur within the collection interval. Severely errored seconds are classified as errored seconds that are greater than the total line bits per second multiplied by 10-6. Range: 0 to (232-1) |
220 |
Far End Severely Errored Seconds |
— |
— |
Provides a count of the far end SES that occur within the collection interval. Severely errored seconds are classified as errored seconds that are greater than the total line bits per second multiplied by 10-6. Range: 0 to (232-1) |
221 |
Near End Unavailable Seconds |
— |
— |
Provides a count of the near end unavailable seconds (UAS). UAS are defined as 10 contiguous severely errored seconds. Range: 0 to (232-1) |
222 |
Far End Unavailable Seconds |
— |
— |
Provides a count of the far end UAS. UAS are defined as 10 contiguous severely errored seconds. Range: 0 to (232-1) |
223 |
Near End Tx Unusable Seconds |
— |
— |
Provides a count of the seconds that the near end is not transmitting. Range: 0 to (232-1) |
224 |
Near End Rx Unusable Seconds |
— |
— |
Provides a count of the seconds that the near end is not receiving. Range: 0 to (232-1) |
225 |
Far End Tx Unusable Seconds |
— |
— |
Provides a count of the seconds that the far end is not transmitting. Range: 0 to (232-1) |
226 |
Far End Rx Unusable Second |
— |
— |
Provides a count of the seconds that the far end is not receiving. Range: 0 to (232-1) |
227 |
Near End Tx No. of Failure |
— |
— |
Provides a count of the failure alarms transmitted by the near end. Range: 0 to (232-1) |
228 |
Near end Rx No. of Failure |
— |
— |
Provides a count of the failure alarms that are received by the near end. Range: 0 to (232-1) |
UXM T3/E3/OC3 Physical Line
This section provides information about the UXM T3/E3 and OC-3 statistics contained in the Physical Line T3/E3/OC3 group. The statistics in this group are applicable to the Switch Software Releases 9.2 and 9.3 on the IGX switch.
Note The UXM T3/E3/OC3 physical line statistics are also applicable to the UXM-E card.
The following table lists the attributes that are common to all of the UXM T3/E3/OC3 physical line statistics.
Front Cards |
UXM |
Back Cards |
UXM - BC-UAI-6-T3/E3, BC-UAI-3-T3/E3, BC-UAI-2/4-155-SMF, BC-UAI-2/4-SMFXLR, BC-UAI-4-STM1E, BC-UAI-4-155-MMF |
Object Type |
11 |
Subobject Type |
2 |
Default Peak Interval |
60 seconds (fixed setting) |
The UXM T3/E3/OC3 physical line statistics are primarily used for gathering billing and performance data.
The following table includes the description of each statistic and the point during the data flow at which the statistic gathers the appropriate information. Each measurement point refers to the corresponding point in Figure 4-1.
|
Stat ID
|
UXM T3/E3/OC3 Physical Line Statistics
|
Subset of Other Stats
|
Ingress/Egress Measurement Point
|
Description
|
2 |
Out of Frames |
— |
— |
Provides a count of the times an out of frame (OOF) is detected. The count includes the number of OOF alarms. Range: 0 to (232-1) |
3 |
Losses of Signal |
— |
— |
Provides a count of the times a loss of signal (LOS) is detected. The count includes the number of LOS alarms. Range: 0 to (232-1) |
28 |
Line Code Violations |
— |
— |
Provides a count of the line code violations that are encountered by the interface. These violations occur when more than three zeroes in a row are transmitted. Range: 0 to (232-1) |
29 |
Line Errored Seconds |
— |
— |
Provides a count of the line code violation errored seconds. Range: 0 to (232-1) |
30 |
Line Severely Errored Seconds |
— |
— |
Provides a count of the line code violation severely errored seconds (SES) that are encountered by the interface. Severely errored seconds are classified as errored seconds that are greater than the total line bits per second multiplied by 10-6. Range: 0 to (232-1) |
31 |
P-bit Parity Code Violations |
— |
— |
Provides a count of the P-bit parity codes that do not match the locally calculated parity code. Range: 0 to (232-1) |
32 |
Errored Seconds - Parity |
— |
— |
Provides a count of the seconds with at least one P-bit parity code violation. Range: 0 to (232-1) |
33 |
Severely Errored Seconds - Parity |
— |
— |
Provides a count of the P-bit parity code violation severely errored seconds (SES) that are encountered by the interface. Severely errored seconds are classified as errored seconds that are greater than the total line bits per second multiplied by 10-6. Range: 0 to (232-1) |
34 |
C-bit Parity Code Violations |
— |
— |
Provides a count of the C-bit parity code violations that do not match the locally calculated parity code. Range: 0 to (232-1) |
35 |
Errored Seconds - Path |
— |
— |
Provides a count of the C-bit parity code violation (PCV) errored seconds that are encountered by the interface. Range: 0 to (232-1) |
36 |
Severely Errored Seconds - Path |
— |
— |
Provides a count of the C-bit PCV severely errored seconds that are encountered by the interface. Severely errored seconds are classified as errored seconds that are greater than the total line bits per second multiplied by 10-6. Range: 0 to (232-1) |
37 |
Severely Errored Framing Seconds |
— |
— |
Provides a count of the severely errored framing seconds that are encountered by the interface. Range: 0 to (232-1) |
39 |
Unavailable Seconds |
— |
— |
Provides a count of the unavailable seconds (UAS). UAS are defined as 10 contiguous severely errored seconds. Range: 0 to (232-1) |
40 |
PLCP BIP-8 Errors |
— |
— |
Provides a count of the PLCP BIP-8 errors. Range: 0 to (232-1) |
41 |
BIP-8 Errored Seconds |
— |
— |
Provides a count of the BIP-8 errored seconds. Range: 0 to (232-1) |
42 |
BIP-8 Severely Errored Seconds |
— |
— |
Provides a count of the BIP-8 severely errored seconds. Range: 0 to (232-1) |
43 |
PLCP Severely Err Framing Secs |
— |
— |
Provides a count of the severely errored seconds based on PLCP framing errors. Range: 0 to (232-1) |
44 |
PLCP Unavailable Seconds |
— |
— |
Provides a count of the PLCP unavailable seconds. Range: 0 to (232-1) |
61 |
Total Cells Tx to Line |
— |
— |
Provides a count of the total cells that are transmitted to the line. Range: 0 to (232-1) |
68 |
Total Cells Rx from Line |
— |
— |
Provides a count of total cells that are received from the line. Range: 0 to (232-1) |
97 |
PLCP OOF Transition Counts |
— |
— |
Provides a count of the times the OOF is detected by the physical layer convergence protocol (PLCP) interface. Range: 0 to (232-1) |
142 |
PLCP FEBE Err Secs |
— |
— |
Provides a count of the FEBE seconds that occur within the collection interval. Range: 0 to (232-1) |
143 |
PLCP FEBE Severely Err Secs |
— |
— |
Provides a count of the FEBE severely errored seconds that occur within the collection interval. Range: 0 to (232-1) |
144 |
PLCP FEBE Counts |
— |
— |
Provides a count of the FEBEs that are encountered by the PLCP interface. Range: 0 to (232-1) |
150 |
YEL Transitions |
— |
— |
Provides a count of the times yellow alarms are detected. The count includes the number of remote alarm indicator (RAI) alarms. Range: 0 to (232-1) |
151 |
PLCP Yellow Transition Counts |
— |
— |
Provides a count of the number of times PLCP yellow defects are detected. Range: 0 to (232-1) |
152 |
Alarm Indication Signal |
— |
— |
Provides a count of the times that an alarm indication signal is detected. Range: 0 to (232-1) |
169 |
Loss of Cell Delineation |
— |
— |
Provides a count of the loss of cell delineation defect states. Range: 0 to (232-1) |
170 |
Loss of Pointer |
— |
— |
Provides a count of the loss of pointer (LOP) defect states. Range: 0 to (232-1) |
171 |
OC3 Path AIS |
— |
— |
Provides a count of the AIS instances on the path. Range: 0 to (232-1) |
172 |
OC3 Path YEL |
— |
— |
Provides a count of the times yellow alarms are detected on the path. Range: 0 to (232-1) |
173 |
Section BIP8 |
— |
— |
Provides a count of the section BIP-8 errors. Range: 0 to (232-1) |
174 |
Line BIP24 |
— |
— |
Provides a count of the line BIP-24 errors. Range: 0 to (232-1) |
175 |
Line FEBE |
— |
— |
Provides a count of the line far-end block errors (FEBE). Range: 0 to (232-1) |
176 |
Path BIP8 |
— |
— |
Provides a count of the path BIP-8 errors. Range: 0 to (232-1) |
177 |
Path FEBE |
— |
— |
Provides a count of the instances of path FEBE. Range: 0 to (232-1) |
178 |
Section BIP8 Err Secs |
— |
— |
Provides a count of the seconds that have at least one section BIP-8 error occurring within the collection interval. The counter also increments during severely errored framing (SEF) or LOS failure events. |
179 |
Line BIP24 Err Secs |
— |
— |
Provides a count of the seconds that have at least one line BIP-24 error occurring within the collection interval. The counter also increments during detection of line alarm indication signals. Range: 0 to (232-1) |
180 |
Line FEBE Err Secs |
— |
— |
Provides a count of the seconds that have at least one line FEBE. The counter also increments during line remote defect identifications (RDIs). |
181 |
Path BIP8 Err Secs |
— |
— |
Provides a count of the seconds that have at least one path BIP-8 error. The counter also increments during detection of LOP and AIS events. Range: 0 to (232-1) |
182 |
Path FEBE Err Secs |
— |
— |
Provides a count of the seconds that have at least one instance of path FEBE. The counter also increments during detection of RDI events. Range: 0 to (232-1) |
183 |
Section BIP8 Severely Err Secs |
— |
— |
Provides a count of the section BIP-8 SESs that occur within the collection interval SESs are classified as at least 2500 instances (for OC3 lines) of section BIP-8 errored seconds. The counter also increments during SEF and LOS failure events. Range: 0 to (232-1) |
184 |
Section Severely Err Framing Secs |
— |
— |
Provides a count of the section seconds that have at least 2500 instances (for OC3 lines) of out of frame (OOF). Range: 0 to (232-1) |
185 |
Line BIP24 Severely Err Secs |
— |
— |
Provides a count of the BIP-24 severely errored seconds (SESs) that occur within the collection interval. SESs are classified as at least 2500 instances (for OC3 lines) of line BIP-24 errored seconds. The counter also increments during detection of line alarm indication signals. Range: 0 to (232-1) |
186 |
Line FEBE Severely Err Secs |
— |
— |
Provides a count of the FEBE SESs. SESs are classified as at least 2500 instances (for OC3 lines) of line FEBE. The counter also increments during line RDIs. Range: 0 to (232-1) |
187 |
Path BIP8 Severely Err Secs |
— |
— |
Provides a count of the BIP-8 SESs that occur within the collection interval. SESs are classified as at least 2400 instances of path BIP-8 errored seconds. The counter also increments during detection of LOP and AIS events. Range: 0 to (232-1) |
188 |
Path FEBE Severely Err Secs |
— |
— |
Provides a count of the FEBE SESs. SESs are classified as at least 2400 instances of path FEBEs. The counter also increments during detection of RDI events. Range: 0 to (232-1) |
189 |
Line Unavailable Secs |
— |
— |
Provides a count of the seconds that the line is unavailable after the occurrence of 10 contiguous line SESs. Range: 0 to (232-1) |
190 |
Line Farend Unavailable Secs |
— |
— |
Provides a count of the far end unavailable seconds (UAS). UAS are defined as 10 contiguous severely errored seconds. Range: 0 to (232-1) |
191 |
Path Unavailable Secs |
— |
— |
Provides a count of the seconds that the line is unavailable after the occurrence of 10 contiguous path SESs. Range: 0 to (232-1) |
192 |
Path Farend Unavailable Secs |
— |
— |
Provides a count of the seconds that the line is unavailable after the occurrence of 10 contiguous path far end SESs. Range: 0 to (232-1) |
193 |
HCS Uncorrectable Error |
— |
— |
Provides a count of the HEC errors that are not correctable. Range: 0 to (232-1) |
214 |
HCS Correctable Error |
— |
— |
Provides a count of the loss of cell delineation header checksum errors that are corrected. Range: 0 to (232-1) |
BXM and BNI T3/E3/OC3 Physical Line
This section provides information about the BXM and BNI T3/E3/OC-3 statistics contained in the Physical Line T3/E3/OC3 group. The statistics in this group are applicable to Switch Software Releases 9.2 and 9.3 on the BPX switch.
The following table lists the attributes that are common to all of the BXM and BNI T3/E3/OC3 physical line statistics.
Front Cards |
BXM-T3/E3, BXM-155,BXM-622 BNI-T3/E3, BNI-OC-3 |
Back Cards |
BXM - BPX-T3/E3-BC, MMF-155-4/8, SMF-155-4/8 SMFLR-155-4/8 BNI - LM-3T3/3E, LM-OC-3-SMF/MMF/SMFL |
Object Type |
11 |
Subobject Type |
2 |
Default Peak Interval |
60 seconds (fixed setting) |
The BXM and BNI T3/E3/OC3 physical line statistics are primarily used for gathering billing and performance data.
The following table includes the description of each statistic and the point during the data flow at which the statistic gathers the appropriate information. Each measurement point refers to the corresponding point in Figure 4-1.
|
Stat ID
|
BXM and BNI T3/E3/OC3 Physical Line Statistics
|
Subset of Other Stats
|
Ingress/Egress Measurement Point
|
Description
|
2 |
Out of Frames |
— |
— |
Provides a count of the times an out of frame (OOF) is detected. The count includes the number of OOF alarms. Range: 0 to (232-1) |
3 |
Losses of Signal |
— |
— |
Provides a count of the times a loss of signal (LOS) is detected. The count includes the number of LOS alarms. Range: 0 to (232-1) |
28 |
Line Code Violations |
— |
— |
Provides a count of the line code violations that are encountered by the interface. These violations occur when more than three zeroes in a row are transmitted. Range: 0 to (232-1) |
29 |
Line Errored Seconds |
— |
— |
Provides a count of the line code violation errored seconds. Range: 0 to (232-1) |
30 |
Line Severely Errored Seconds |
— |
— |
Provides a count of the line code violation severely errored seconds (SES) that are encountered by the interface. Severely errored seconds are classified as errored seconds that are greater than the total line bits per second multiplied by 10-6. Range: 0 to (232-1) |
31 |
P-bit Parity Code Violations |
— |
— |
Provides a count of the P-bit parity codes that do not match the locally calculated parity code. Range: 0 to (232-1) |
32 |
Errored Seconds - Parity |
— |
— |
Provides a count of the seconds with at least one P-bit parity code violation. Range: 0 to (232-1) |
33 |
Severely Errored Seconds - Parity |
— |
— |
Provides a count of the P-bit parity code violation severely errored seconds (SES) that are encountered by the interface. Severely errored seconds are classified as errored seconds that are greater than the total line bits per second multiplied by 10-6. Range: 0 to (232-1) |
34 |
C-bit Parity Code Violations |
— |
— |
Provides a count of the C-bit parity code violations that do not match the locally calculated parity code. Range: 0 to (232-1) |
35 |
Errored Seconds - Path |
— |
— |
Provides a count of the C-bit parity code violation (PCV) errored seconds that are encountered by the interface. Range: 0 to (232-1) |
36 |
Severely Errored Seconds - Path |
— |
— |
Provides a count of the C-bit PCV severely errored seconds that are encountered by the interface. Severely errored seconds are classified as errored seconds that are greater than the total line bits per second multiplied by 10-6. Range: 0 to (232-1) |
37 |
Severely Errored Framing Seconds |
— |
— |
Provides a count of the severely errored framing seconds that are encountered by the interface. Range: 0 to (232-1) |
39 |
Unavailable Seconds |
— |
— |
Provides a count of the unavailable seconds (UAS). UAS are defined as 10 contiguous severely errored seconds. Range: 0 to (232-1) |
40 |
PLCP BIP-8 Errors |
— |
— |
Provides a count of the PLCP BIP-8 errors. Range: 0 to (232-1) |
41 |
BIP-8 Errored Seconds |
— |
— |
Provides a count of the BIP-8 errored seconds. Range: 0 to (232-1) |
42 |
BIP-8 Severely Errored Seconds |
— |
— |
Provides a count of the BIP-8 severely errored seconds. Range: 0 to (232-1) |
43 |
PLCP Severely Err Framing Secs |
— |
— |
Provides a count of the severely errored seconds based on PLCP framing errors. Range: 0 to (232-1) |
44 |
PLCP Unavailable Seconds |
— |
— |
Provides a count of the PLCP unavailable seconds. Range: 0 to (232-1) |
45 |
HCS Errors |
— |
— |
Provides a count of the header check sum errors. Range: 0 to (232-1) |
68 |
Total Cells Rx from Line |
— |
— |
Provides a count of total cells that are received from the line. Range: 0 to (232-1) |
97 |
PLCP OOF Transition Counts |
— |
— |
Provides a count of the times the OOF is detected by the physical layer convergence protocol (PLCP) interface. Range: 0 to (232-1) |
142 |
PLCP FEBE Err Secs |
— |
— |
Provides a count of the FEBE seconds that occur within the collection interval. Range: 0 to (232-1) |
143 |
PLCP FEBE Severely Err Secs |
— |
— |
Provides a count of the FEBE severely errored seconds that occur within the collection interval. Range: 0 to (232-1) |
144 |
PLCP FEBE Counts |
— |
— |
Provides a count of the FEBEs that are encountered by the PLCP interface. Range: 0 to (232-1) |
150 |
YEL Transitions |
— |
— |
Provides a count of the times yellow alarms are detected. The count includes the number of remote alarm indicator (RAI) alarms. Range: 0 to (232-1) |
151 |
PLCP Yellow Transition Counts |
— |
— |
Provides a count of the number of times PLCP yellow defects are detected. Range: 0 to (232-1) |
152 |
Alarm Indication Signal |
— |
— |
Provides a count of the times that an alarm indication signal is detected. Range: 0 to (232-1) |
169 |
Loss of Cell Delineation |
— |
— |
Provides a count of the loss of cell delineation defect states. Range: 0 to (232-1) |
170 |
Loss of Pointer |
— |
— |
Provides a count of the loss of pointer (LOP) defect states. Range: 0 to (232-1) |
171 |
OC3 Path AIS |
— |
— |
Provides a count of the AIS instances on the path. Range: 0 to (232-1) |
172 |
OC3 Path YEL |
— |
— |
Provides a count of the times yellow alarms are detected on the path. Range: 0 to (232-1) |
173 |
Section BIP8 |
— |
— |
Provides a count of the section BIP-8 errors. Range: 0 to (232-1) |
174 |
Line BIP24 |
— |
— |
Provides a count of the line BIP-24 errors. Range: 0 to (232-1) |
175 |
Line FEBE |
— |
— |
Provides a count of the line far-end block errors (FEBE). Range: 0 to (232-1) |
176 |
Path BIP8 |
— |
— |
Provides a count of the path BIP-8 errors. Range: 0 to (232-1) |
177 |
Path FEBE |
— |
— |
Provides a count of the instances of path FEBE. Range: 0 to (232-1) |
178 |
Section BIP8 Err Secs |
— |
— |
Provides a count of the seconds that have at least one section BIP-8 error occurring within the collection interval. The counter also increments during severely errored framing (SEF) or LOS failure events. |
179 |
Line BIP24 Err Secs |
— |
— |
Provides a count of the seconds that have at least one line BIP-24 error occurring within the collection interval. The counter also increments during detection of line alarm indication signals. Range: 0 to (232-1) |
180 |
Line FEBE Err Secs |
— |
— |
Provides a count of the seconds that have at least one line FEBE. The counter also increments during line remote defect identifications (RDIs). |
181 |
Path BIP8 Err Secs |
— |
— |
Provides a count of the seconds that have at least one path BIP-8 error. The counter also increments during detection of LOP and AIS events. Range: 0 to (232-1) |
182 |
Path FEBE Err Secs |
— |
— |
Provides a count of the seconds that have at least one instance of path FEBE. The counter also increments during detection of RDI events. Range: 0 to (232-1) |
184 |
Section Severely Err Framing Secs |
— |
— |
Provides a count of the section seconds that have at least 2500 instances (for OC3 lines) of out of frame (OOF). Range: 0 to (232-1) |
185 |
Line BIP24 Severely Err Secs |
— |
— |
Provides a count of the BIP-24 severely errored seconds (SESs) that occur within the collection interval. SESs are classified as at least 2500 instances (for OC3 lines) of line BIP-24 errored seconds. The counter also increments during detection of line alarm indication signals. Range: 0 to (232-1) |
186 |
Line FEBE Severely Err Secs |
— |
— |
Provides a count of the FEBE SESs. SESs are classified as at least 2500 instances (for OC3 lines) of line FEBE. The counter also increments during line RDIs. Range: 0 to (232-1) |
187 |
Path BIP8 Severely Err Secs |
— |
— |
Provides a count of the BIP-8 SESs that occur within the collection interval. SESs are classified as at least 2400 instances of path BIP-8 errored seconds. The counter also increments during detection of LOP and AIS events. Range: 0 to (232-1) |
188 |
Path FEBE Severely Err Secs |
— |
— |
Provides a count of the FEBE SESs. SESs are classified as at least 2400 instances of path FEBEs. The counter also increments during detection of RDI events. Range: 0 to (232-1) |
189 |
Line Unavailable Secs |
— |
— |
Provides a count of the seconds that the line is unavailable after the occurrence of 10 contiguous line SESs. Range: 0 to (232-1) |
190 |
Line Farend Unavailable Secs |
— |
— |
Provides a count of the far end unavailable seconds (UAS). UAS are defined as 10 contiguous severely errored seconds. Range: 0 to (232-1) |
191 |
Path Unavailable Secs |
— |
— |
Provides a count of the seconds that the line is unavailable after the occurrence of 10 contiguous path SESs. Range: 0 to (232-1) |
192 |
Path Farend Unavailable Secs |
— |
— |
Provides a count of the seconds that the line is unavailable after the occurrence of 10 contiguous path far end SESs. Range: 0 to (232-1) |
214 |
HCS Correctable Error |
— |
— |
Provides a count of the loss of cell delineation header checksum errors that are corrected. Range: 0 to (232-1) |
AXSM-E T1/E1 Physical Line
This section provides information about the statistics contained in the AXSME_Phyline_T1E1 group. The AXSM-E T1/E1 physical line statistics in this group are applicable to the MGX 8850 (PXM45) switch.
The following table lists the attributes that are common to the AXSM-E T1/E1 physical line statistics.
Front Card |
AXSM-16-T1E1-E |
Back Cards |
RJ48-8-T1-Y, SMB-8-E1 |
Object Type |
11 |
Subobject Type |
3 |
Allowable Peak Intervals |
60 seconds, 300 seconds |
Default Peak Interval |
300 seconds |
The AXSM-E T1/E1 physical line statistics are primarily used for gathering troubleshooting and performance data.
The tables in this section include the description of each statistic and the point during the data flow at which the statistic gathers the appropriate information. Each measurement point refers to the corresponding point in Figure 4-1.
Note AXSM-E statistics are only collected at measurement points 1, 2, and 13.
|
Stat ID
|
AXSM-E T1/E1 Physical Line Statistics
|
Subset of Other Stats
|
Ingress/Egress Measurement Point
|
Description
|
0 |
Errored Seconds |
— |
— |
Provides a count of the line code violation errored seconds. Range: 0 to (232-1) |
1 |
Severely Errored Seconds |
— |
— |
Provides a count of the line code violation severely errored seconds (SES) that are encountered by the interface. Severely errored seconds are classified as errored seconds that are greater than the total line bits per second multiplied by 10-6. Range: 0 to (232-1) |
2 |
Severely Errored Framing Seconds |
No |
Ingress-1 |
Provides a count of the severely errored framing seconds that occur within the collection interval on the T1/E1 line. Range: 0 to (240-1) cells |
3 |
Unavailable Seconds |
No |
Ingress-1 |
Provides a count of the unavailable seconds on the T1/E1 line. Unavailable seconds are defined as 10 contiguous severely errored seconds. Range: 0 to (240-1) cells |
4 |
Path coding violations |
— |
— |
Provides a count of the path code violations that are encountered by the interface. These violations occur when more than three zeroes in a row are transmitted. Range: 0 to (232-1) |
5 |
Line Errored Seconds |
— |
— |
Provides a count of the line code violation errored seconds. Range: 0 to (232-1) |
6 |
Line Severely Errored Seconds |
— |
— |
Provides a count of the line code violation severely errored seconds (SES) that are encountered by the interface. Severely errored seconds are classified as errored seconds that are greater than the total line bits per second multiplied by 10-6. Range: 0 to (232-1) |
7 |
Path SEF/AIS (PSAS) Encountered |
— |
— |
Provides a count of the severely errored frames or an alarm indication signals (AIS) detected on the T1/E1 line. Range: 0 to (232-1) |
8 |
Number of occurrences of Loss of Signal |
No |
Ingress-1 |
Provides a count of the times a loss of signal (LOS) is detected on the T1/E1 line. The count includes the number of LOS alarms. Range: 0 to (240-1) cells |
9 |
Number of occurrences of Out of Frame |
No |
Ingress-1 |
Provides a count of the times an out of frame (OOF) is detected. The count includes the number of OOF alarms. Range: 0 to (232-1) |
10 |
Number of occurrences of RAI |
No |
Ingress-1 |
Provides a count of the remote alarm indication (RAI) occurrences on the T1/E1 line. Range: 0 to (232-1) |
11 |
Far-end Errored Seconds |
No |
Ingress-1 |
Provides a count of the seconds errors are detected at the far end of the T1/E1 line. Range: 0 to (240-1) cells |
12 |
Far-end severely Errored Seconds |
— |
— |
Provides a count of the far end SES that occur within the collection interval. Severely errored seconds are classified as errored seconds that are greater than the total line bits per second multiplied by 10-6. Range: 0 to (232-1) |
13 |
Far-end severely Errored Framing Seconds |
No |
Ingress-1 |
Provides a count of the severely errored framing seconds that occur within the collection interval on the T1/E1 line. Range: 0 to (240-1) cells |
14 |
Far-end Unavailable Seconds |
No |
Ingress-1 |
Provides a count of the unavailable seconds at the far end of the T1/E1 line. Unavailable seconds are defined as 10 contiguous severely errored seconds. Range: 0 to (240-1) |
15 |
Far-end line errored seconds |
— |
— |
Provides a count of the line code violation errored seconds at the far end. Range: 0 to (232-1) |
16 |
Far-end path coding violations |
— |
— |
Provides a count of the path code violations that are encountered at the far end. These violations occur when more than three zeroes in a row are transmitted. Range: 0 to (232-1) |
17 |
Line code violations |
No |
Ingress-1 |
Provides a count of the line code violations encountered by the T1/E1 line. Range: 0 to (240-1) cells) |
AXSM-E T3/E3 Physical Line
This section provides information about the statistics contained in the AXSME_Phyline_T3E3 group. The AXSM-E T3/E3 physical line statistics in this group are applicable to the MGX 8850 (PXM45) switch.
The following table lists the attributes that are common to the AXSM-E T3/E3 physical line statistics.
Front Card |
AXSM-16-T3E3-E |
Back Cards |
SMB-8-T3, SMB-8-E3 |
Object Type |
11 |
Subobject Type |
4 |
Allowable Peak Intervals |
60 seconds, 300 seconds |
Default Peak Interval |
300 seconds |
The AXSM-E T3/E3 physical line statistics are primarily used for gathering troubleshooting and performance data.
The tables in this section include the description of each statistic and the point during the data flow at which the statistic gathers the appropriate information. Each measurement point refers to the corresponding point in Figure 4-1.
Note AXSM-E statistics are only collected at measurement points 1, 2, and 13.
|
Stat ID
|
AXSM-E T3/E3 Physical Line Statistics
|
Subset of Other Stats
|
Ingress/Egress Measurement Point
|
Description
|
0 |
Loss of Signal Occurrences |
No |
Ingress-1 |
Provides a count of the times a loss of signal (LOS) is detected on the T3 line. The count includes the number of LOS alarms. Range: 0 to (240-1) cells |
1 |
Loss of Frame Occurrences |
No |
Ingress-1 |
Provides a count of the loss of frames (LOFs) that are encountered by the T3 line. Range: 0 to (240-1) cells |
2 |
Alarm Indication Signal Occurrences |
No |
Ingress-1 |
Provides a count of the alarm indication signal (AIS) instances on the T3 line. Range: 0 to (240-1) cells |
3 |
Yellow Alarm Occurrences |
No |
Ingress-1 |
Provides a count of the times yellow alarms are detected on the T3 line. Range: 0 to (240-1) cells |
4 |
Number of line code violations |
No |
Ingress-1 |
Provides a count of the line code violations encountered by the T3 line. Range: 0 to (240-1) cells |
5 |
Number of p-bit parity code violations |
No |
Ingress-1 |
Provides a count of the P-bit parity codes that do not match the locally calculated parity code on the T3 line. Range: 0 to (240-1) cells |
6 |
Number of c-bit parity code violations |
No |
Ingress-1 |
Provides a count of the C-bit parity code violations that do not match the locally calculated parity code on the T3 line. Range: 0 to (240-1) cells |
7 |
Far end blocked errors |
No |
Ingress-1 |
Provides a count of the far end block errors that occur within the collection interval on the T3 line. Range: 0 to (240-1) cells |
8 |
Seconds with at least one LCV + number of LOS |
No |
Ingress-1 |
Provides a count of the seconds with at least one line code violation (LCV) and one loss of signal (LOS) on the T3 line. Range: 0 to (240-1) cells |
9 |
Seconds with at least one PCV + number of LOF |
No |
Ingress-1 |
Provides a count of the seconds with at least one parity code violation (PCV) and one loss of frame (LOF) on the T3 line. Range: 0 to (240-1) cells |
10 |
Seconds with at least one CCV + number of LOF |
No |
Ingress-1 |
Provides a count of seconds with at least one C-bit code violation and one loss of frame on the T3 line. Range: 0 to (240-1) cells |
11 |
Seconds with 45/34(T3)LCV + number of LOS |
No |
Ingress-1 |
Provides a count of seconds with 45/34 LCVs and LOSs on the T3 line. Range: 0 to (240-1) cells |
12 |
Seconds with 44(T3)PCV + number of LOF |
No |
Ingress-1 |
Provides a count of the seconds with 44 PCVs and LOFs on the T3 line. Range: 0 to (240-1) cells |
13 |
Seconds with 44(T3)CCV + number of LOF |
No |
Ingress-1 |
Provides a count of the seconds with 44 CCVs and LOFs on the T3 line. Range: 0 to (240-1) cells |
14 |
Seconds with severely errored framing |
No |
Ingress-1 |
Provides a count of the severely errored framing seconds that occur within the collection interval on the T3 line. Range: 0 to (240-1) cells |
15 |
Unavailable seconds |
No |
Ingress-1 |
Provides a count of the unavailable seconds on the T3 line. Unavailable seconds are defined as 10 contiguous severely errored seconds. Range: 0 to (240-1) cells |
16 |
PLCP Loss of Frames |
No |
Ingress-1 |
Provides a count of the loss of frames detected by the physical layer convergence protocol (PLCP) interface on the T3 line. Range: 0 to (240-1) cells |
17 |
PLCP YEL-LOW |
No |
Ingress-1 |
Provides a count of the number of times PLCP yellow defects are detected on the T3 line. Range: 0 to (240-1) cells |
18 |
PLCP bip 8-errors |
No |
Ingress-1 |
Provides a count of the PLCP BIP-8 errors on the T3 line. Range: 0 to (240-1) cells |
19 |
PLCP far end blocked errors |
No |
Ingress-1 |
Provides a count of the far end block errors that are encountered by the PLCP interface on the T3 line. Range: 0 to (240-1) cells |
20 |
Seconds with at least one PLCP bip-8 error |
No |
Ingress-1 |
Provides a count of the seconds with at least one PLCP BIP-8 error detected on the T3 line. Range: 0 to (240-1) cells |
21 |
Seconds with 5 PLCP bip-8 errors n |
No |
Ingress-1 |
Provides a count of the seconds with at least five PLCP BIP-8 errors that are detected on the T3 line. Range: 0 to (240-1) cells |
22 |
Seconds with T3 PLCP far end blocked errors |
No |
Ingress-1 |
Provides a count of the seconds with PLCP far end block errors that are detected on the T3 line. Range: 0 to (240-1) cells |
23 |
Seconds with 5 PLCP FEBE errors + PLCP YEL |
No |
Ingress-1 |
Provides a count of the seconds with at least five PLCP far end block errors (FEBE) and yellow defects detected on the T3 line. Range: 0 to (240-1) cells |
24 |
Seconds with T3 severely errored framing |
No |
Ingress-1 |
Provides a count of the severely errored framing seconds that occur within the collection interval on the T3 line. Range: 0 to (240-1) cells |
25 |
T3 PLCP unavailable seconds |
No |
Ingress-1 |
Provides a count of the unavailable seconds on the T3 line. Unavailable seconds are defined as 10 contiguous severely errored seconds. Range: 0 to (240-1) cells |
26 |
PLCP Framing Errors |
No |
Ingress-1 |
Provides a count of the framing errors that are detected by the PLCP interface on the T3 line. Range: 0 to (240-1) cells |
27 |
PLCP Framing Error Seconds |
No |
Ingress-1 |
Provides a count of seconds that framing errors are detected by PLCP interface on the T3 line. Range: 0 to (240-1) cells |
28 |
PLCP Severely Errored Framing Seconds |
No |
Ingress-1 |
Provides a count of the severely errored seconds based on PLCP framing errors detected on the T3 line. Range: 0 to (240-1) cells |
29 |
Occurrences of loss of cell delineation |
No |
Ingress-1 |
Provides a count of the loss of cell delineation defect states on the T3 line. Range: 0 to (240-1) cells |
30 |
T3 far end errored seconds |
No |
Ingress-1 |
Provides a count of the seconds errors are detected at the far end of the T3 line. Range: 0 to (240-1) cells |
31 |
T3 far end severely errored seconds |
T3 far end errored seconds |
Ingress-1 |
Provides a count of the severely errored seconds (SES) that occur at the far end of the T3 line. Severely errored seconds are classified as errored seconds that are greater than the total line bits per second multiplied by 10-6. Range: 0 to (240-1) cells |
32 |
T3 far end unavailable seconds |
No |
Ingress-1 |
Provides a count of the unavailable seconds at the far end of the T3 line. Unavailable seconds are defined as 10 contiguous severely errored seconds. Range: 0 to (240-1) cells |
50 |
loss of signal occurrences |
No |
Ingress-1 |
Provides a count of the times a loss of signal (LOS) is detected on the E3 line. The count includes the number of LOS alarms. Range: 0 to (240-1) cells |
51 |
loss of frame occurrences |
No |
Ingress-1 |
Provides a count of the loss of frames (LOFs) that are encountered by the E3 line. Range: 0 to (240-1) cells |
52 |
alarm indication signal occurrences |
No |
Ingress-1 |
Provides a count of the alarm indication signal (AIS) instances on the E3 line. Range: 0 to (240-1) cells |
53 |
yellow alarms occurrences |
No |
Ingress-1 |
Provides a count of the times yellow alarms are detected on the E3 line. Range: 0 to (240-1) cells |
54 |
loss of cell delineation occurrences |
No |
Ingress-1 |
Provides a count of the loss of cell delineation defect states on the E3 line. Range: 0 to (240-1) cells |
55 |
trail trace byte mismatch |
No |
Ingress-1 |
Provides a count of the trail trace byte (TTB) mismatch occurrences on the E3 line. Range: 0 to (240-1) cells |
56 |
line code violations |
No |
Ingress-1 |
Provides a count of the line code violations encountered by the E3 line. Range: 0 to (240-1) cells |
57 |
Seconds with at least one LCV + number of LOS |
No |
Ingress-1 |
Provides a count of the seconds with at least one line code violation (LCV) and one loss of signal (LOS) on the E3 line. Range: 0 to (240-1) cells |
58 |
Seconds with 45/34 (E3) LCV+ number of LOS |
No |
Ingress-1 |
Provides a count of seconds with 45/34 LCVs and LOSs on the E3 line. Range: 0 to (240-1) cells |
59 |
Number of p-bit parity code violations |
No |
Ingress-1 |
Provides a count of the P-bit parity codes that do not match the locally calculated parity code on the E3 line. Range: 0 to (240-1) cells |
60 |
Seconds with at least one PCV + number of LOF |
No |
Ingress-1 |
Provides a count of the seconds with at least one parity code violation (PCV) and one loss of frame (LOF) on the E3 line. Range: 0 to (240-1) cells |
61 |
Seconds with at least one CCV + number of LOF |
No |
Ingress-1 |
Provides a count of seconds with at least one C-bit code violation and one LOF on the E3 line. Range: 0 to (240-1) cells |
62 |
Seconds with severely errored framing |
No |
Ingress-1 |
Provides a count of the severely errored framing seconds that occur within the collection interval on the E3 line. Range: 0 to (240-1) cells |
63 |
Unavailable Seconds |
No |
Ingress-1 |
Provides a count of the unavailable seconds on the E3 line. Unavailable seconds are defined as 10 contiguous severely errored seconds. Range: 0 to (240-1) cells |
64 |
Far end blocked errors |
No |
Ingress-1 |
Provides a count of the far end block errors that occur within the collection interval on the E3 line. Range: 0 to (240-1) cells |
65 |
Far end errored seconds |
No |
Ingress-1 |
Provides a count of the seconds errors are detected at the far end of the E3 line. Range: 0 to (240-1) cells |
66 |
Far end severely errored seconds |
Far end errored seconds |
Ingress-1 |
Provides a count of the severely errored seconds (SES) that occur at the far end of the E3 line. Severely errored seconds are classified as errored seconds that are greater than the total line bits per second multiplied by 10-6. Range: 0 to (240-1) cells |
67 |
Far end unavailable seconds |
No |
Ingress-1 |
Provides a count of the unavailable seconds at the far end of the E3 line. Unavailable seconds are defined as 10 contiguous severely errored seconds. Range: 0 to (240-1) |
AXSM-E SONET Physical Line
This section provides information about the statistics contained in the AXSME_Phyline_SONET group. The AXSM-E SONET physical line statistics in this group are applicable to the MGX 8850 (PXM45) switch.
The following table lists the attributes that are common to the AXSM-E SONET physical line statistics.
Front Cards |
AXSM-8-155-E, AXSM-2-622-E |
Back Cards |
SMB-4-155, SMFLR-4-155, SMFIR-4-155, MMF-4-155, SMFLR-1-622, SMFIR-1-622 |
Object Type |
11 |
Subobject Type |
5 |
Allowable Peak Intervals |
60 seconds, 300 seconds |
Default Peak Interval |
300 seconds |
The AXSM-E SONET physical line statistics are primarily used for gathering troubleshooting and performance data.
The tables in this section include the description of each statistic and the point during the data flow at which the statistic gathers the appropriate information. Each measurement point refers to the corresponding point in Figure 4-1.
Note AXSM-E statistics are only collected at measurement points 1, 2, and 13.
|
Stat ID
|
AXSM-E SONET Physical Line Statistics
|
Subset of Other Stats
|
Ingress/Egress Measurement Point
|
Description
|
0 |
LOS defect state occurrences |
No |
Ingress-1 |
Provides a count of the times a loss of signal (LOS) is detected on the SONET line. The count includes the number of LOS alarms. Range: 0 to (240-1) cells |
1 |
LOF defect state occurrences |
No |
Ingress-1 |
Provides a count of the loss of frames (LOFs) that are encountered by the SONET line. Range: 0 to (240-1) cells |
2 |
AIS defect state occurrences |
No |
Ingress-1 |
Provides a count of the alarm indication signal (AIS) instances on the SONET line. Range: 0 to (240-1) cells |
3 |
Yellow Alarm defect state occurrences |
No |
Ingress-1 |
Provides a count of the times yellow alarms are detected on the SONET line. Range: 0 to (240-1) cells |
4 |
Loss of Cell delineation defect occurrences |
No |
Ingress-1 |
Provides a count of the loss of cell delineation defect states on the SONET line. Range: 0 to (240-1) cells |
5 |
Number of instances of Loss of Pointer |
No |
Ingress-1 |
Provides a count of the loss of pointer defect states on the SONET line. Range: 0 to (240-1) cells |
6 |
Number of instances of Path AIS |
No |
Ingress-1 |
Provides a count of the AIS instances on the path. Range: 0 to (240-1) cells |
7 |
Number of instances of Path Yellow |
No |
Ingress-1 |
Provides a count of the times yellow alarms are detected on the path. Range: 0 to (240-1) cells |
8 |
Trace section |
No |
Ingress-1 |
Provides a count of the section traces. Range: 0 to (240-1) cells |
9 |
Trace path |
No |
Ingress-1 |
Provides a count of the path traces. Range: 0 to (240-1) cells |
10 |
Aps_mis |
No |
Ingress-1 |
Provides a count of the total automatic protection system (APS) mismatches. Range: 0 to (240-1) cells |
11 |
Aps_psbf |
No |
Ingress-1 |
Provides a count of the protection switching byte failures (PSBFs) that are detected on the SONET line. Range: 0 to (240-1) cells |
12 |
Aps_chan_mis |
No |
Ingress-1 |
Provides a count of the APS channel mismatches that are detected on the SONET line. Range: 0 to (240-1) cells |
13 |
Aps_mode_mis |
No |
Ingress-1 |
Provides a count of the APS mode mismatches that are detected on the SONET line. Range: 0 to (240-1) cells |
14 |
Aps_fe_prot |
No |
Ingress-1 |
Provides a count of the switches to fast Ethernet protocol. Range: 0 to (240-1) cells |
15 |
Code violations for section |
No |
Ingress-1 |
Provides a count of the section code violations. Range: 0 to (240-1) cells |
16 |
Errored seconds for section |
No |
Ingress-1 |
Provides a count of the section errored seconds that occur within the collection interval. Range: 0 to (240-1) cells |
17 |
Severely Errored seconds for section |
No |
Ingress-1 |
Provides a count of the section severely errored seconds that occur within the collection interval. Severely errored seconds are classified as errored seconds that are greater than the total line bits per second multiplied by 10-6. Range: 0 to (240-1) cells |
18 |
Unavailable seconds for section |
No |
Ingress-1 |
Provides a count of the section unavailable seconds. Unavailable seconds are defined as 10 contiguous severely errored seconds. Range: 0 to (240-1) cells |
19 |
Code violations for line |
No |
Ingress-1 |
Provides a count of the code violations encountered by the SONET line. Range: 0 to (240-1) cells |
20 |
Errored seconds for line |
No |
Ingress-1 |
Provides a count of the errored seconds that occur within the collection interval on the SONET line. Range: 0 to (240-1) cells |
21 |
Severely errored seconds for line |
No |
Ingress-1 |
Provides a count of the severely errored seconds that occur within the collection interval on the SONET line. Severely errored seconds are classified as errored seconds that are greater than the total line bits per second multiplied by 10-6. Range: 0 to (240-1) cells |
22 |
Unavailable seconds for line |
No |
Ingress-1 |
Provides a count of the unavailable seconds on the SONET line. Unavailable seconds are defined as 10 contiguous severely errored seconds. Range: 0 to (240-1) cells |
23 |
Code violations for line at far end |
No |
Ingress-1 |
Provides a count of the code violations at the far end of the line. Range: 0 to (240-1) cells |
24 |
Errored seconds for line at far end |
No |
Ingress-1 |
Provides a count of the errored seconds that occur at the far end of the line. Range: 0 to (240-1) cells |
25 |
Severely Errored seconds for line at far end |
No |
Ingress-1 |
Provides a count of the severely errored seconds at the far end of the line. Severely errored seconds are classified as errored seconds that are greater than the total line bits per second multiplied by 10-6. Range: 0 to (240-1) cells |
26 |
Unavailable seconds for line at far end |
No |
Ingress-1 |
Provides a count of the section unavailable seconds for the line. Unavailable seconds are defined as 10 contiguous severely errored seconds. Range: 0 to (240-1) cells |
27 |
Code violations for path |
No |
Ingress-1 |
Provides a count of the path code violations. Range: 0 to (240-1) cells |
28 |
Errored seconds for path |
No |
Ingress-1 |
Provides a count of the path errored seconds. Range: 0 to (240-1) cells |
29 |
Severely errored seconds for path |
No |
Ingress-1 |
Provides a count of the path severely errored seconds. Severely errored seconds are classified as errored seconds that are greater than the total line bits per second multiplied by 10-6. Range: 0 to (240-1) cells |
30 |
Unavailable seconds for path |
No |
Ingress-1 |
Provides a count of the path unavailable seconds for the line. Unavailable seconds are defined as 10 contiguous severely errored seconds. Range: 0 to (240-1) cells |
31 |
Code violations for path at far end |
No |
Ingress-1 |
Provides a count of the path code violations at the far end of the line. Range: 0 to (240-1) cells |
32 |
Errored seconds for path at far end |
No |
Ingress-1 |
Provides a count of the path errored seconds that occur at the far end of the line. Range: 0 to (240-1) cells |
33 |
Severely errored seconds for path at far end |
No |
Ingress-1 |
Provides a count of the path severely errored seconds at the far end of the line. Severely errored seconds are classified as errored seconds that are greater than the total line bits per second multiplied by 10-6. Range: 0 to (240-1) cells |
34 |
Unavailable seconds for path at far end |
No |
Ingress-1 |
Provides a count of the path unavailable seconds for the line. Unavailable seconds are defined as 10 contiguous severely errored seconds. Range: 0 to (240-1) |
FRSM12 T3 Line
This section provides information about the statistics contained in the FRSM12 Line T3 group. The FRSM12 T3 line statistics in this group are applicable to the MGX 8850(PXM45) node.
The following table lists the attributes that are common to the FRSM12 T3 line statistics.
Front Cards |
FRSM-12T3E3 |
Back Cards |
SMB-6T3 |
Object Type |
11 |
Subobject Type |
6 |
Allowable Peak Intervals |
60 seconds, 300 seconds |
Default Peak Interval |
300 seconds |
The FRSM12 T3 physical line statistics are primarily used for gathering troubleshooting and performance data.
The tables in this section include the description of each statistic and the point during the data flow at which the statistic gathers the appropriate information. Each measurement point refers to the corresponding point in Figure 4-1.
|
Stat ID
|
FRSM12 T3 Line Statistics
|
Subset of Other Stats
|
Ingress/Egress Measurement Point
|
Description
|
0 |
No. of occurrences of Loss of Signal |
No |
Ingress-1 |
Provides a count of the times a loss of signal (LOS) is detected on the T3 line. The count includes the number of LOS alarms. Range: 0 to (240-1) cells |
1 |
No. of occurrences of Loss of Frame |
No |
Ingress-1 |
Provides a count of the loss of frames (LOFs) that are encountered by the T3 line. Range: 0 to (240-1) cells |
2 |
No. of occurrences of AIS |
No |
Ingress-1 |
Provides a count of the alarm indication signal (AIS) instances on the T3 line. Range: 0 to (240-1) cells |
3 |
No. of occurrences of Yellow alarm |
No |
Ingress-1 |
Provides a count of the times yellow alarms are detected on the T3 line. Range: 0 to (240-1) cells |
4 |
No. of line code violations |
No |
Ingress-1 |
Provides a count of the line code violations encountered by the T3 line. Range: 0 to (240-1) cells |
5 |
No. of p-bit parity code violations |
No |
Ingress-1 |
Provides a count of the P-bit parity codes that do not match the locally calculated parity code on the T3 line. Range: 0 to (240-1) cells |
6 |
No. of c-bit parity code violations |
No |
Ingress-1 |
Provides a count of the C-bit parity code violations that do not match the locally calculated parity code on the T3 line. Range: 0 to (240-1) cells |
7 |
Far end blocked errors. |
No |
Ingress-1 |
Provides a count of the far end block errors that occur within the collection interval on the T3 line. Range: 0 to (240-1) cells |
8 |
Secs. with at least one LCV +no. of LOS |
No |
Ingress-1 |
Provides a count of the errored seconds with at least one LCV plus the number of LOS on the T3 line. Range: 0 to (240-1) cells |
9 |
Secs. with at least one PCV +no. of LOF |
No |
Ingress-1 |
Provides a count of the seconds with at least one PCV plus the number of LOFs on the T3 line. Range: 0 to (240-1) cells |
10 |
Secs. with at least one CCV +no. of LOF |
No |
Ingress-1 |
Provides a count of seconds with at least one CCV plus the number of LOFs the T3 line. Range: 0 to (240-1) cells |
11 |
Secs. with 45/34(T3) LCV + no. of LOS |
No |
Ingress-1 |
Provides a count of severely errored that occur on the T3 line. These seconds include 45/34 LCV plus the number of LOS. Range: 0 to (240-1) cells |
12 |
Secs. with 44(T3) PCV + no. of LOF |
No |
Ingress-1 |
Provides a count of the P-bit severely errored seconds on the T3 line. These seconds include 44 PCVs plus the number of LOFs. Range: 0 to (240-1) cells |
13 |
Secs. with 44(T3) CCV + no. of LOF |
No |
Ingress-1 |
Provides a count of the C-bit severely errored seconds on the T3 line. These seconds include 44 CCVs plus the number of LOFs. Range: 0 to (240-1) cells |
14 |
Secs. with Severely Errored Framing |
No |
Ingress-1 |
Provides a count of the severely errored framing seconds that occur within the collection interval on the T3 line. Range: 0 to (240-1) cells |
15 |
Unavailable seconds |
No |
Ingress-1 |
Provides a count of the unavailable seconds on the T3 line. Unavailable seconds are defined as 10 contiguous severely errored seconds. Range: 0 to (240-1) cells |
16 |
PLCP Loss of Frames |
No |
Ingress-1 |
Provides a count of the loss of frames detected by the physical layer convergence protocol (PLCP) interface on the T3 line. Range: 0 to (240-1) cells |
17 |
PLCP YEL-LOW |
No |
Ingress-1 |
Provides a count of the number of times PLCP yellow defects are detected on the T3 line. Range: 0 to (240-1) cells |
18 |
PLCP bip-8 errors |
No |
Ingress-1 |
Provides a count of the PLCP BIP-8 errors on the T3 line. Range: 0 to (240-1) cells |
19 |
PLCP far end blocked errors |
No |
Ingress-1 |
Provides a count of the far end block errors that are encountered by the PLCP interface on the T3 line. Range: 0 to (240-1) cells |
20 |
Secs. with at least one PLCP bip-8 err |
No |
Ingress-1 |
Provides a count of the seconds with at least one PLCP BIP-8 error detected on the T3 line. Range: 0 to (240-1) cells |
21 |
Secs. with 5 PLCP bip-8 errors |
No |
Ingress-1 |
Provides a count of the severely errored seconds with at least one PLCP BIP-8 error detected on the T3 line. Range: 0 to (240-1) cells |
22 |
Secs. with T3 PLCP far end blocked errs |
No |
Ingress-1 |
Provides a count of the seconds with PLCP far end block errors that are detected on the T3 line. Range: 0 to (240-1) cells |
23 |
Secs. with 5 PLCP FEBE errs + PLCP YEL |
No |
Ingress-1 |
Provides a count of the seconds with far end block errors that are detected on the T3 line. Range: 0 to (240-1) cells |
24 |
Secs. with T3 severely errored framing |
No |
Ingress-1 |
Provides a count of the severely errored framing seconds that occur within the collection interval on the T3 line. Range: 0 to (240-1) cells |
25 |
T3 PLCP unavailable seconds |
No |
Ingress-1 |
Provides a count of the unavailable seconds on the T3 line. Unavailable seconds are defined as 10 contiguous severely errored seconds. Range: 0 to (240-1) cells |
26 |
PLCP Framing Errors |
No |
Ingress-1 |
Provides a count of the framing errors that are detected by the PLCP interface on the T3 line. Range: 0 to (240-1) cells |
27 |
PLCP Framing Error Secs. |
No |
Ingress-1 |
Provides a count of seconds that framing errors are detected by PLCP interface on the T3 line. Range: 0 to (240-1) cells |
28 |
PLCP Severely Errored Framing Secs. |
No |
Ingress-1 |
Provides a count of the severely errored seconds based on PLCP framing errors detected on the T3 line. Range: 0 to (240-1) cells |
29 |
occurrences of loss of cell delineation |
No |
Ingress-1 |
Provides a count of occurrences of loss of cell delineation. Range: 0 to (240-1) cells |
30 |
Far end errored seconds |
No |
Ingress-1 |
Provides a count of the seconds errors are detected at the far end of the T3 line. Range: 0 to (240-1) cells |
31 |
Far end severely errored seconds |
Far end errored seconds |
Ingress-1 |
Provides a count of the severely errored seconds (SES) that occur at the far end of the T3 line. Severely errored seconds are classified as errored seconds that are greater than the total line bits per second multiplied by 10-6. Range: 0 to (240-1) cells |
32 |
Far end unavailable seconds |
No |
Ingress-1 |
Provides a count of the unavailable seconds at the far end of the T3 line. Unavailable seconds are defined as 10 contiguous severely errored seconds. Range: 0 to (240-1) cells) |
FRSM12 E3 Line
This section provides information about the statistics contained in the FRSM12 Line E3 group. The FRSM12 E3 line statistics in this group are applicable to the MGX 8850(PXM45) node.
The following table lists the attributes that are common to the FRSM12 E3 line statistics.
Front Cards |
FRSM-12T3E3 |
Back Cards |
SMB-6E3 |
Object Type |
11 |
Subobject Type |
7 |
Allowable Peak Intervals |
60 seconds, 300 seconds |
Default Peak Interval |
300 seconds |
The FRSM12 E3 physical line statistics are primarily used for gathering troubleshooting and performance data.
The tables in this section include the description of each statistic and the point during the data flow at which the statistic gathers the appropriate information. Each measurement point refers to the corresponding point in Figure 4-1.
|
Stat ID
|
FRSM12 E3 Line Statistics
|
Subset of Other Stats
|
Ingress/Egress Measurement Point
|
Description
|
0 |
No. of occurrences of Loss of Signal |
No |
Ingress-1 |
Provides a count of the times a loss of signal (LOS) is detected on the E3 line. The count includes the number of LOS alarms. Range: 0 to (240-1) cells |
1 |
No. of occurrences of Loss of Frame |
No |
Ingress-1 |
Provides a count of the loss of frames (LOFs) that are encountered by the E3 line. Range: 0 to (240-1) cells |
2 |
No. of occurrences of AIS |
No |
Ingress-1 |
Provides a count of the alarm indication signal (AIS) instances on the E3 line. Range: 0 to (240-1) cells |
3 |
No. of occurrences of Yellow alarm |
No |
Ingress-1 |
Provides a count of the times yellow alarms are detected on the E3 line. Range: 0 to (240-1) cells |
4 |
No. of line code violations |
No |
Ingress-1 |
Provides a count of the line code violations encountered by the E3 line. Range: 0 to (240-1) cells |
5 |
No. of p-bit parity code violations |
No |
Ingress-1 |
Provides a count of the P-bit parity codes that do not match the locally calculated parity code on the E3 line. Range: 0 to (240-1) cells |
6 |
No. of c-bit parity code violations |
No |
Ingress-1 |
Provides a count of the C-bit parity code violations that do not match the locally calculated parity code on the E3 line. Range: 0 to (240-1) cells |
7 |
Far end blocked errors. |
No |
Ingress-1 |
Provides a count of the far end block errors that occur within the collection interval on the E3 line. Range: 0 to (240-1) cells |
8 |
Secs. with at least one LCV +no. of LOS |
No |
Ingress-1 |
Provides a count of the errored seconds with at least one LCV plus the number of LOS on the E3 line. Range: 0 to (240-1) cells |
9 |
Secs. with at least one PCV +no. of LOF |
No |
Ingress-1 |
Provides a count of the seconds with at least one PCV plus the number of LOFs on the E3 line. Range: 0 to (240-1) cells |
10 |
Secs. with at least one CCV +no. of LOF |
No |
Ingress-1 |
Provides a count of seconds with at least one CCV plus the number of LOFs the E3 line. Range: 0 to (240-1) cells |
11 |
Secs. with 45/34(T3) LCV + no. of LOS |
No |
Ingress-1 |
Provides a count of severely errored that occur on the E3 line. Range: 0 to (240-1) cells |
12 |
Secs. with 44(T3) PCV + no. of LOF |
No |
Ingress-1 |
Provides a count of the P-bit severely errored seconds on the E3 line. Range: 0 to (240-1) cells |
13 |
Secs. with 44(T3) CCV + no. of LOF |
No |
Ingress-1 |
Provides a count of the C-bit severely errored seconds on the E3 line. Range: 0 to (240-1) cells |
14 |
Secs. with Severely Errored Framing |
No |
Ingress-1 |
Provides a count of the severely errored framing seconds that occur within the collection interval on the E3 line. Range: 0 to (240-1) cells |
15 |
Unavailable seconds |
No |
Ingress-1 |
Provides a count of the unavailable seconds on the E3 line. Unavailable seconds are defined as 10 contiguous severely errored seconds. Range: 0 to (240-1) cells |
16 |
PLCP Loss of Frames |
No |
Ingress-1 |
Provides a count of the loss of frames detected by the physical layer convergence protocol (PLCP) interface on the E3 line. Range: 0 to (240-1) cells |
17 |
PLCP YEL-LOW |
No |
Ingress-1 |
Provides a count of the number of times PLCP yellow defects are detected on the E3 line. Range: 0 to (240-1) cells |
18 |
PLCP bip-8 errors |
No |
Ingress-1 |
Provides a count of the PLCP BIP-8 errors on the E3 line. Range: 0 to (240-1) cells |
19 |
PLCP far end blocked errors |
No |
Ingress-1 |
Provides a count of the far end block errors that are encountered by the PLCP interface on the E3 line. Range: 0 to (240-1) cells |
20 |
Secs. with at least one PLCP bip-8 err |
No |
Ingress-1 |
Provides a count of the seconds with at least one PLCP BIP-8 error detected on the E3 line. Range: 0 to (240-1) cells |
21 |
Secs. with 5 PLCP bip-8 errors |
No |
Ingress-1 |
Provides a count of the severely errored seconds with at least one PLCP BIP-8 error detected on the E3 line. Range: 0 to (240-1) cells |
22 |
Secs. with T3 PLCP far end blocked errs |
No |
Ingress-1 |
Provides a count of the seconds with PLCP far end block errors that are detected on the E3 line. Range: 0 to (240-1) cells |
23 |
Secs. with 5 PLCP FEBE errs + PLCP YEL |
No |
Ingress-1 |
Provides a count of the seconds with far end block errors that are detected on the E3 line. Range: 0 to (240-1) cells |
24 |
Secs. with T3 severely errored framing |
No |
Ingress-1 |
Provides a count of the severely errored framing seconds that occur within the collection interval on the E3 line. Range: 0 to (240-1) cells |
25 |
T3 PLCP unavailable seconds |
No |
Ingress-1 |
Provides a count of the unavailable seconds on the E3 line. Unavailable seconds are defined as 10 contiguous severely errored seconds. Range: 0 to (240-1) cells |
26 |
PLCP Framing Errors |
No |
Ingress-1 |
Provides a count of the framing errors that are detected by the PLCP interface on the E3 line. Range: 0 to (240-1) cells |
27 |
PLCP Framing Error Secs. |
No |
Ingress-1 |
Provides a count of seconds that framing errors are detected by PLCP interface on the T3 line. Range: 0 to (240-1) cells |
28 |
PLCP Severely Errored Framing Secs. |
No |
Ingress-1 |
Provides a count of the severely errored seconds based on PLCP framing errors detected on the E3 line. Range: 0 to (240-1) cells |
29 |
occurrences of loss of cell delineation |
No |
Ingress-1 |
Provides a count of occurrences of loss of cell delineation. Range: 0 to (240-1) cells |
30 |
Far end errored seconds |
No |
Ingress-1 |
Provides a count of the seconds errors are detected at the far end of the E3 line. Range: 0 to (240-1) cells |
31 |
Far end severely errored seconds |
FE_ES |
Ingress-1 |
Provides a count of the severely errored seconds (SES) that occur at the far end of the E3 line. Severely errored seconds are classified as errored seconds that are greater than the total line bits per second multiplied by 10-6. Range: 0 to (240-1) cells |
32 |
Far end unavailable seconds |
No |
Ingress-1 |
Provides a count of the unavailable seconds at the far end of the E3 line. Unavailable seconds are defined as 10 contiguous severely errored seconds. Range: 0 to (240-1) cells) |
PXM1E T3 Physical Line
This section provides information about the statistics contained in the PXM1E Physical Line T3 group. The PXM1E T3 line statistics in this group are applicable to the MGX 8830 and MGX 8850 nodes.
The following table lists the attributes that are common to the PXM1E T3 line statistics.
Front Cards |
PXM1E-8-T3E3, PXM1E-T3E3-155 (combo card) |
Back Cards |
MGX-SMB-8T3, MGX-FRU-T3E3-155 |
Object Type |
11 |
Subobject Type |
8 |
Allowable Peak Intervals |
60 seconds, 300 seconds |
Default Peak Interval |
300 seconds |
The PXM1E T3 physical line statistics are primarily used for gathering troubleshooting and performance data.
The tables in this section include the description of each statistic and the point during the data flow at which the statistic gathers the appropriate information. Each measurement point refers to the corresponding point in Figure 4-1.
|
Stat ID
|
PXM1E T3 Physical Line Statistics
|
Subset of Other Stats
|
Ingress/Egress Measurement Point
|
Description
|
0 |
occurrences of LOS defect st. (T3) |
No |
Ingress-1 |
Provides a count of the times a loss of signal (LOS) is detected on the T3 line. The count includes the number of LOS alarms. Range: 0 to (240-1) cells |
1 |
occurrences of LOF defect st. (T3) |
No |
Ingress-1 |
Provides a count of the loss of frames (LOFs) that are encountered by the T3 line. Range: 0 to (240-1) cells |
2 |
occurrences of AIS defect st. (T3) |
No |
Ingress-1 |
Provides a count of the alarm indication signal (AIS) instances on the T3 line. Range: 0 to (240-1) cells |
3 |
occurrences of YEL defect st. (T3) |
No |
Ingress-1 |
Provides a count of the times yellow alarms are detected on the T3 line. Range: 0 to (240-1) cells |
4 |
Line Code Violation Count (T3) |
No |
Ingress-1 |
Provides a count of the line code violations encountered by the T3 line. Range: 0 to (240-1) cells |
5 |
P-Bit Code Violation Count (T3) |
No |
Ingress-1 |
Provides a count of the P-bit parity codes that do not match the locally calculated parity code on the T3 line. Range: 0 to (240-1) cells |
6 |
C-Bit Code Violation Count (T3) |
No |
Ingress-1 |
Provides a count of the C-bit parity code violations that do not match the locally calculated parity code on the T3 line. Range: 0 to (240-1) cells |
7 |
Far End Block Error Count (T3) |
No |
Ingress-1 |
Provides a count of the far end block errors that occur within the collection interval on the T3 line. Range: 0 to (240-1) cells |
8 |
Line error secs (T3) |
No |
Ingress-1 |
Provides a count of the errored seconds on the T3 line. Range: 0 to (240-1) cells |
9 |
P-bit error secs. (T3) |
No |
Ingress-1 |
Provides a count of the seconds with at least one P-bit error on the T3 line. Range: 0 to (240-1) cells |
10 |
C-bit error secs (T3) |
No |
Ingress-1 |
Provides a count of seconds with at least one C-bit error the T3 line. Range: 0 to (240-1) cells |
11 |
Line severe error secs. (T3) |
No |
Ingress-1 |
Provides a count of severely errored that occur on the T3 line. Range: 0 to (240-1) cells |
12 |
P-bit severe error secs. (T3) |
No |
Ingress-1 |
Provides a count of the P-bit severely errored seconds on the T3 line. Range: 0 to (240-1) cells |
13 |
C-bit severe error secs (T3) |
No |
Ingress-1 |
Provides a count of the C-bit severely errored seconds on the T3 line. Range: 0 to (240-1) cells |
14 |
Severe Errored Framing Secs. (T3) |
No |
Ingress-1 |
Provides a count of the severely errored framing seconds that occur within the collection interval on the T3 line. Range: 0 to (240-1) cells |
15 |
Unavailable Seconds (T3) |
No |
Ingress-1 |
Provides a count of the unavailable seconds on the T3 line. Unavailable seconds are defined as 10 contiguous severely errored seconds. Range: 0 to (240-1) cells |
16 |
occurrences of T3 PLCP LOF (T3) |
No |
Ingress-1 |
Provides a count of the loss of frames detected by the physical layer convergence protocol (PLCP) interface on the T3 line. Range: 0 to (240-1) cells |
17 |
occurrences of T3 PLCP YELLOW (T3) |
No |
Ingress-1 |
Provides a count of the number of times PLCP yellow defects are detected on the T3 line. Range: 0 to (240-1) cells |
18 |
PLCP BIP-8 Errs. (T3) |
No |
Ingress-1 |
Provides a count of the PLCP BIP-8 errors on the T3 line. Range: 0 to (240-1) cells |
19 |
PLCP Far End Block Errs. (T3) |
No |
Ingress-1 |
Provides a count of the far end block errors that are encountered by the PLCP interface on the T3 line. Range: 0 to (240-1) cells |
20 |
PLCP BIP-8 error secs. (T3) |
No |
Ingress-1 |
Provides a count of the seconds with at least one PLCP BIP-8 error detected on the T3 line. Range: 0 to (240-1) cells |
21 |
PLCP BIP-8 severe error secs. (T3) |
No |
Ingress-1 |
Provides a count of the severely errored seconds with at least one PLCP BIP-8 error detected on the T3 line. Range: 0 to (240-1) cells |
22 |
secs with PLCP Far End Block Err. (T3) |
No |
Ingress-1 |
Provides a count of the seconds with PLCP far end block errors that are detected on the T3 line. Range: 0 to (240-1) cells |
23 |
severe Far End Block error secs. (T3) |
No |
Ingress-1 |
Provides a count of the seconds with far end block errors that are detected on the T3 line. Range: 0 to (240-1) cells |
24 |
T3 Severe Erred Framing Seconds. (T3) |
No |
Ingress-1 |
Provides a count of the severely errored framing seconds that occur within the collection interval on the T3 line. Range: 0 to (240-1) cells |
25 |
T3 PLCP Unavailable Seconds. (T3) |
No |
Ingress-1 |
Provides a count of the unavailable seconds on the T3 line. Unavailable seconds are defined as 10 contiguous severely errored seconds. Range: 0 to (240-1) cells |
26 |
PLCP Framing Errs (T3) |
No |
Ingress-1 |
Provides a count of the framing errors that are detected by the PLCP interface on the T3 line. Range: 0 to (240-1) cells |
27 |
PLCP Framing Err Seconds (T3) |
No |
Ingress-1 |
Provides a count of seconds that framing errors are detected by PLCP interface on the T3 line. Range: 0 to (240-1) cells |
28 |
PLCP Severely Erred Framing Secs (T3) |
No |
Ingress-1 |
Provides a count of the severely errored seconds based on PLCP framing errors detected on the T3 line. Range: 0 to (240-1) cells |
29 |
Far End Err Seconds (T3) |
No |
Ingress-1 |
Provides a count of the seconds errors are detected at the far end of the T3 line. Range: 0 to (240-1) cells |
30 |
Far end severely errored secs. (T3) |
T3 far end errored seconds |
Ingress-1 |
Provides a count of the severely errored seconds (SES) that occur at the far end of the T3 line. Severely errored seconds are classified as errored seconds that are greater than the total line bits per second multiplied by 10-6. Range: 0 to (240-1) cells |
31 |
Far end line unavailable secs. (T3) |
No |
Ingress-1 |
Provides a count of the unavailable seconds at the far end of the T3 line. Unavailable seconds are defined as 10 contiguous severely errored seconds. Range: 0 to (240-1) cells) |
PXM1E E3 Physical Line
This section provides information about the statistics contained in the PXM1E Physical Line E3 group. The PXM1E E3 line statistics in this group are applicable to the MGX 8830 and MGX 8850 nodes.
The following table lists the attributes that are common to the PXM1E E3 line statistics.
Front Cards |
PXM1E-8-T3E3, PXM1E-T3E3-155 (combo card) |
Back Cards |
MGX-SMB-8E3, MGX-FRU-T3E3-155 |
Object Type |
11 |
Subobject Type |
9 |
Allowable Peak Intervals |
60 seconds, 300 seconds |
Default Peak Interval |
300 seconds |
The PXM1E E3 physical line statistics are primarily used for gathering troubleshooting and performance data.
The tables in this section include the description of each statistic and the point during the data flow at which the statistic gathers the appropriate information. Each measurement point refers to the corresponding point in Figure 4-1.
|
Stat ID
|
PXM1E E3 Physical Line Statistics
|
Subset of Other Stats
|
Ingress/Egress Measurement Point
|
Description
|
0 |
occurrences of LOS defect st. (E3) |
No |
Ingress-1 |
Provides a count of the times a loss of signal (LOS) is detected on the E3 line. The count includes the number of LOS alarms. Range: 0 to (240-1) cells |
1 |
occurrences of LOF defect st. (E3) |
No |
Ingress-1 |
Provides a count of the loss of frames (LOFs) that are encountered by the E3 line. Range: 0 to (240-1) cells |
2 |
occurrences of AIS defect st. (E3) |
No |
Ingress-1 |
Provides a count of the alarm indication signal (AIS) instances on the E3 line. Range: 0 to (240-1) cells |
3 |
occurrences of YEL defect st. (E3) |
No |
Ingress-1 |
Provides a count of the times yellow alarms are detected on the E3 line. Range: 0 to (240-1) cells |
4 |
occurrences of LOC state (E3) |
No |
Ingress-1 |
Provides a count of the loss of cell delineation defect states on the E3 line. Range: 0 to (240-1) cells |
5 |
Trail trace byte mismatch (E3) |
No |
Ingress-1 |
Provides a count of the trail trace byte (TTB) mismatch occurrences on the E3 line. Range: 0 to (240-1) cells |
6 |
Line Code Violation Count (E3) |
No |
Ingress-1 |
Provides a count of the line code violations encountered by the E3 line. Range: 0 to (240-1) cells |
7 |
Line error secs. (E3) |
No |
Ingress-1 |
Provides a count of the errored seconds on the E3 line. Range: 0 to (240-1) cells |
8 |
Line severe error secs. (E3) |
No |
Ingress-1 |
Provides a count of severely errored that occur on the E3 line. Range: 0 to (240-1) cells |
9 |
P-Bit Code Violation Count (E3) |
No |
Ingress-1 |
Provides a count of the P-bit parity codes that do not match the locally calculated parity code on the E3 line. Range: 0 to (240-1) cells |
10 |
P-bit error secs. (E3) |
No |
Ingress-1 |
Provides a count of the seconds with at least one P-bit error on the E3 line. Range: 0 to (240-1) cells |
11 |
P-bit severe error secs. (E3) |
No |
Ingress-1 |
Provides a count of the P-bit severely errored seconds on the E3 line. Range: 0 to (240-1) cells |
12 |
Severe Errored Framing Secs. (E3) |
No |
Ingress-1 |
Provides a count of the severely errored framing seconds that occur within the collection interval on the E3 line. Range: 0 to (240-1) cells |
13 |
Unavailable Seconds (E3) |
No |
Ingress-1 |
Provides a count of the unavailable seconds on the E3 line. Unavailable seconds are defined as 10 contiguous severely errored seconds. Range: 0 to (240-1) cells |
14 |
Far End Block Error Count (E3) |
No |
Ingress-1 |
Provides a count of the far end block errors that occur within the collection interval on the E3 line. Range: 0 to (240-1) cells |
15 |
Far End Err Seconds (E3) |
No |
Ingress-1 |
Provides a count of the seconds errors are detected at the far end of the E3 line. Range: 0 to (240-1) cells |
16 |
Far end severely errored secs. (E3) |
No |
Ingress-1 |
Provides a count of the severely errored seconds (SES) that occur at the far end of the T3 line. Severely errored seconds are classified as errored seconds that are greater than the total line bits per second multiplied by 10-6. Range: 0 to (240-1) cells |
17 |
Far end line unavailable secs. (E3) |
No |
Ingress-1 |
Provides a count of the unavailable seconds at the far end of the E3 line. Unavailable seconds are defined as 10 contiguous severely errored seconds. Range: 0 to (240-1) cells) |
PXM1E SONET Physical Line
This section provides information about the statistics contained in the PXM1E_SONET_ATM group. The PXM1E SONET physical line statistics in this group are applicable to the MGX 8830 and MGX 8850 (PXM1E) switches.
The following table lists the attributes that are common to the PXM1E SONET physical line statistics.
Front Cards |
PXM1E-8-155, PXM1E-2-622, PXM1E-T3E3-155 (combo card) |
Back Cards |
MGX-SMFIR-8-155LC/B, MGX-SMFLR-8-155LC/B, MGB-MMF-8-155/B, MGX-SMFIR-8-155LC/C, MGX-SMFLR-8-155LC/C, MGB-MMF-8-155/C, MGX-SMFIR-2-622/B, MGX-SMFLR-2-622/B, MGX-SMFIR-2-622/C, MGX-SMFLR-2-622/C, MGX-FRU-T3E3-155 |
Object Type |
11 |
Subobject Type |
10 |
Allowable Peak Intervals |
60 seconds, 300 seconds |
Default Peak Interval |
300 seconds |
The PXM1E SONET physical line statistics are primarily used for gathering troubleshooting and performance data.
The tables in this section include the description of each statistic and the point during the data flow at which the statistic gathers the appropriate information. Each measurement point refers to the corresponding point in Figure 4-1.
|
Stat ID
|
PXM1E SONET Physical Line Statistics
|
Subset of Other Stats
|
Ingress/Egress Measurement Point
|
Description
|
0 |
occurrences LOS defect st. (OC) |
No |
Ingress-1 |
Provides a count of the times a loss of signal (LOS) is detected on the SONET line. The count includes the number of LOS alarms. Range: 0 to (240-1) cells |
1 |
occurrences LOF defect st. (OC) |
No |
Ingress-1 |
Provides a count of the loss of frames (LOFs) that are encountered by the SONET line. Range: 0 to (240-1) cells |
2 |
occurrences AIS defect st. (OC) |
No |
Ingress-1 |
Provides a count of the alarm indication signal (AIS) instances on the SONET line. Range: 0 to (240-1) cells |
3 |
occurrences YEL defect st. (OC) |
No |
Ingress-1 |
Provides a count of the times yellow alarms are detected on the SONET line. Range: 0 to (240-1) cells |
4 |
occurrences of LOC state (OC) |
No |
Ingress-1 |
Provides a count of the loss of cell delineation defect states on the SONET line. Range: 0 to (240-1) cells |
5 |
Instances of Loss of Pointer (OC) |
No |
Ingress-1 |
Provides a count of the loss of pointer defect states on the SONET line. Range: 0 to (240-1) cells |
6 |
Instances of Path AIS (OC) |
No |
Ingress-1 |
Provides a count of the AIS instances on the path. Range: 0 to (240-1) cells |
7 |
Instances of Path Yellow (OC) |
No |
Ingress-1 |
Provides a count of the times yellow alarms are detected on the path. Range: 0 to (240-1) cells |
8 |
Trace section |
No |
Ingress-1 |
Provides a count of the section traces. Range: 0 to (240-1) cells |
9 |
Trace Path |
No |
Ingress-1 |
Provides a count of the path traces. Range: 0 to (240-1) cells |
10 |
Aps_mis |
No |
Ingress-1 |
Provides a count of the total automatic protection system (APS) mismatches. Range: 0 to (240-1) cells |
11 |
Aps_psbf |
No |
Ingress-1 |
Provides a count of the protection switching byte failures (PSBFs) that are detected on the SONET line. Range: 0 to (240-1) cells |
12 |
Aps_chan_mis |
No |
Ingress-1 |
Provides a count of the APS channel mismatches that are detected on the SONET line. Range: 0 to (240-1) cells |
13 |
Aps_mode_mis |
No |
Ingress-1 |
Provides a count of the APS mode mismatches that are detected on the SONET line. Range: 0 to (240-1) cells |
14 |
Aps_fe_prot |
No |
Ingress-1 |
Provides a count of the switches to fast Ethernet protocol. Range: 0 to (240-1) cells |
15 |
Code violations for section (OC) |
No |
Ingress-1 |
Provides a count of the section code violations. Range: 0 to (240-1) cells |
16 |
Errored secs for section (OC) |
No |
Ingress-1 |
Provides a count of the section errored seconds that occur within the collection interval. Range: 0 to (240-1) cells |
17 |
SES for section (OC) |
No |
Ingress-1 |
Provides a count of the section severely errored seconds that occur within the collection interval. Severely errored seconds are classified as errored seconds that are greater than the total line bits per second multiplied by 10-6. Range: 0 to (240-1) cells |
18 |
SEFS for section (OC) |
No |
Ingress-1 |
Provides a count of the section severely errored framing seconds. Range: 0 to (240-1) cells |
19 |
Code violations for line (OC) |
No |
Ingress-1 |
Provides a count of the code violations encountered by the SONET line. Range: 0 to (240-1) cells |
20 |
Erred secs for line (OC) |
No |
Ingress-1 |
Provides a count of the errored seconds that occur within the collection interval on the SONET line. Range: 0 to (240-1) cells |
21 |
Severely errored secs for line (OC) |
No |
Ingress-1 |
Provides a count of the severely errored seconds that occur within the collection interval on the SONET line. Severely errored seconds are classified as errored seconds that are greater than the total line bits per second multiplied by 10-6. Range: 0 to (240-1) cells |
22 |
Unavailable secs for line (OC) |
No |
Ingress-1 |
Provides a count of the unavailable seconds on the SONET line. Unavailable seconds are defined as 10 contiguous severely errored seconds. Range: 0 to (240-1) cells |
23 |
CV for line at far end (OC) |
No |
Ingress-1 |
Provides a count of the code violations at the far end of the line. Range: 0 to (240-1) cells |
24 |
Errored secs for line at far end (OC) |
No |
Ingress-1 |
Provides a count of the errored seconds that occur at the far end of the line. Range: 0 to (240-1) cells |
25 |
SES at far end for line (OC) |
No |
Ingress-1 |
Provides a count of the severely errored seconds at the far end of the line. Severely errored seconds are classified as errored seconds that are greater than the total line bits per second multiplied by 10-6. Range: 0 to (240-1) cells |
26 |
UAS at far end for line (OC) |
No |
Ingress-1 |
Provides a count of the section unavailable seconds for the line. Unavailable seconds are defined as 10 contiguous severely errored seconds. Range: 0 to (240-1) cells |
27 |
Code violations for path (OC) |
No |
Ingress-1 |
Provides a count of the path code violations. Range: 0 to (240-1) cells |
28 |
Erred secs for path (OC) |
No |
Ingress-1 |
Provides a count of the path errored seconds. Range: 0 to (240-1) cells |
29 |
Severely errored secs for path (OC) |
No |
Ingress-1 |
Provides a count of the path severely errored seconds. Severely errored seconds are classified as errored seconds that are greater than the total line bits per second multiplied by 10-6. Range: 0 to (240-1) cells |
30 |
Unavailable secs for path (OC) |
No |
Ingress-1 |
Provides a count of the path unavailable seconds for the line. Unavailable seconds are defined as 10 contiguous severely errored seconds. Range: 0 to (240-1) cells |
31 |
CV for path at far end (OC) |
No |
Ingress-1 |
Provides a count of the path code violations at the far end of the line. Range: 0 to (240-1) cells |
32 |
Erred secs for path at far end (OC) |
No |
Ingress-1 |
Provides a count of the path errored seconds that occur at the far end of the line. Range: 0 to (240-1) cells |
33 |
SES at far end for path (OC) |
No |
Ingress-1 |
Provides a count of the path severely errored seconds at the far end of the line. Severely errored seconds are classified as errored seconds that are greater than the total line bits per second multiplied by 10-6. Range: 0 to (240-1) cells |
34 |
UAS at far end for path (OC) |
No |
Ingress-1 |
Provides a count of the path unavailable seconds for the line. Unavailable seconds are defined as 10 contiguous severely errored seconds. Range: 0 to (240-1) |
PXM1E T1E1 Physical Line Stats
This section provides information about the statistics contained in the PXM1E T1E1 physical line statistics. The PXM1E T1/E1 statistics are applicable to the MGX 8830 and MGX 8850 (PXM45) switches.
The following table lists the attributes that are common to the PXM1E T1/E1 statistics.
Front Cards |
PXM1E-16T1E1 |
Back Cards |
16 Port T1E1 RJ48, 16 Port E1 MCC |
Object Type |
11 |
Subobject Type |
11 |
Default Peak Interval |
300 seconds |
The PXM1E T1/E1 statistics are primarily used for gathering performance data.
The following table includes the description of each statistic and the point during the data flow at which the statistic gathers the appropriate information. Each measurement point refers to the corresponding point in Figure 4-1.
|
Stat ID
|
PXM1E T1/E1 Physical Line Statistics
|
Subset of Other Stats
|
Ingress/Egress Measurement Point
|
Description
|
0 |
Errored Seconds |
— |
— |
Provides a count of the line code violation errored seconds. Range: 0 to (232-1) |
1 |
Severely Errored Seconds |
— |
— |
Provides a count of the near end severely errored seconds (SES) that occur within the collection interval. Severely errored seconds are classified as errored seconds that are greater than the total line bits per second multiplied by 10-6. Range: 0 to (232-1) |
2 |
Severely Errored Framing Seconds |
No |
Ingress-1 |
Provides a count of the severely errored framing seconds that occur within the collection interval on the T1/E1 line. Range: 0 to (240-1) cells |
3 |
Unavailable Seconds |
No |
Ingress-1 |
Provides a count of the unavailable seconds on the T1/E1 line. Unavailable seconds are defined as 10 contiguous severely errored seconds. Range: 0 to (240-1) cells |
4 |
Path coding violations |
— |
— |
Provides a count of the path code violations that are encountered by the interface. These violations occur when more than three zeroes in a row are transmitted. Range: 0 to (232-1) |
5 |
Line Errored Seconds |
— |
— |
Provides a count of the line code violation errored seconds. Range: 0 to (232-1) |
6 |
Line Severely Errored Seconds |
— |
— |
Provides a count of the line code violation severely errored seconds (SES) that are encountered by the interface. Severely errored seconds are classified as errored seconds that are greater than the total line bits per second multiplied by 10-6. Range: 0 to (232-1) |
7 |
Path SEF/AIS Encountered |
— |
— |
Provides a count of the severely errored frames or an alarm indication signals (AIS) detected on the T1/E1 line. Range: 0 to (232-1) |
8 |
No. of occurrences of Loss of Signal |
No |
Ingress-1 |
Provides a count of the times a loss of signal (LOS) is detected on the T1/E1 line. The count includes the number of LOS alarms. Range: 0 to (240-1) cells |
9 |
No. of occurrences of Out of Frame |
No |
Ingress-1 |
Provides a count of the times an out of frame (OOF) is detected. The count includes the number of OOF alarms. Range: 0 to (232-1) |
10 |
No. of occurrences of RAI |
No |
Ingress-1 |
Provides a count of the remote alarm indication (RAI) occurrences on the T1/E1 line. Range: 0 to (232-1) |
11 |
Far-end Errored Seconds |
No |
Ingress-1 |
Provides a count of the seconds errors are detected at the far end of the T1/E1 line. Range: 0 to (240-1) cells |
12 |
Far-end severely Errored Seconds |
— |
— |
Provides a count of the far end SES that occur within the collection interval. Severely errored seconds are classified as errored seconds that are greater than the total line bits per second multiplied by 10-6. Range: 0 to (232-1) |
13 |
Far-end severely Errored Framing Secs |
No |
Ingress-1 |
Provides a count of the severely errored framing seconds that occur within the collection interval on the T1/E1 line. Range: 0 to (240-1) cells |
14 |
Far-end Unavailable Seconds |
No |
Ingress-1 |
Provides a count of the unavailable seconds at the far end of the T1/E1 line. Unavailable seconds are defined as 10 contiguous severely errored seconds. Range: 0 to (240-1) |
15 |
Far-end line errored Seconds |
— |
— |
Provides a count of the line code violation errored seconds at the far end. Range: 0 to (232-1) |
16 |
Far-end path coding violations |
— |
— |
Provides a count of the path code violations that are encountered at the far end. These violations occur when more than three zeroes in a row are transmitted. Range: 0 to (232-1) |
17 |
Line code violations |
No |
Ingress-1 |
Provides a count of the line code violations encountered by the T1/E1 line. Range: 0 to (240-1) cells) |

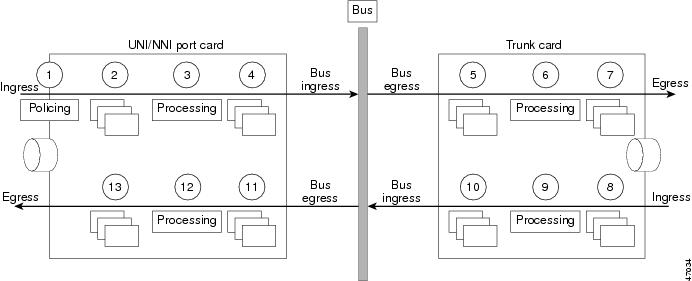
 Feedback