- Overview of Prime Network GUI clients
- Setting Up the Prime Network Clients
- Setting Up Change and Configuration Management
- Setting Up Vision Client Maps
- Setting Up Native Reports
- Setting Up Fault Management and the Events Client Default Settings
- Viewing Devices, Links, and Services in Maps
- Drilling Down into an NE’s Physical and Logical Inventories and Changing Basic NE Properties
- Manage Device Configurations and Software Images
- How Prime Network Handles Incoming Events
- Managing Tickets with the Vision Client
- Viewing All Event Types in Prime Network
- Cisco Path Tracer
- Managing IP Address Pools
- Monitoring AAA Configurations
- Managing DWDM Networks
- Managing MPLS Networks
- Managing Carrier Ethernet Configurations
- Managing Ethernet Networks Using Operations, Administration, and Maintenance Tools
- Monitoring Carrier Grade NAT Configurations
- Monitoring Quality of Service
- Managing IP Service Level Agreement (IP SLA) Configurations
- Monitoring IP and MPLS Multicast Configurations
- Managing Session Border Controllers
- Monitoring BNG Configurations
- Managing Mobile Transport Over Pseudowire (MToP) Networks
- Managing Mobile Networks
- Managing Data Center Networks
- Monitoring Cable Technologies
- Monitoring ADSL2+ and VDSL2 Technologies
- Monitoring Quantum Virtualized Packet Core
- VSS Redundancy System
- Icon Reference
- Permissions Required to Perform Tasks Using the Prime Network Clients
- Correlation Examples
- Managing certificates
Cisco Prime Network User Guide, 5.0
Bias-Free Language
The documentation set for this product strives to use bias-free language. For the purposes of this documentation set, bias-free is defined as language that does not imply discrimination based on age, disability, gender, racial identity, ethnic identity, sexual orientation, socioeconomic status, and intersectionality. Exceptions may be present in the documentation due to language that is hardcoded in the user interfaces of the product software, language used based on RFP documentation, or language that is used by a referenced third-party product. Learn more about how Cisco is using Inclusive Language.
- Updated:
- July 20, 2017
Chapter: Correlation Examples
- Correlation Scenario Overview
- Correlation Scenarios
- Device Unreachable Correlation Scenarios
- Multiroute Correlation Scenarios
- BGP Neighbor Loss Correlation Scenarios
- EFP Down Correlation Scenarios
- HSRP Scenarios
- IPInterface Failure Scenarios
- GRE Tunnel Down/Up
- GRE Tunnel Down Correlation Example 1
- GRE Tunnel Down Correlation Example 2
- Q-in-Q Subinterface Down Correlation Scenarios
- VSI Down Correlation Scenarios
- Root Cause Across Frame Relay, ATM, or Ethernet Clouds
- MPLS Fault Scenarios
Event Correlation Examples
The following topics provide examples of how Prime Network correlates events:
Correlation Scenario Overview
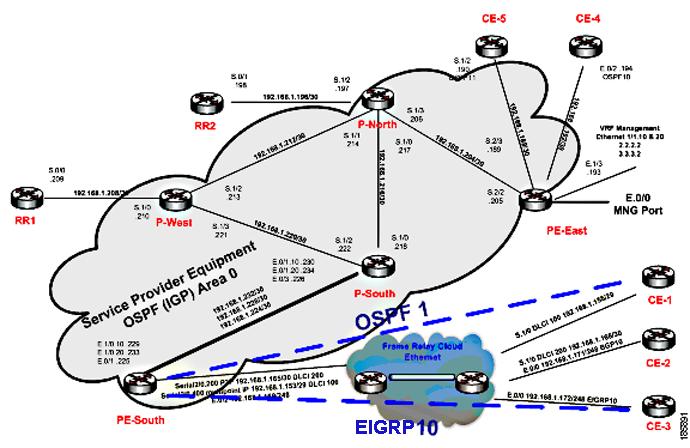
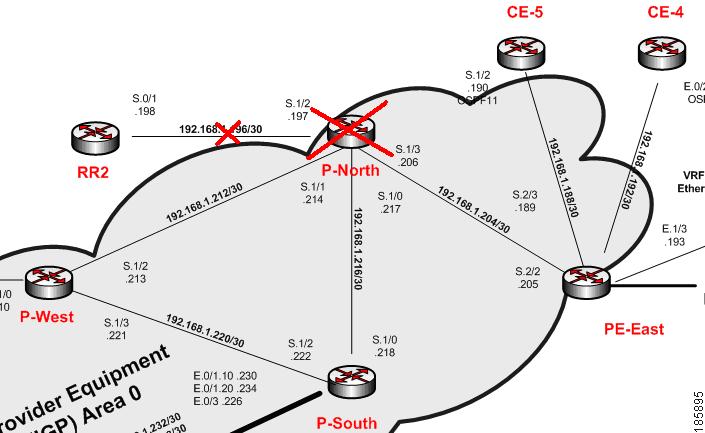
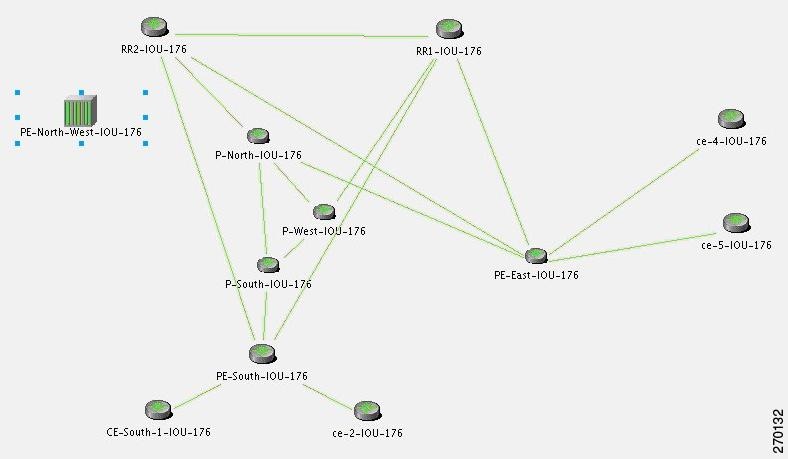
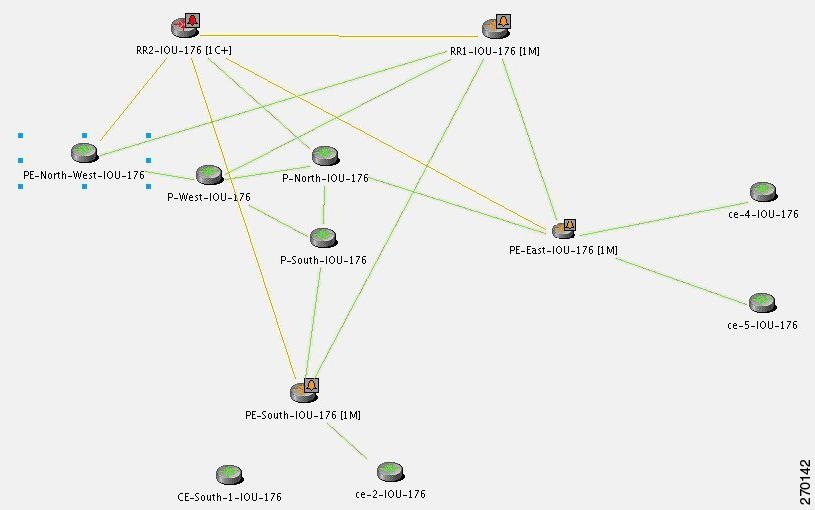
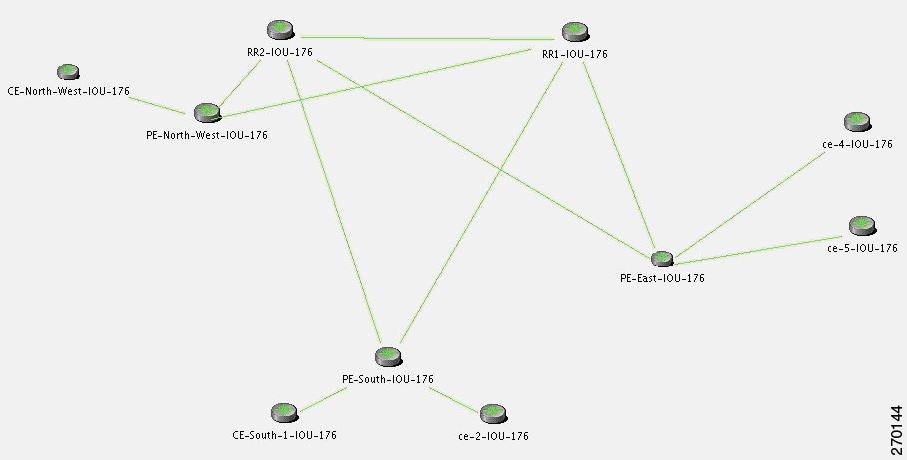
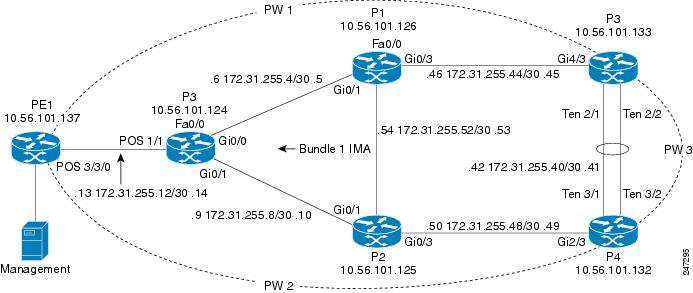
The following scenarios demonstrate Prime Network correlation functionality. Figure C-1 shows the lab setup for the scenarios described in these topics. The lab simulates a service provider (SP) network. The core is based on MPLS and uses OSPF as the Interior Gateway Protocol (IGP).
The P-network is topologically contiguous, whereas the C-network is delineated into a number of sites (contiguous parts of the customer network that are connected in some way other than through the VPN service). Note that a site does not need to be geographically contained.
The devices that link the customer sites to the P-network are called customer edge (CE) devices, whereas the service provider devices to which the CE routers connect are called provider edge (PE) devices. Where the provider manages an Ethernet access network, the CE devices are connected to the PE devices, which are usually LAN switches with Layer 3 capabilities.
The access network can be any Layer 2 technology.
In this lab there are two Layer 2 technologies in the access network:
The access network in the lab is unmanaged (a cloud).
In most cases, the P-network is made up of more than just the PE routers. These other devices are called P-devices (or, if the P-network is implemented with Layer 3 technology, P routers). Similarly, the additional Layer 3 devices at the customer sites that have no direct connectivity to the P-network are called C routers. In this example, C-routers are not part of the lab setup and are not managed by Prime Network.
The CE devices are located at the customer site and can be managed by the SP. All other devices (PEs, Ps, and RRs) are located at the SP site. These devices are maintained by the SP.
An end-to-end MPLS VPN solution is, like any other VPN solution, divided into the central P-network to which a large number of customer sites (sites in the C-network) are attached. The customer sites are attached to the PE devices (PE routers) through CE devices (CE routers). Each PE router contains several VRF tables, at least one per VPN customer. These tables are used together with multiprotocol BGP to run between the PE routers to exchange customer routes and to propagate customer datagrams across the MPLS network. The PE routers perform the label imposition (ingress PE router) and removal (egress PE router). The central devices in the MPLS network (P routers) perform simple label switching.
There are BGP processes running on the PE devices, and each PE is a neighbor to both RR devices. This way, the lab has a backup if one RR is down.
All the devices are managed inband. The management access point is Ethernet 0/0 on PE-East. To enable access to the CE devices, a loop was created between two ports on PE-East.
Figure C-1 Correlation Scenarios Lab Setup
Correlation Scenarios
The following topics describe specific alarms that use correlation logic on top of the root cause analysis flow:
- Device Unreachable Correlation Scenarios
- Multiroute Correlation Scenarios
- BGP Neighbor Loss Correlation Scenarios
- EFP Down Correlation Scenarios
- HSRP Scenarios
- IP Interface Failure Scenarios
- GRE Tunnel Down/Up
- Q-in-Q Subinterface Down Correlation Scenarios
- VSI Down Correlation Scenarios
Device Unreachable Correlation Scenarios
Device reachability is measured by management protocol connectivity. Connectivity tests are used to verify the connection between VNEs and the managed network elements. The connectivity is tested on each protocol a VNE uses to poll a device. Prime Network-supported protocols for connectivity tests are SNMP, Telnet, and ICMP.
The following topics describe the scenarios in which device reachability issues occur:
Device Unreachable on Device Reload or Device Down Event
Figure C-2 illustrates the lab setup for Device Unreachable on Device Down or Device Reload event.
Figure C-2 Lab Setup for Device Unreachable on Device Down or Device Reload Event
Description of Fault Scenario in the Network
CE-5 goes down or is reloaded.
- The port S.1/2 of CE-5 operationally goes down (between CE-5 and PE-East).
- The port S.2/3 of PE-East operationally goes down (between PE-East and CE-5).
- CE-5 is unreachable from the management subnet.

Note![]() Other related faults might occur due to the CE-5 down or reload. Syslogs and traps corresponding to network faults are also reported. Additional faults, other than for the connectivity issue of CE-5 and the Link Down with the PE-East device, might be reported but are not described in this section. This topic relates specifically to Device Unreachable events.
Other related faults might occur due to the CE-5 down or reload. Syslogs and traps corresponding to network faults are also reported. Additional faults, other than for the connectivity issue of CE-5 and the Link Down with the PE-East device, might be reported but are not described in this section. This topic relates specifically to Device Unreachable events.
Prime Network Failure Processing
The following service alarms are generated by the system:
The device unreachability event means that no other information can be collected from this device by the VNE.
The Link Down event is issued by the PE-East VNE (active) as a result of the link down negotiation process.
1.![]() Prime Network waits two minutes. For more information, see How Prime Network Correlates Incoming Events.
Prime Network waits two minutes. For more information, see How Prime Network Correlates Incoming Events.
2.![]() After two minutes, the following occurs:
After two minutes, the following occurs:
–![]() The [Device Unreachable, CE-5] event triggers the CE-5 VNE to initiate an IP-based flow to the management IP address:
The [Device Unreachable, CE-5] event triggers the CE-5 VNE to initiate an IP-based flow to the management IP address:
Flow Path: CE-5 > PE-East > management subnet
–![]() The [Link Down on Unreachable, PE-East < > CE-5] event triggers the CE-5 VNE to initiate local correlation.
The [Link Down on Unreachable, PE-East < > CE-5] event triggers the CE-5 VNE to initiate local correlation.
For the event [Device Unreachable, CE-5]:
Note![]() Other possible events are also collected, such as Interface Status Down events.
Other possible events are also collected, such as Interface Status Down events.
Note![]() The root cause selection process activates special filtering for the event [Device Unreachable, CE-5] for which the event [Link Down on Unreachable] cannot be selected as the root cause; therefore, the event [Link Down on Unreachable, PE-East < > CE-5] is not selected as the root cause.
The root cause selection process activates special filtering for the event [Device Unreachable, CE-5] for which the event [Link Down on Unreachable] cannot be selected as the root cause; therefore, the event [Link Down on Unreachable, PE-East < > CE-5] is not selected as the root cause.
For the event [Link Down on Unreachable, PE-East < > CE-5]:
Figure C-3 shows how the events are correlated in this scenario.
Figure C-3 Device Unreachable on Device Down
When a down or reloaded device comes up again and starts responding to polling requests made by the corresponding VNE, the device is declared reachable, thus clearing the unreachable alarm. Other related alarms are cleared in turn after the corresponding VNEs verify that the malfunctions have been resolved.
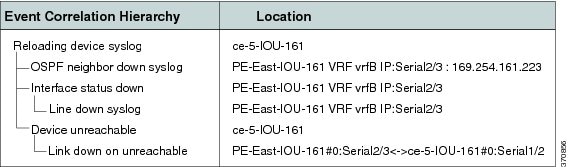
In a device reload scenario, the following additional events are identified by the system (in addition to the device down scenario):
For the event [Device Unreachable, CE-5]:
- Additional Collected Event: [Reloading Device syslog, CE-5].
- Root Cause: Correlates to [Reloading Device syslog, CE-5].
Figure C-4 shows how the event are correlated in this scenario.
Figure C-4 Device Unreachable on Device Reload
Device Unreachable on Another Device Unreachable Event
Figure C-5 illustrates the lab setup for Device Unreachable on another Device Unreachable event.
Figure C-5 Lab Setup for Device Unreachable on Another Device Unreachable Event
Description of Fault Scenario in the Network
Prime Network Failure Processing
Note![]() This scenario is similar to the one described in Device Unreachable on Device Reload or Device Down Event, except that in this scenario the L3 Link Down is not discovered because both connected devices (RR2 and P-North) are unreachable by Prime Network. Therefore, the VNE is unable to detect the Link Down problem.
This scenario is similar to the one described in Device Unreachable on Device Reload or Device Down Event, except that in this scenario the L3 Link Down is not discovered because both connected devices (RR2 and P-North) are unreachable by Prime Network. Therefore, the VNE is unable to detect the Link Down problem.
The following service alarms are generated by the system:
The device unreachability event means that no other information can be collected from this device by the VNE.
1.![]() Prime Network waits two minutes.
Prime Network waits two minutes.
2.![]() After two minutes, the following occurs:
After two minutes, the following occurs:
- The [Device Unreachable, P-North] event triggers the P-North VNE to initiate an IP-based flow to the management IP subnet:
Flow Path: P-North > PE-East > management subnet
- The [Device Unreachable, RR2] event triggers the RR2 VNE to initiate an IP-based flow to the management IP.
Flow Path: RR2 > P-North > PE-East > management subnet
–![]() Collected Events: [Reloading Device syslog, P-North].
Collected Events: [Reloading Device syslog, P-North].
–![]() Root Cause: Correlates to [Reloading Device syslog, P-North].
Root Cause: Correlates to [Reloading Device syslog, P-North].
–![]() Collected Events: [Device Unreachable, P-North] and [Reloading Device syslog, P-North].
Collected Events: [Device Unreachable, P-North] and [Reloading Device syslog, P-North].
–![]() Root Cause: Correlates to [Reloading Device syslog, P-North] (as this has a higher weight than the event [Device Unreachable, P-North]).
Root Cause: Correlates to [Reloading Device syslog, P-North] (as this has a higher weight than the event [Device Unreachable, P-North]).
Figure C-6 displays the events identified by the system in this scenario.
Figure C-6 Device Unreachable on Other Device Unreachable
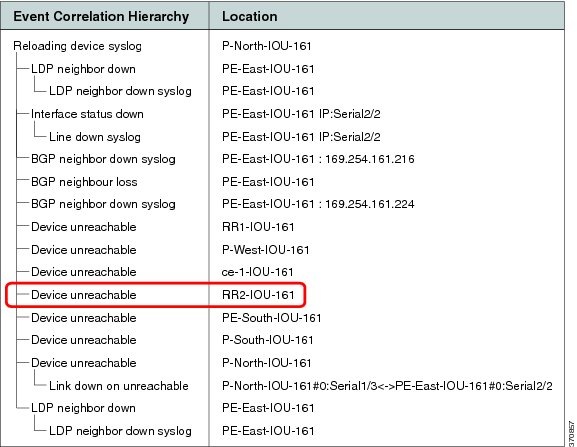
When a reloaded device comes up again (along with the L3 link that is vital for the RR2 management), the RR2 starts responding to polling requests from the RR2 VNE. The device is declared as reachable, thus clearing the Device Unreachable alarm.
Device Unreachable on Link Down Event
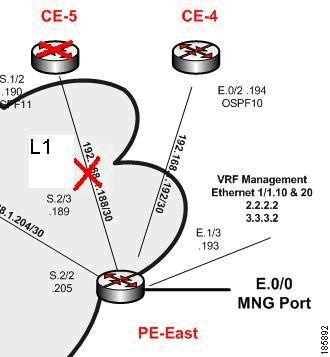
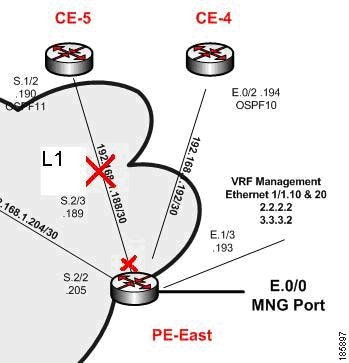
Figure C-7 illustrates the lab setup for a Device Unreachable on a Link Down event.
Figure C-7 Lab Setup for Device Unreachable on a Link Down Event
Description of Fault Scenario in the Network
The S.2/3 port of PE-East connected to the S.1/2 port of the CE-5 device (also called L1 link) is set to administrative status down. This effectively takes the L1 link down.
The CE-5 device is managed from this link with no backup. With the L1 link down, the CE-5 device is unreachable from the management subnet.
Prime Network Failure Processing
The following service alarms are generated by the system:
The device unreachability event means that no other information can be collected from this device by the VNE.
The Link Down event is issued by the PE-East VNE (active) as a result of the link down negotiation process.
[Link Down Due to Admin Down, PE-East < > CE-5]
This event opens a new ticket in the gateway.
The L1 Link Down event is configured to not correlate to other events. This is logical because the edge VNEs identify the Link Down events as [Link Down Due to Admin Down] events. This implies that the VNEs know the root cause of the event already, based on the administrator’s configurations. The [Link Down Due to Admin Down] events reach the northbound interface immediately after the links’ new statuses are discovered by Prime Network and after the link down negotiation methods are completed.
1.![]() Prime Network waits two minutes.
Prime Network waits two minutes.
2.![]() After two minutes, the [Device Unreachable, CE-5] event triggers the CE-5 VNE to initiate an IP-based flow to the management subnet:
After two minutes, the [Device Unreachable, CE-5] event triggers the CE-5 VNE to initiate an IP-based flow to the management subnet:
Flow Path: CE-5 > PE-East > management subnet
For the event [Device Unreachable, CE-5]:
Note![]() Other possible events are also collected, such as Interface Status Down events.
Other possible events are also collected, such as Interface Status Down events.
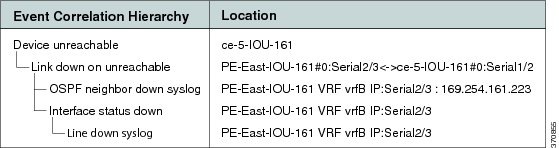
Figure C-8 displays the events identified by the system in this scenario.
Figure C-8 Device Unreachable on Link Down
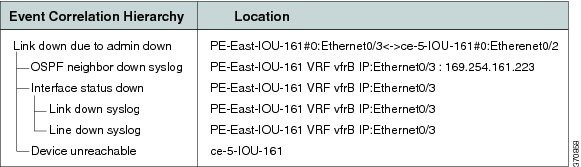
Note![]() In Figure C-8, port E.0/3 should read S.2/3, and E.0/2 should read S.1/2.
In Figure C-8, port E.0/3 should read S.2/3, and E.0/2 should read S.1/2.
When the PE-East port S.2/3 (L1 link) comes up again, the CE-5 reachability from the management subnet also returns. The CE-5 starts responding to polling requests from the CE-5 VNE. The device is declared reachable, thus clearing the Device Unreachable alarm. The L1 Link Down is cleared when the PE-East device indicates that the status of the connected port has changed to up.
Multiroute Correlation Scenarios
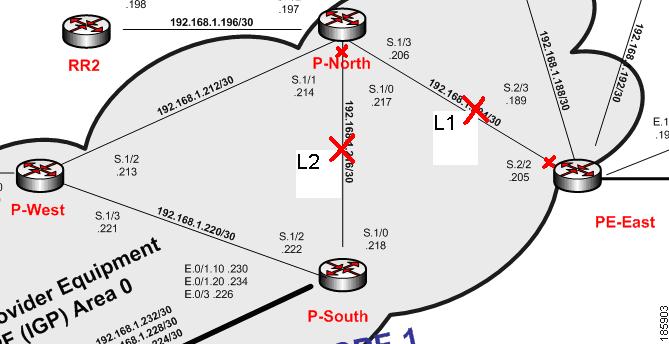
Figure C-9 displays the lab multiroute configuration setup between P-South, P-North, and P-West devices. The OSPF cost is the same along the path from P-South and P-North whether or not it goes via P-West; that is, P-South and P-North connect along two paths with equal cost.
Figure C-9 Lab Multiroute Configuration Setup Between P-South, P-North and P-West
Description of a Fault Scenario in the Network
In this example, the P-North, P-South link (also known as L2) goes down in a multiroute segment between P-South and P-North. After approximately one minute, another link, L1 (PE-East, P-North), also goes down. Both links go down administratively, the first from the P-North device and the second from the PE-East devices’ ports.
Related Faults
Almost all devices are unreachable from the management subnet. This discussion focuses on CE-1 unreachability (see Figure C-1).
Note![]() Syslogs and traps corresponding to network faults are also reported. Additional related faults might also be reported, but are not described in this topic.
Syslogs and traps corresponding to network faults are also reported. Additional related faults might also be reported, but are not described in this topic.
Prime Network Failure Processing
Event Identification
The following service alarms are generated by the system:
The device unreachability event means that no other information can be collected from this device by the VNE.
The Link Down event is issued by the PE-East VNE (active) as a result of the link down negotiation process.
The Link Down event is issued by the P-North VNE as a result of the link down negotiation process.
Noncorrelating Events
For more information, see Noncorrelating Events.
Possible Root Cause
1.![]() Prime Network waits two minutes.
Prime Network waits two minutes.
2.![]() After two minutes, the [Device Unreachable, CE-1] event triggers the CE-1 VNE to initiate an IP-based flow to the management IP subnet:
After two minutes, the [Device Unreachable, CE-1] event triggers the CE-1 VNE to initiate an IP-based flow to the management IP subnet:
Flow Path: CE-1 > Cloud > PE-South > P-South > P-North > PE-East > management subnet
Flow Path: CE-1 > Cloud > PE-South > P-South > P-West > P-North > PE-East > management subnet
Root Cause Selection
For the event [Device unreachable, CE-1]:
–![]() Collected Events: [Link Down Due to Admin Down, P-North < > PE-East] and
Collected Events: [Link Down Due to Admin Down, P-North < > PE-East] and
[Link Down Due to Admin Down, P-South > P-North].
Note Other possible events are also collected, such as Interface Status Down events.
–![]() Root Cause—Correlates to:
Root Cause—Correlates to:
[Link down due to admin down, P-SouthS.1/0 > P-North S.1/0 < > PE-East S.2/2] and
[Link down due to admin down, P-NorthS.1/3 > PE-East S.2/2]
- For the Flow Path CE-1 > Cloud > PE-South > P-South > P-West > P-North > PE-East > management subnet:
Root Cause: Correlates to [Link Down Due to Admin Down, P-North S.1/0 < > PE-East S.2/2]
Note![]() The CE-1’s VNE root cause selection method identifies the Device Unreachable event’s root cause on the L1 Link Down event. According to the logic, when two flows split and result in two sets of possible root cause events, sets that are supersets of others (depending on whether both flows end at the same location) are removed. Sets that are not removed are united into one set containing all events. This implies that, in this scenario, the set that includes both links is removed because it is a superset of the set that contains only the L1 link.
The CE-1’s VNE root cause selection method identifies the Device Unreachable event’s root cause on the L1 Link Down event. According to the logic, when two flows split and result in two sets of possible root cause events, sets that are supersets of others (depending on whether both flows end at the same location) are removed. Sets that are not removed are united into one set containing all events. This implies that, in this scenario, the set that includes both links is removed because it is a superset of the set that contains only the L1 link.
Note![]() All devices that are unreachable correlate their unreachability events to the L1 link as expected.
All devices that are unreachable correlate their unreachability events to the L1 link as expected.
Figure C-10 displays the events identified by the system in this scenario (L1).
Figure C-10 Multiroute Scenario—L1
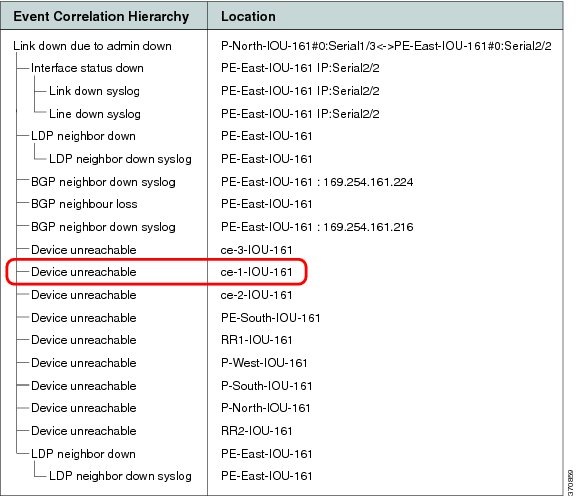
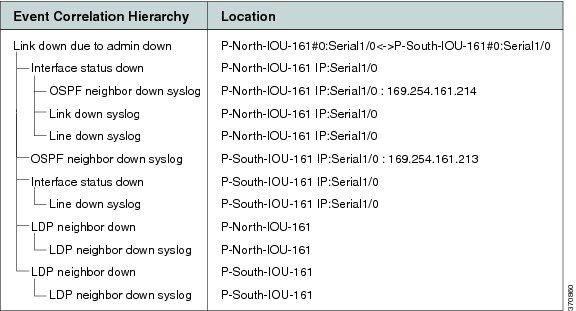
Figure C-11 displays the events identified by the system in this scenario (L2).
Figure C-11 Multiroute Scenario—L2
Clearing Phase
Enabling the L1 link makes the CE-1 device reachable from the management subnet IP address, thereby clearing the Device Unreachable event of the CE-1 device. When the L1 link’s new status is discovered by Prime Network, the PE-East device eventually initiates a Link Up event for this link. When the administrator enables the Layer 2 link and Prime Network discovers this change, the Link Down event is cleared by its matching Link Up event.
BGP Neighbor Loss Correlation Scenarios
The VNE models the BGP connection between routers and actively monitors its state. BGP neighbor loss events are generated from both sides of the connection only when connectivity is lost, and when the other side of the link is unmanaged.
The correlation engine identifies various faults that affect the BGP connection and reports them as the root cause for the BGP Neighbor Loss alarm; for example, Link Down, CPU Overutilized, and Link Data Loss.
Figure C-12 Lab Setup for BGP Neighbor Loss Correlation Scenarios
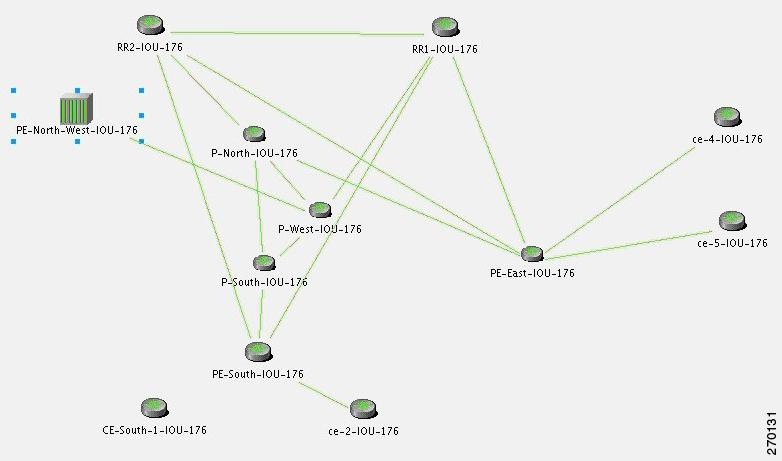
Note![]() In Figure C-12 the link between P-West and PE-North-West is not real and merely emphasizes how PE-North-West is connected in the network.
In Figure C-12 the link between P-West and PE-North-West is not real and merely emphasizes how PE-North-West is connected in the network.
There are two main scenarios that might lead to a BGP neighbor loss event:
BGP Neighbor Loss Due to Port Down
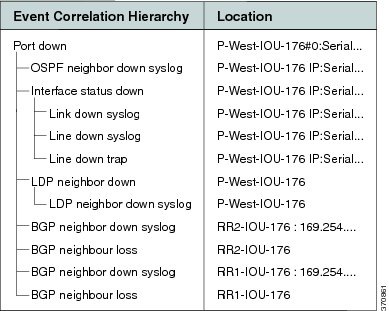
Figure C-13 displays the BGP neighbor loss due to port down scenario.
Figure C-13 BGP Neighbor Loss Due to Physical Port Down (P-West > PE-North-West)
Description of Fault Scenario in the Network
In Figure C-13 the BGP neighbor loss occurs due to a physical port down (in P-West that connects to PE-North-West). The relevant devices are PE-North-West, RR2, P-North and P-West.
- Port on P-West that is connected to the PE-North-West goes down.
- BGP neighbor, on RR2, to PE-North-West changes state from Established to Idle.
Note![]() Syslogs and traps corresponding to network faults are also reported. Additional related faults might also be reported, but are not included in this discussion.
Syslogs and traps corresponding to network faults are also reported. Additional related faults might also be reported, but are not included in this discussion.
Prime Network Failure Processing
The following service alarms are generated by the system:
Since the VNE that monitors each PE or RR holds records of the entire device’s BGP information, the change in the BGP table is identified by the VNE and causes it to send this event.
1.![]() Prime Network waits two minutes. For more information, see How Prime Network Correlates Incoming Events.
Prime Network waits two minutes. For more information, see How Prime Network Correlates Incoming Events.
2.![]() After two minutes, the [BGP Neighbor Loss, RR2] event triggers the VNE to initiate an IP-based flow to the destination IP of its lost BGP neighbor (PE-North-West):
After two minutes, the [BGP Neighbor Loss, RR2] event triggers the VNE to initiate an IP-based flow to the destination IP of its lost BGP neighbor (PE-North-West):
Flow Path: RR2 > P-North > P-West > P-West port is connected to PE-North-West (which is unmanaged), and is in a down state.
For the event [BGP Neighbor Loss, RR2]:
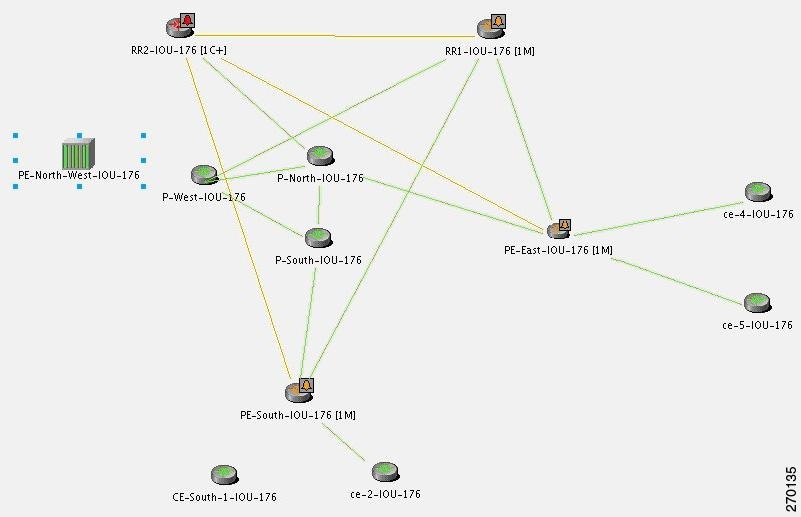
Figure C-14 displays the events identified by the system in this scenario.
Figure C-14 BGP Neighbor Loss Due to Physical Port Down
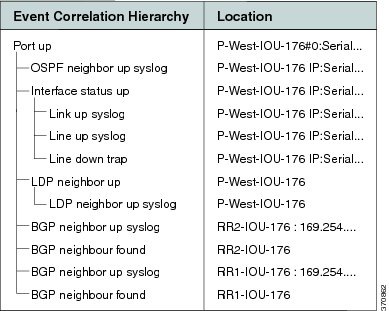
When a Port Up event is detected by the system for the same port that was detected as the root cause for the BGP Neighbor Loss event, the alarm is cleared. The ticket is cleared (colored green) when all the alarms in the ticket have been cleared.
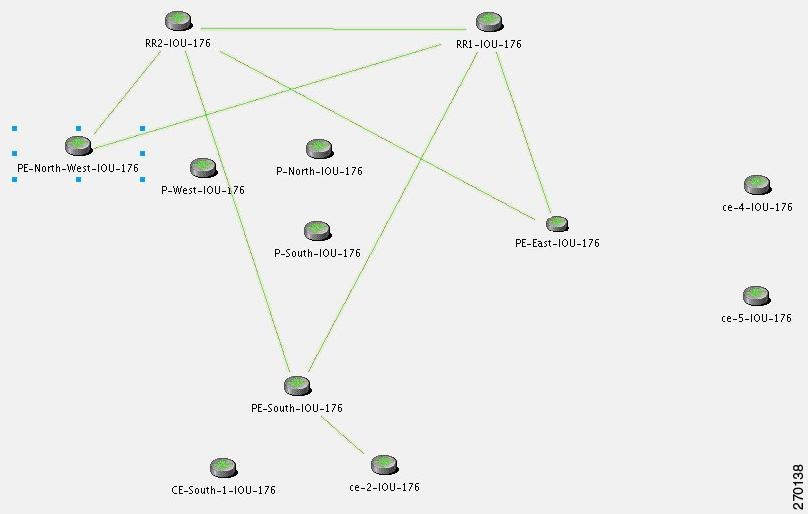
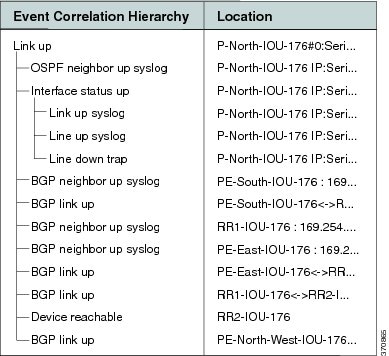
Figure C-15 displays the up event that clears all the down events identified by the system.
Figure C-15 BGP Neighbor Up Event that Clears All the Down Events
In a BGP process down scenario, the BGP Process Down event is identified by the system in addition to the BGP Neighbor Loss event.
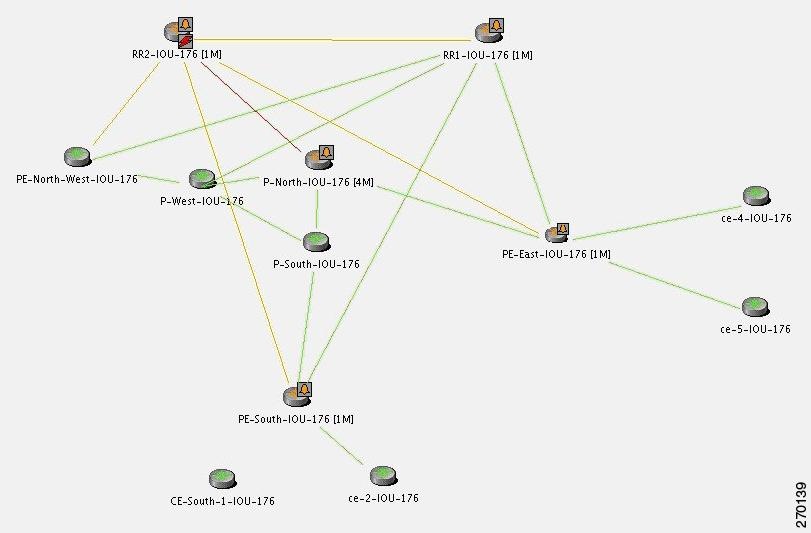
As illustrated in Figure C-16, the BGP Process Down event causes several events (the BGP Neighbor Loss event cannot be seen). The relevant devices are RR2 (BGP Process Down, marked in red) and PE-North-West (marked as unmanaged).
Figure C-16 BGP Process Down Causes Several Events
For the event [BGP Neighbor Loss, RR2]:
- Additional Collected Events: [BGP Process Down, RR2], [BGP Neighbor Loss, RR2].
- Root cause: Correlates to [BGP Process Down, RR2].
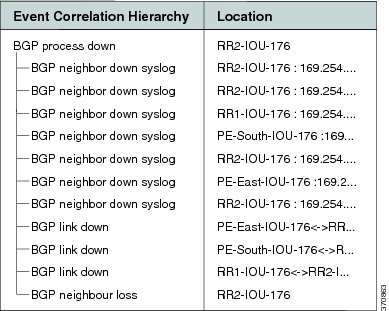
Figure C-17 displays the events identified by the system in this scenario.
Figure C-17 BGP Process Down Correlation
BGP Link Down Scenarios
Figure C-18 illustrates the lab setup for the BGP Link Down scenarios described in this topic.
Figure C-18 Lab Setup for BGP Link Down Scenarios
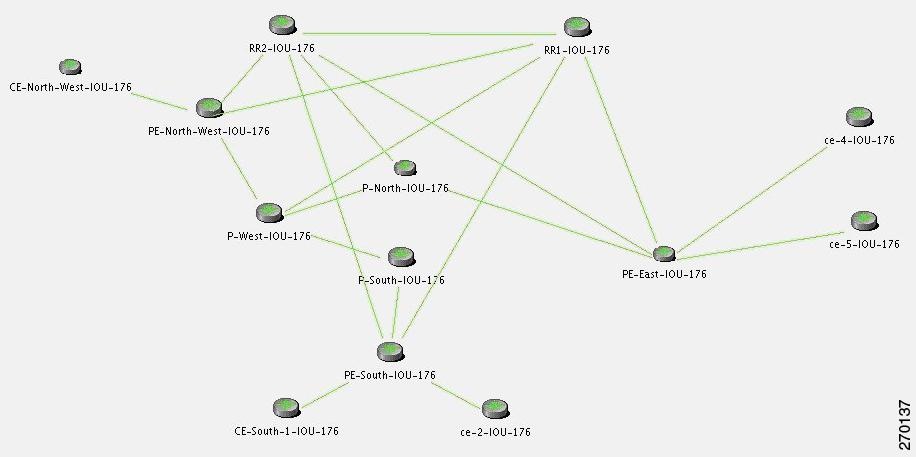
Figure C-19 illustrates the lab setup for the scenarios with only the BGP links displayed.
Figure C-19 Lab Setup for Scenarios with Only the BGP Links Displayed
The VNE models the BGP connection between routers and actively monitors its state. If connectivity is lost and a link between the devices exists in the VNE, a BGP Link Down event is created. A BGP Link Down event is created only if both sides of the link are managed.
A BGP link might be disconnected in the following scenarios:
- The BGP process on a certain device goes down, causing all the BGP links that were connected to that device to disconnect.
- A physical link (path) is disconnected, causing one side of the logical BGP link to become unreachable.
- A device becomes unreachable, due to reload or shutdown. This causes all the links to the device to be lost, including the BGP links.
Description of Fault Scenario in the Network
Due to a physical link down, the BGP connection between PE-North-West and RR2 is lost.
- Port that is connected to the P-North goes down.
- Port that is connected to the RR2 goes down.
- BGP link between RR2 and PE-North-West is disconnected.
Note![]() Syslogs and traps corresponding to network faults are also reported. Additional related faults might also be reported, but are not described in this discussion.
Syslogs and traps corresponding to network faults are also reported. Additional related faults might also be reported, but are not described in this discussion.
Figure C-20 reflects the BGP Link Down due to physical link down scenario. The relevant devices are RR2, P-north, P-West, and PE-North-West.
Figure C-20 BGP Link Down Due to Physical Link Down
Prime Network Failure Processing
The following service alarms are generated by the system:
–![]() After polling, changes are found in the BGP neighbor list in the device.
After polling, changes are found in the BGP neighbor list in the device.
–![]() Syslogs suggest that something has changed in the device’s BGP neighbors or process.
Syslogs suggest that something has changed in the device’s BGP neighbors or process.
This alarm causes an acceleration of the polling for the BGP neighbor data on the device.
1.![]() Prime Network waits two minutes. For more information, see How Prime Network Correlates Incoming Events.
Prime Network waits two minutes. For more information, see How Prime Network Correlates Incoming Events.
2.![]() After two minutes, the [BGP Link Down, RR2 < > PE-North-West] event triggers the RR2 VNE to initiate two IP-based flows:
After two minutes, the [BGP Link Down, RR2 < > PE-North-West] event triggers the RR2 VNE to initiate two IP-based flows:
–![]() One from its routing entity to the destination IP address of its lost BGP neighbor, PE-North-West.
One from its routing entity to the destination IP address of its lost BGP neighbor, PE-North-West.
–![]() One from the destination IP address of its lost BGP neighbor back to the RR2.
One from the destination IP address of its lost BGP neighbor back to the RR2.
Flow Path: RR > P-North > PE-North-West
Flow Path: RR > PE-North-West > P-North > RR2
For the event [BGP Link Down, RR2 < > PE-North-West]:
- Collected Events: [Link Down, P-North < > RR2] and [BGP Link Down, RR2 < > PE-North-West].
- Root Cause: Correlates to [Link Down, P-North < > RR2].
Figure C-21 displays the events identified by the system in this scenario.
Figure C-21 BGP Link Down Correlation to the Root Cause of Physical Link Down
A BGP Link Up event arrives when the root cause event is fixed so that the network is repaired. This clearing event is created after a clearing syslog arrives or after the next polling result reestablishes the BGP connection.
Figure C-22 displays the up event that clears all tickets identified by the system.
Figure C-22 BGP Link Up Clears All the Tickets
In a managed network, the following events might be identified in addition to the BGP Link Down event:
Figure C-23 displays the scenario where a BGP Process Down event causes BGP Link Down events.
Figure C-23 BGP Process Down Causes BGP Link Down Events
For the event [BGP Link Down, RR2 < > PE-North-West]:
- Additional Collected Events: [BGP Process Down, RR2].
- Root cause: Correlates to the event [BGP Process Down, RR2].
Figure C-24 displays the events identified by the system in this scenario.
Figure C-24 BGP Process Down Correlation
For the event [BGP Link Down, RR2 < > PE-North-West]:
- Additional Collected Events: [Device Unreachable, RR2].
- Root cause: Correlates to [Device Unreachable, RR2].
In an unmanaged network core (as illustrated in Figure C-25), the following events might be identified in addition to the BGP Link Down event:
Figure C-25 Lab Setup with Unmanaged Network Core
Note![]() The BGP Process Down event occurs on the managed PE-South.
The BGP Process Down event occurs on the managed PE-South.
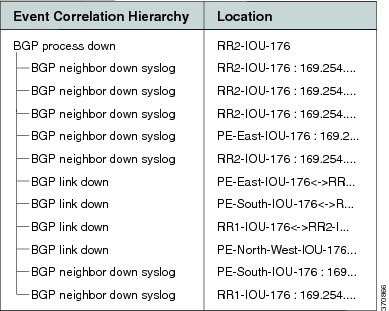
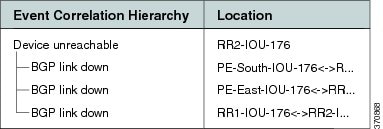
In Figure C-26, the BGP Process Down event on PE-South causes BGP Link Dow n e vents. The relevant devices are PE-South, RR1, and RR2.
Figure C-26 BGP Process Down on PE-South Causes BGP Link Down Events
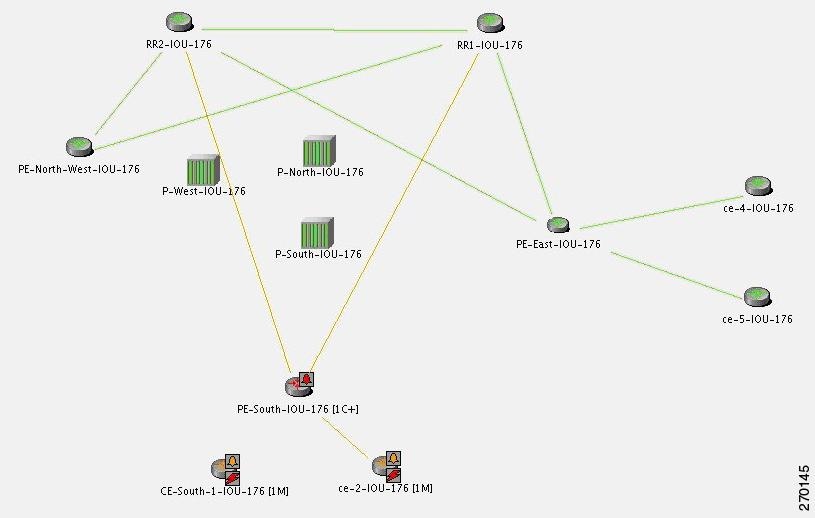
For the event [BGP Link Down, PE-South < > RR2]:
- Additional Collected Events: [BGP Process Down, PE-South] and
[BGP Link Down, PE-South < > RR1]. - Root cause: Correlates to [BGP Process Down, PE-South].
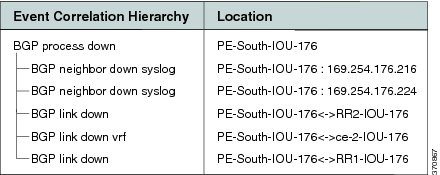
Figure C-27 displays the events identified by the system in this scenario.
Figure C-27 BGP Process Down Correlation
For the Device Unreachable event, one or more PEs report on BGP connectivity loss to a neighbor that is unreachable.
In Figure C-28, the Device Unreachable on an unmanaged core causes multiple BGP Link Down events. The relevant devices are RR2 (Device Unreachable), RR1, PE-East, and PE-South.
Figure C-28 Device Unreachable on Unmanaged Core Causes Multiple BGP Link Down Events
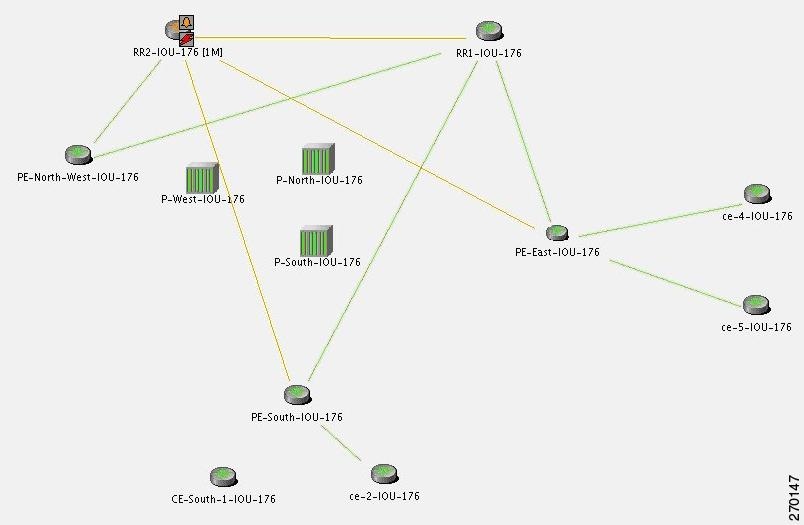
For the event [BGP Link Down, RR2 < > PE-South]:
- Additional Collected Events: [Device Unreachable, RR2] and [BGP Link Down, RR2 < > RR1].
- Root cause: Correlates to [Device Unreachable, RR2].
Figure C-29 displays the events identified by the system in this scenario.
Figure C-29 Device Unreachable on Unmanaged Core Correlation
For the event [Device Unreachable, RR2] (see Figure C-30:
- Additional Collected Events: [BGP Link Down, RR2 < > PE-South].
- Root cause: Correlates to [BGP Link Down, RR2 < > PE-South].
Figure C-30 Device Unreachable on CE
EFP Down Correlation Scenarios
An Ethernet Flow Point (EFP) is a forwarding decision point in the PE switch or router that gives network designers the flexibility to make many Layer 2 flow decisions at the interface level. Many EFPs can be configured on a single physical port. These EFPs can be configured on any Layer 2 traffic port (usually on the UNI port). Each EFP manipulates the frames that enter it in a different manner and makes different forwarding decisions.
EFP Down Correlation Example 1
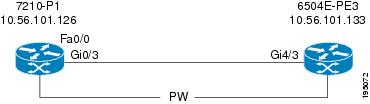
Figure C-31 provides an example of devices with EFP provisioning.
Figure C-31 EFP Down Example 1
In this example, service instances 900 and 901 are configured on port Gi4/3.
The physical link (Gi0/3 < > Gi4/3) is shut down. The expected alarm hierarchy:
EFP Down Correlation Example 2
Figure C-32 provides an example of devices with EFPs and a pseudowire provisioned.
Figure C-32 EFP Down Example 2
Service instances 900 and 901 are configured on port Gi4/3, and a local pseudowire is configured between Gi4/3 900 and Gi4/3 901 (local switching).
Service instance 900 is shut down. The expected alarm hierarchy:
EFP Down Correlation Example 3
Example 3 also uses Figure C-32. Service instance 900 is configured on port Gi4/3 and connects to a pseudowire through a bridge domain.
Service instance 900 is shut down. The expected alarm hierarchy:
EFP Down Correlation Example 4
Example 4 also uses Figure C-32. Service instance 900 is configured on port Gi4/3 and connects to a pseudowire through a bridge domain.
Generate traffic to switch the service instance status to error disabled. The expected alarm hierarchy:
HSRP Scenarios
These topics describe scenarios that can generate HSRP alarms:
HSRP Alarms
When an active Hot Standby Router Protocol (HSRP) group’s status changes, a service alarm is generated and a syslog is sent.
Note![]() HSRP group information can be viewed in the inventory window of Prime Network NetworkVision.
HSRP group information can be viewed in the inventory window of Prime Network NetworkVision.
HSRP Example
In Figure C-33, the link between Router 2 and Switch 2 is shut down, causing the HSRP standby group on Router 3 to become active, and a Link Down service alarm to be generated. The primary HSRP group on Router 2 is no longer active. A service alarm is generated and correlated to the Link Down alarm. Router 2 also sends a syslog which is correlated to the Link Down alarm.
The secondary HSRP group configured on Router 3 now changes from standby to active. This network event triggers an IP-based active flow with the destination being the virtual IP address configured in the HSRP group. When the flow reaches its destination, a service alarm is generated and correlated to the Link Down alarm. Router 3 also sends a syslog that is correlated to the Link Down alarm.
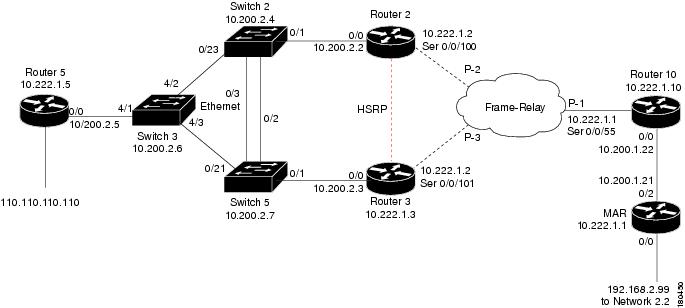
In this case, the system provides the following report:
–![]() [Primary HSRP Interface is Not Active, Router 2]
[Primary HSRP Interface is Not Active, Router 2]
%HSRP-6-STATECHANGE: FastEthernet0/0 Grp 1 state Active -> Speak (source: Router 2)
–![]() [Secondary HSRP Interface is Active, Router 3]
[Secondary HSRP Interface is Active, Router 3]
%STANDBY-6-STATECHANGE: Ethernet0/0 Group 1 state Standby -> Active (source: Router 3)
IP Interface Failure Scenarios
These topics describe scenarios that can generate IP interface failures:
Interface Status Down Alarm
Alarms related to subinterfaces (for example, a Line Down trap or syslog) are reported on IP interfaces configured above the relevant subinterface. This means that in the system, subinterfaces are represented by the IP interfaces configured above them. All events sourcing from subinterfaces without a configured IP interface are reported on the underlying Layer 1.
An Interface Status Down alarm is generated when the status of an IP interface (whether over an interface or a subinterface) changes from up to down or any other nonoperational state (see Table C-2 ). All events sourced from the subinterfaces correlate to this alarm. In addition, an All IP Interfaces Status Down alarm is generated when all the IP interfaces above a physical port change state to down.
|
|
|
|
|
|
|
|---|---|---|---|---|---|
Sent when an IP interface changes operational status to down/up |
The alarm’s description includes the full name of the IP interface, for example Serial0.2 (including the identifier for the subinterface if it is a subinterface), and the alarm source points to the IP interface (and not to Layer 1).
All syslogs and traps indicating changes in subinterfaces (above which an IP address is configured) correlate to the Interface Status Down alarm. The source of these events is the IP interface. Syslogs and traps that indicate problems in Layer 1 (that do not have a subinterface qualifier in their description) are sourced to Layer 1.
Note![]() If a syslog or trap is received from a subinterface that does not have an IP interface configured above it, the source of the created alarm is the underlying Layer 1.
If a syslog or trap is received from a subinterface that does not have an IP interface configured above it, the source of the created alarm is the underlying Layer 1.
For events that occur on subinterfaces:
- When sending the information northbound, the system uses the full subinterface name in the interface name in the source field, as described in the ifDesc/ifName OID (for example, Serial0/0.1 and not Serial0/0 DLCI 50).
- The source of the alarm is the IP interface configured above the subinterface.
- If IP is not configured on the interface, the source is the underlying Layer 1.
If the main interface goes down, all related subinterface traps and syslogs are correlated as child tickets to the main interface parent ticket.
Correlation of Syslogs and Traps
Upon receipt of a trap or syslog for the subinterface level, Cisco ANA immediately polls the status of the relevant IP interface and creates a polled parent event (such as Interface Status Down). The trap or syslog is correlated to this alarm.
In a multipoint setup when only some circuits under an IP interface go down do not cause the state of the IP interface to change to down, Cisco ANA does not create an Interface Status Down alarm. All circuit down syslogs correlate by flow to the possible root cause, such as Device Unreachable on a CE device.
All IP Interfaces Down Alarm
- When all IP interfaces configured above a physical interface change their state to down, the All IP Interfaces Down alarm is sent.
- When at least one of the IP interfaces changes its state to up, a clearing (Active IP Interface Found) alarm is sent.
- The Interface Status Down alarm for each of the failed IP interfaces is correlated to the All IP Interfaces Down alarm.
Note![]() If an All IP Interfaces Down alarm is cleared by the Active IP Interfaces Found alarm, but some correlated Interface Status Down alarms still exist for some IP interfaces, the severity of the parent ticket is the highest severity among all the correlated alarms. For example, if an Interface Status Down alarm is uncleared, the severity of the ticket remains major, despite the Active IP Interface Found alarm having a cleared severity.
If an All IP Interfaces Down alarm is cleared by the Active IP Interfaces Found alarm, but some correlated Interface Status Down alarms still exist for some IP interfaces, the severity of the parent ticket is the highest severity among all the correlated alarms. For example, if an Interface Status Down alarm is uncleared, the severity of the ticket remains major, despite the Active IP Interface Found alarm having a cleared severity.
For more information, see Table C-3 .
|
|
|
|
|
|
|
|---|---|---|---|---|---|
Sent when all IP interfaces configured above a physical port change their operational status to down. |
The All IP Interfaces Down alarm is sourced to the Layer 1 component. All alarms from the other side (such as Device Unreachable) correlate to the All IP Interfaces Down alarm.
IP Interface Failure Examples
Note![]() In the following examples, it is assumed that the problems that result in the unmanaged cloud, or the problems that occurred on the other side of the cloud (such as an unreachable CE device from a PE device) cause the relevant IP interfaces’ state to change to down. This, in turn, causes the Interface Status Down alarm to be sent.
In the following examples, it is assumed that the problems that result in the unmanaged cloud, or the problems that occurred on the other side of the cloud (such as an unreachable CE device from a PE device) cause the relevant IP interfaces’ state to change to down. This, in turn, causes the Interface Status Down alarm to be sent.
If this is not the case, as in some Ethernet networks, and there is no change to the state of the IP interface, all the events on the subinterfaces that are capable of correlation flow will try to correlate to other possible root causes, including Cloud Problem.
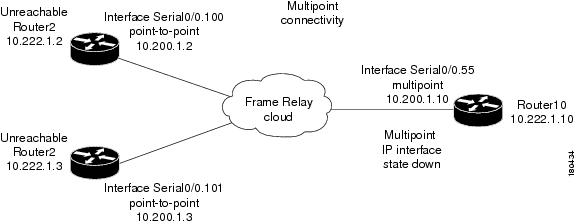
Interface Example 1
Figure C-34 represents an environment with multipoint connectivity between a PE and number of CEs through an unmanaged Frame Relay network. All CEs (Router2 and Router3) have logical connectivity to the PE through a multipoint subinterface on the PE (Router10). The keepalive option is enabled for all circuits. A link is disconnected inside the unmanaged network, causing all CEs to become unreachable.
Figure C-34 Interface Example 1
Interface Example 2
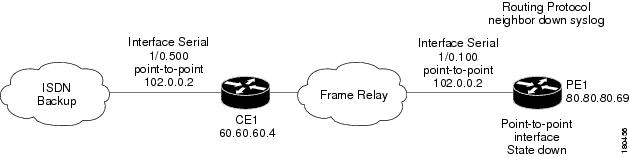
Figure C-35 represents an environment with point-to-point connectivity between a PE and a CE through an unmanaged Frame Relay network. CE1 became unreachable, and the status of the IP interface on the other side (on PE1) changed to down. The keepalive option is enabled. The interface is shut down between the unmanaged network and CE1.
Figure C-35 Interface Example 2
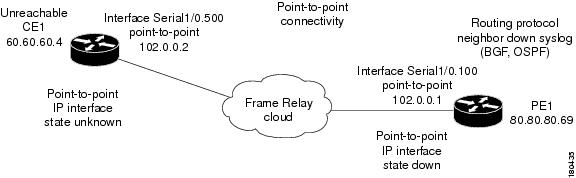
The following failures are identified in the network:
- A Device Unreachable alarm is generated on the CE.
- An Interface Status Down alarm is generated on the PE.
The following correlation information is provided:
–![]() The Interface Status Down alarm is correlated to the Device Unreachable alarm.
The Interface Status Down alarm is correlated to the Device Unreachable alarm.
–![]() The syslogs and traps for the related subinterfaces are correlated to the Interface Status Down alarm.
The syslogs and traps for the related subinterfaces are correlated to the Interface Status Down alarm.
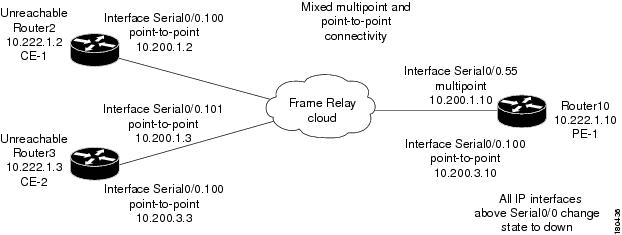
Interface Example 3
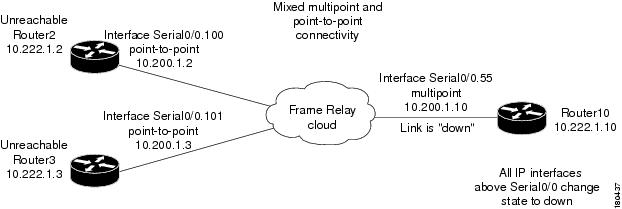
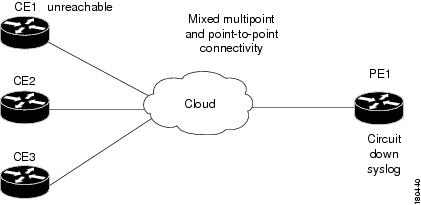
Figure C-36 represents an environment in which the failure of multiple IP interfaces occurs above the same physical port (mixed point-to-point and multipoint Frame Relay connectivity). CE1 (Router2) has a point-to-point connection to PE1 (Router10). CE1 and CE2 (Router3) have multipoint connections to PE1. The IP interfaces on PE1 that are connected to CE1 and CE2 are all configured above Serial0/0. The keepalive option is enabled. A link is disconnected inside the unmanaged network, causing all CEs to become unreachable.
Figure C-36 Interface Example 3
The following failures are identified in the network:
- All the CEs become unreachable.
- An Interface Status Down alarm is generated for each IP interface above Serial0/0 that has failed.
The following correlation information is provided:
–![]() The Interface Status Down alarms are correlated to the All IP Interfaces Down alarm.
The Interface Status Down alarms are correlated to the All IP Interfaces Down alarm.
–![]() The Device Unreachable alarms are correlated to the All IP Interfaces Down alarm.
The Device Unreachable alarms are correlated to the All IP Interfaces Down alarm.
–![]() The syslogs and traps for the related subinterfaces are correlated to the All IP Interfaces Down alarm.
The syslogs and traps for the related subinterfaces are correlated to the All IP Interfaces Down alarm.
Interface Example 4
Figure C-37 represents an environment in which the failure of multiple IP interfaces occurs above the same physical port (mixed point-to-point and multipoint Frame Relay connectivity). CE1 (Router2) has a point-to-point connection to PE1 (Router10). CE1 and CE2 (Router3) have multipoint connections to PE1. The IP interfaces on PE1 that are connected to CE1 and CE2 are all configured above Serial0/0. The keepalive option is enabled.
A link is disconnected inside the unmanaged network, causing all CEs to become unreachable. When a Link Down occurs, whether or not it involves a cloud, the link failure is considered to be the most probable root cause for any other failure. In this example, a link is disconnected between the unmanaged network and the PE.
Figure C-37 Interface Example 4
Interface Example 5
Figure C-38 represents an environment in which a PE1 device has multipoint connectivity, one of the circuits under the IP interface has gone down, and the CE1 device has become unreachable. The status of the IP interface has not changed and other circuits are still operational.
Figure C-38 General Interface Example
ATM Failure Examples
Examples involving ATM technology have the same result as the examples in IP Interface Failure Examples, assuming that a failure in an unmanaged network causes the status of the IP interface to change to down (ILMI is enabled).
Ethernet, Fast Ethernet, and Gigabit Ethernet Examples
This section includes the following examples:
- A CE becomes unreachable due to a failure in the unmanaged network (see Interface Example 6).
- A link down on a PE results in a CE becoming unreachable (see Interface Example 7).
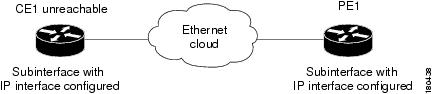
Interface Example 6
Figure C-39 shows an unreachable CE due to a failure in the unmanaged network.
Figure C-39 Interface Example 6
Interface Example 7
Figure C-40 shows a Link Down alarm on a PE that results in a CE becoming unreachable.
Figure C-40 Interface Example 7
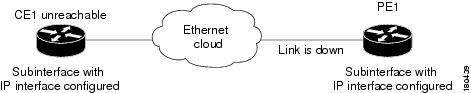
The following failures are identified in the network:
- A Link Down alarm is generated on the PE.
- An Interface Status Down alarm is generated on the PE.
- A Device Unreachable alarm is generated on the CE.
The following correlation information is provided:
–![]() The Interface Status Down alarm on the PE is correlated to the Link Down alarm.
The Interface Status Down alarm on the PE is correlated to the Link Down alarm.
–![]() The Device Unreachable alarm on the CE is correlated to the Link Down alarm on the PE.
The Device Unreachable alarm on the CE is correlated to the Link Down alarm on the PE.
–![]() The traps and syslogs for the subinterface are correlated to the Link Down alarm on the PE.
The traps and syslogs for the subinterface are correlated to the Link Down alarm on the PE.
GRE Tunnel Down/Up
Generic routing encapsulation (GRE) is a tunneling protocol that encapsulates a variety of network layer packets inside IP tunneling packets, creating a virtual point-to-point link to devices at remote points over an IP network. It is used on the Internet to secure VPNs. GRE encapsulates the entire original packet with a standard IP header and GRE header before the IPsec process. GRE can carry multicast and broadcast traffic, making it possible to configure a routing protocol for virtual GRE tunnels. The routing protocol detects loss of connectivity and reroutes packets to the backup GRE tunnel, thus providing high resiliency.
GRE is stateless, meaning that the tunnel endpoints do not monitor the state or availability of other tunnel endpoints. This feature helps service providers support IP tunnels for clients who do not know the service provider’s internal tunneling architecture. It gives clients the flexibility of reconfiguring their IP architectures without worrying about connectivity.
GRE Tunnel Down/Up Alarm
When a GRE tunnel link exists, if the status of the IP interface of the GRE tunnel edge changes to down, a GRE Tunnel Down alarm is created. The IP Interface Status Down alarms of both sides of the link correlate to the GRE Tunnel Down alarm. The GRE Tunnel Down alarm initiates an IP-based flow toward the GRE destination. If an alarm is found during the flow, it correlates to it.
Note![]() The GRE Tunnel Down alarm is supported only on GRE tunnels that are configured with keepalive. If keepalive is configured on the GRE tunnel edge and a failure occurs in the GRE tunnel link, both IP interfaces of the GRE tunnel move to the Down state. If keepalive is not configured on the GRE tunnel edge, the GRE Tunnel Down alarm might not be generated because the alarm is generated arbitrarily from one of the tunnel devices when the IP interface changes to the Down state.
The GRE Tunnel Down alarm is supported only on GRE tunnels that are configured with keepalive. If keepalive is configured on the GRE tunnel edge and a failure occurs in the GRE tunnel link, both IP interfaces of the GRE tunnel move to the Down state. If keepalive is not configured on the GRE tunnel edge, the GRE Tunnel Down alarm might not be generated because the alarm is generated arbitrarily from one of the tunnel devices when the IP interface changes to the Down state.
When a failure occurs, the GRE tunnel link is marked orange. When the IP interface comes back up, a fixing alarm is sent, and the link is marked green. The GRE Tunnel Down alarm is cleared by a corresponding GRE Tunnel Up alarm.
GRE Tunnel Down Correlation Example 1
Figure C-41 illustrates an example of a GRE Tunnel Down correlation for a single GRE tunnel.
- Router 1 (R1) is connected to Router 3 (R3) through physical link L1.
- Router 3 is connected to Router 2 through physical link L2.
- Router 1 is connected to Router 2 through a GRE tunnel.
Figure C-41 GRE Tunnel Down Example 1 (Single GRE Tunnel)
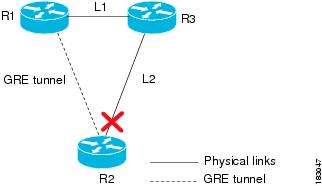
When the link down occurs on L2, a Link Down alarm appears. A GRE Tunnel Down alarm is issued as the IP interfaces of the tunnel edge devices go down. The Interface Status Down alarms correlate to the GRE Tunnel Down alarm. The GRE Tunnel Down alarm correlates to the Link Down alarm.
The system provides the following report:
[GRE Tunnel Down, Router1:tunnel < > Router 2:tunnel]
GRE Tunnel Down Correlation Example 2
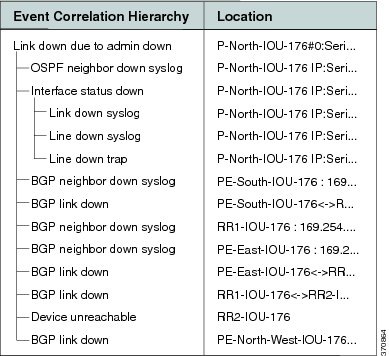
This example provides a real-world scenario in which multiple GRE tunnels cross through a physical link. When this link is shut down by an administrator, many alarms are generated. All of these alarms are correlated to the root cause ticket, Link Down Due to Admin Down ticket, as illustrated in Figure C-42.
Figure C-42 GRE Tunnel Down Example 2 (Multiple GRE Tunnels)
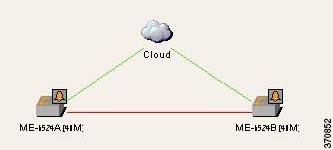
Figure C-43 shows the Correlation tab of the Ticket Properties dialog box that displays all the alarms that are correlated to the ticket, including the correlation for each GRE tunnel and its interface status.
Figure C-43 Alarm Correlation to GRE Tunnel Down Ticket
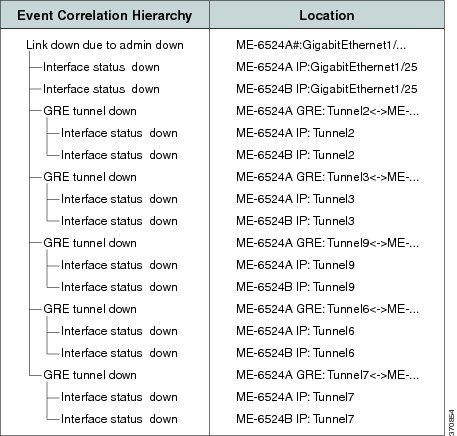
As illustrated, the system provides the following report:
[GRE Tunnel Down, ME-6524AGRE:Tunnel2 < > ME-6524B GRE:Tunnel2]
–![]() [Interface Status Down, ME-6524A IP:Tunnel2]
[Interface Status Down, ME-6524A IP:Tunnel2]
–![]() [Interface Status Down, ME-6524B IP:Tunnel2]
[Interface Status Down, ME-6524B IP:Tunnel2]
[GRE Tunnel Down, ME-6524AGRE:Tunnel3 < > ME-6524B GRE:Tunnel3]
–![]() [Interface Status Down, ME-6524A IP:Tunnel3]
[Interface Status Down, ME-6524A IP:Tunnel3]
Q-in-Q Subinterface Down Correlation Scenarios
Q-in-Q technology refers to the nesting of a VLAN header in an Ethernet frame in an already existing VLAN header. Both VLAN headers must be of the type 802.1Q. When one VLAN header is nested within another VLAN header, they are often referred to as stacked VLANs.
A subinterface is a logical division of traffic on an interface, such as multiple subnets across one physical interface. A subinterface name is represented as an extension to an interface name using dot notation, such as Interface Gigabit Ethernet 0/1/2/3.10. In this example, the main interface name is Gigabit Ethernet 0/1/2/3 and the subinterface is 10.
Q-in-Q Subinterface Down Correlation Example 1
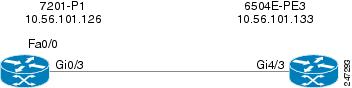
Figure C-44 shows an example of devices connected via a stacked VLAN.
Figure C-44 Q-in-Q Subinterface Down Example 1
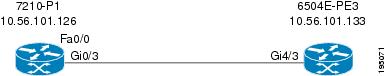
- A physical link (Gi0/3 < > Gi4/3) is established between 7201-P1 and 6504E-PE3.
- On device 7201-P1 on Gi0/3, a subinterface (Gi0/3.100) is configured for IEEE 802.1Q encapsulation.
- A stacked VLAN is created across the link between 7201-P1 and 6504-PE3.
When the physical link between the interfaces is shut down, the following are generated:
Q-in-Q Subinterface Down Correlation Example 2
In this example, using the devices in Figure C-44:
When the Gi0/3.100 subinterface is shut down by the administrator, the following are generated:
- Subinterface Down alarm of the type Subinterface Admin Down.
- Subinterface Down syslogs.
- Local Switching Down.
- Related faults.
The Subinterface Admin Down event does not search for the root cause through the correlation mechanism.
Q-in-Q Subinterface Down Correlation Example 3
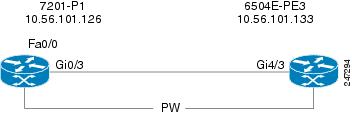
Figure C-45 shows an example of devices connected via a pseudowire tunnel configured on subinterfaces.
Figure C-45 Q-in-Q Subinterface Down Example 3
- On device 7201-P1 on Gi0/3, a subinterface (Gi0/3.100) is configured for IEEE 802.1Q encapsulation.
- The subinterface (Gi0/3.100) is connected to a pseudowire tunnel.
When the Gi0/3.100 subinterface is shut down by the administrator, the following are generated:
- Subinterface Down alarm of the type Subinterface Admin Down.
- Subinterface Down syslogs.
- Pseudowire Tunnel Down.
- Related faults.
The Subinterface Admin Down event does not search for the root cause through the correlation mechanism.
VSI Down Correlation Scenarios
Virtual Private LAN Service (VPLS) is a type of Layer 2 VPN that provides Ethernet-based multipoint-to-multipoint communication over MPLS networks. It allows geographically dispersed sites to share an Ethernet broadcast domain by connecting sites through pseudowires. Emulating the function of a LAN switch or bridge, VPLS connects the different customer LAN segments to create a single-bridged Ethernet LAN. Virtual switching instances (VSIs, also known as virtual forwarding instances, or VFIs), are the main component in the PE router that constructs the logical bridge. All VSIs that build a provider logical bridge are connected with MPLS pseudowires.
VSI Down Correlation Example 1
Figure C-46 shows an example of devices with VSI connected through pseudowires.
Figure C-46 VSI Down Example 1
The VSI is shut down. The expected alarm hierarchy is:
–![]() Pseudowire tunnel 1 down > Pseudowire tunnel 1 syslogs
Pseudowire tunnel 1 down > Pseudowire tunnel 1 syslogs
–![]() Pseudowire tunnel 2 down > Pseudowire tunnel 2 syslogs
Pseudowire tunnel 2 down > Pseudowire tunnel 2 syslogs
Note![]() For more information about the VSI Down alarm.
For more information about the VSI Down alarm.
VSI Down Correlation Example 2
In this example, using the devices in Figure C-46, the VSI attachment circuit (the interface VLAN) is shut down. The expected alarm hierarchy is the same as in Example 1:
–![]() Pseudowire tunnel 1 down > Pseudowire tunnel 1 syslogs
Pseudowire tunnel 1 down > Pseudowire tunnel 1 syslogs
–![]() Pseudowire tunnel 2 down > Pseudowire tunnel 2 syslogs
Pseudowire tunnel 2 down > Pseudowire tunnel 2 syslogs
However, because Prime Network does not model the attachment circuit state, the VNE cannot issue an alarm when the interface VLAN state changes to Down. Therefore, the VSI Down alarm is the highest root cause.
VSI Down Correlation Example 3
In this example, using the devices in Figure C-46:
- A VSI is configured on PE4.
- The VSI uses the pseudowire tunnels 2 and 3.
- The VSI is connected to bridge 100; the binding to the VSI is done on interface VLAN 100.
- Two physical interfaces, Gi1/1 and Gi1/2, are associated to bridge 100.
- Interfaces Gi1/1 and Gi1/2 are shut down.
Note![]() The attachment circuit connected to bridge 100 has two physical interfaces. As long as one interface is up, bridge 100 will be up. Bridge 100 will go down when the last interface switches from up to down.
The attachment circuit connected to bridge 100 has two physical interfaces. As long as one interface is up, bridge 100 will be up. Bridge 100 will go down when the last interface switches from up to down.
Root Cause Across Frame Relay, ATM, or Ethernet Clouds
When a Layer 3 or Layer 2 event (for example, reachability problem, neighbor change, Frame Relay DLCI down, ATM PVC down) occurs, it triggers a flow along the physical and logical path modeled on the VNEs. This is done in order to correlate to the actual root cause of this fault. If the flow passes over a cloud along the path flow, it marks it as a potential root cause for the fault. If there is no other root cause found on the managed devices, then the cloud b ecomes the root cause. A ticket is then issued and the original event correlates to it.
Cloud Problem Alarm and Correlation Example
For some events, when there is no root cause found, a special Cloud Problem alarm is created. These events are then correlated to the alarm. If several events trigger the creation of a Cloud Problem alarm, one alarm instance is created and all events correlate to it.
In the example in Figure C-47, two devices that have OSPF configured are connected through a cloud. A malfunction occurs inside the unmanaged network that causes the OPSF Neighbor Down alarm to be generated. In this case, the OSPF Neighbor Down alarm is correlated to the Cloud Problem alarm.
Figure C-47 Cloud Correlation Example
On the PE1 device, the OSPF Neighbor Down alarm was received, and no root cause was detected in any of the managed devices. A disconnected link inside the unmanaged network caused the OSPF Neighbor Down alarm. The Cloud Problem service alarm is generated, and the OSPF Neighbor Down alarm on the PE1 is correlated to the Cloud Problem alarm.
MPLS Fault Scenarios
The following fault scenarios trigger automatic impact analysis calculation:
- Link Down Scenario
- Link Overutilized/Data Loss Scenario
- BGP Neighbor Loss Scenario
- Broken LSP Discovered Scenario
- MPLS TE Tunnel Down Scenario
- Pseudowire MPLS Tunnel Down Scenario
The following criteria are used in the tables that are described in the sections that follow:
- Impact Calculation—Describes the way in which the affected parties are calculated by system flows.
- Reported Affected Severity—Describes the kind of severity generated by the alarm.
Note![]() Proactive impact analysis is performed only for links.
Proactive impact analysis is performed only for links.
Link Down Scenario
Table C-4 lists the impact calculations and reported affected severities for a link down fault scenario.
Link Overutilized/Data Loss Scenario
Table C-5 lists the impacted calculations and reported affected severities for a link overutilized/data loss fault scenario.
|
|
|
Initiates an affected flow to determine the affected parties using the LSPs traversing the link. |
|
BGP Neighbor Loss Scenario
Table 3-6 shows the impacted calculations and reported affected severities for a BGP neighbor loss fault scenario.
Note![]() The affected only relate to Layer 3 VPN services.
The affected only relate to Layer 3 VPN services.
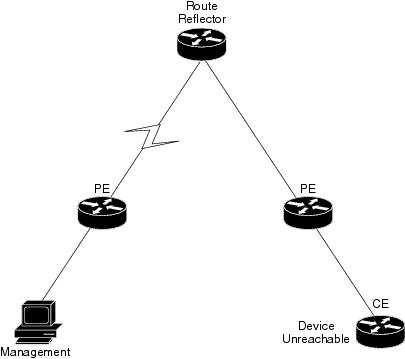
BGP rules require all routers within an autonomous system to be fully meshed. For large networks, this requirement represents a severe scaling problem. Route reflectors enable a BGP entity to establish a single BGP connection with a peer, where through that single peer, routing information is learned from other peers. As a result, the number of BGP sessions and connections is greatly reduced.
Decreasing the number of BGP connections and using route reflectors further separates the data and control paths. For example, data packets going from A to B do not go through the route reflector, while the routing updates between A and B do.
Every BGP router is uniquely identified by a router ID. A route reflector is not a configuration of a specific router. A router may act as a route reflector if it has a BGP neighbor configured as a BGP client. A router may act as both a route reflector to some of its BGP neighbors (those that are configured as BGP clients) and a nonclient BGP neighbor to those BGP neighbors that are configured as nonclient BGP neighbors.
A route reflector uses the following logic when distributing routes to its BGP neighbors:
- A router advertises to its client peers all routes learned from other client and nonclient peers.
- A router advertises to its nonclient peers only routes received from client peers.
Router ID distribution follows the same logic described previously.
Prime Network modeling provides a list of one or more router IDs for each interface. This reflects the network behavior of receiving BGP updates from a BGP router (possessing that ID) through that interface. The VNE also maintains the nature of the relationships (client and nonclient) among the various VNEs representing the BGP routers. Figure C-48 shows an example.
Figure C-48 Route Reflector Example
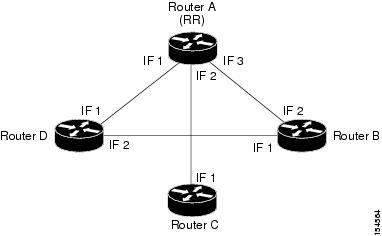
In the example, the following configuration is applied:
- Router A (router ID A) has clients B, C, and D configured. Therefore it serves as the route reflector for these BGP routers.
- Routers B, C, and D all have Router A as a BGP nonclient neighbor.
- Router D and Router B also have each other configured as BGP nonclient neighbors.
In this case, in Prime Network, the following information is maintained by a VNE:
- Router B learns router ID D from interface 1.
- Router B learns router IDs A, C, and D from interface 2.
- Router C learns router IDs A, B, and D from interface 1.
- Router D learns router ID B from interface 2.
- Router D learns router IDs A, B, and C from interface 1.
- Router A learns router ID D from interface 1.
- Router A learns router ID C from interface 2.
- Router A learns router ID B from interface 3.
In the Figure C-48 example, if a BGP connection from Router A to Router B is lost, the following occurs:
- Router A notifies both Routers C and D of the loss of router ID B.
- Router C removes the ID of Router B from its tables and completely loses connectivity to it, resulting in a Real Affected impact analysis.
- Router D loses the ID of Router B learned from interface 1, but it still has the Router B ID that was learned through interface 2. Therefore, no impact analysis is performed.
If a BGP connection is lost from Router B to Router D, the following occurs:
- Router B does not notify Router A of its router ID loss, because Router A is configured in the Router B tables as a nonclient peer.
- Router D does not notify Router A of its router ID loss, because Router A is configured in Router D’s tables as a nonclient peer.
- Router B notes that the ID of Router D is no longer learned through interface 1.
- Router D notes that the ID of Router B is no longer learned through interface 2.
- No impact analysis is performed.
Broken LSP Discovered Scenario
Table 3-7 lists the impacted calculations and reported affected severities for a broken LSP discovered fault scenario.
MPLS TE Tunnel Down Scenario
Table 3-8 lists the impacted calculations and reported affected severities for an MPLS TE tunnel down fault scenario.
|
|
|
Pseudowire MPLS Tunnel Down Scenario
The following table lists the impacted calculations and reported affected severities for a pseudowire MPLS tunnel down fault scenario.
|
|
|
 Feedback