Cisco Prime Collaboration Assurance Guide - Advanced, 11.x
Bias-Free Language
The documentation set for this product strives to use bias-free language. For the purposes of this documentation set, bias-free is defined as language that does not imply discrimination based on age, disability, gender, racial identity, ethnic identity, sexual orientation, socioeconomic status, and intersectionality. Exceptions may be present in the documentation due to language that is hardcoded in the user interfaces of the product software, language used based on RFP documentation, or language that is used by a referenced third-party product. Learn more about how Cisco is using Inclusive Language.
- Updated:
- January 16, 2017
Chapter: Troubleshooting Workflow for Video Endpoints
Troubleshooting Workflow for
Video Endpoints
For Cisco Prime Collaboration Release 11.1 and earlier
For Cisco Prime Collaboration Release 11.6 and later
You must understand the Cisco Prime Collaboration discovery workflow before reviewing this section. For information on the device discovery process, see the Discover Devices section in the Cisco Prime Collaboration Assurance Guide- Advanced, 11.x.
During the troubleshooting workflow, the devices are polled, based on the values defined for the System Status Polling Interval, and Flow Statistics Polling Interval in the Conference Path Threshold Settings page.
During the troubleshooting workflow, the endpoints and conference devices are polled every minute to check the status.
You can view details, such as CPU utilization, memory utilization, interface, and so forth for a network device.
 Note | Conference troubleshooting is not supported, if you have deployed Cisco Prime Collaboration Assurance in MSP mode The troubleshooting workflow impacts the Cisco Prime Collaboration system performance. Add a conference or an endpoint to the watch list only if it is required. |
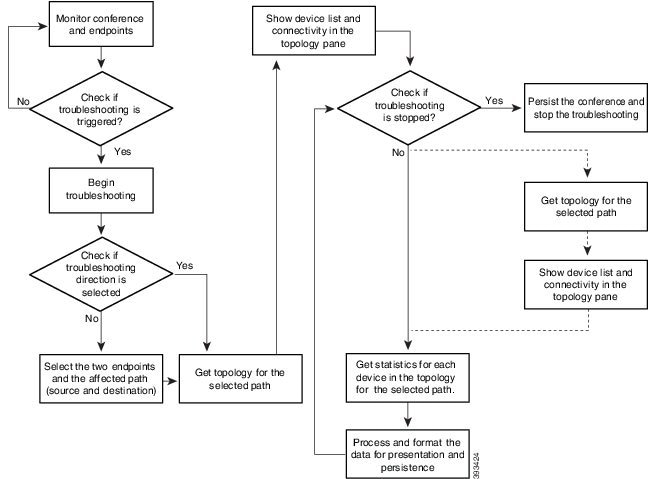
The troubleshooting workflow for a conference is represented below.
For Cisco Prime Collaboration Release 11.1 and earlier

For Cisco Prime Collaboration Release 11.6 and later
- Features of the Troubleshooting Workflow
- Start a Troubleshooting Workflow
- Troubleshoot Data Analysis
- Export Troubleshooting Data
- Cisco Prime Infrastructure Cross-Launch
Features of the Troubleshooting Workflow
The following are the key features of the troubleshooting workflow:
-
It can be started automatically or manually:
-
Automatic troubleshooting is triggered when the conference is added to the watch list.
-
Automatic troubleshooting is triggered when one of the endpoints is in the watch list. You can start a troubleshooting workflow only if the endpoints are in the Managed state.
-
Automatic troubleshooting is triggered if the value for packet loss, jitter, or latency alarm exceeds the defined threshold value. This is applicable only for a point-to-point conference.
-
Automatic troubleshooting is not triggered when the packet loss, jitter, or latency alarm occurs in a multipoint conference.
-
Manual troubleshooting can be started from the Conference Diagnostics page.
See Start a Troubleshooting Workflow for details on how to start a troubleshooting workflow for conferences and endpoints.
-
-
When there is a packet loss, jitter, or latency alarm between the two endpoints, the troubleshooting workflow starts if you have configured for the automatic troubleshooting; when this alarm is cleared, the troubleshooting workflow stops.
-
Troubleshooting is supported between two endpoints in both directions. You can select the direction for troubleshooting between the endpoints, if you are manually starting the troubleshooting workflow.
-
Troubleshooting is supported between a video endpoint and SBC. The troubleshooting direction is from a video endpoint to SBC, and not in the reverse direction.
-
Troubleshooting is supported between an endpoint and Cisco TelePresence Server. The troubleshooting direction is from an endpoint to Cisco TelePresence Server, and not in the reverse direction.
-
Troubleshooting is supported between an endpoint and Cisco MSE. The troubleshooting direction is from an endpoint to Cisco MSE, not in the reverse direction.
- Troubleshooting is supported between an endpoint and Cisco VCS. The troubleshooting direction is from an endpoint to Cisco VCS and not in the reverse direction.
-
If the endpoint is in an Unknown state, you can troubleshoot from a known endpoint to this unknown endpoint. For multipoint conferences also, you can troubleshoot in the same manner.
-
The troubleshooting workflow lasts for a maximum of four hours from the time it is started. If the troubleshooting workflow does not end within this time, Cisco Prime Collaboration ends the workflow automatically.
-
You can have a maximum of 50 concurrent troubleshooting workflows at a time.
If this limit is exceeded, an error message is displayed in the troubleshooting log file.
- Features of the Troubleshooting Workflow for Conferences
- Features of the Troubleshooting Workflow for Endpoints
- Support Matrix for Troubleshooting Source and Destination Endpoints
Features of the Troubleshooting Workflow for Conferences
The following are the key behaviors of the troubleshooting workflow, when scheduled conferences are added to the watch list:
-
The automatic troubleshooting workflow starts for all conferences added to the watch list.
-
In a multipoint conference, the troubleshooting starts as soon as the endpoints join the conference.
-
In a multipoint conference, if a troubleshooting is stopped for an endpoint, the troubleshooting workflow continues for the other endpoints in the conference. You need to manually start the troubleshooting for this endpoint.
-
In a multipoint conference, if an endpoint restarts because of a problem, a new troubleshooting workflow is triggered for this endpoint after it rejoins the conference. There is no impact on the other endpoints in the conference.
-
If a conference is removed from the watch list, the associated troubleshooting workflow stops, provided:
-
If a troubleshooting workflow is triggered because of a packet loss, jitter, or latency alarm, the troubleshooting workflow stops when the packet loss, jitter, or latency alarm is cleared, provided:
-
If a troubleshooting workflow is triggered manually, the troubleshooting workflow can only be stopped manually; otherwise, it stops when the conference ends.
-
If a conference is added again to the watch list, a new troubleshooting workflow starts.
Features of the Troubleshooting Workflow for Endpoints
You can start a troubleshooting workflow only if the endpoints are in the Managed state. The following are the key behaviors of the troubleshooting workflow, when an endpoint is added to the watch list:
-
The automatic troubleshooting for an endpoint starts as soon as it joins a conference. You can stop the troubleshooting workflow for a conference that is associated with an endpoint (added to a watch list). You need to manually start the troubleshooting for this conference.
-
During the conference, if an endpoint is removed from the watch list, the troubleshooting stops for that endpoint.
-
If a conference and the associated endpoints are part of the watch list and if an endpoint is removed from the watch list, the troubleshooting workflow continues for the conference until it ends.
-
If a conference and the associated endpoints are part of the watch list and if the conference is removed from the watch list, the troubleshooting workflow continues for the endpoints, until they disconnect from the conference. That is, if the conference and endpoints are part of the watch list, the endpoints are given higher priority.
-
For MRA endpoints, the troubleshooting legs are not displayed. For non-MRA endpoints, the troubleshooting workflow happens from the endpoints to the Cisco VCS with Cisco Collaboration Edge.
Support Matrix for Troubleshooting Source and Destination Endpoints
The following table shows the details of troubleshooting support between source and destination endpoints:
For Cisco Prime Collaboration Release 11.5 and earlier
For Cisco Prime Collaboration Release 11.5 and earlier
For Cisco Prime Collaboration Release 11.6 and later
|
Source |
Destination |
|---|---|
|
Cisco endpoint |
Cisco endpoint, MCU, TPS, virtual TPS, VG, CUBE, VCS, Expressway-Core, Unknown endpoint |
Start a Troubleshooting Workflow
You can start the troubleshooting workflow for a conference from the 360° Conference View in the Conference Diagnostics page.
For Cisco Prime Collaboration Release 11.1 and earlier
Note | To reduce troubleshooting time, it is recommended that the devices in the media path are already discovered and available in Inventory before you start troubleshooting. |
You can start the troubleshooting workflow for an endpoint from the quick view window in the Endpoint Diagnostics page.
For Cisco Prime Collaboration Release 11.1 and earlier
For Cisco Prime Collaboration Release 11.6 and later
Troubleshoot Data Analysis
You can view troubleshooting data for both in progress conferences and completed conferences, if manual or automatic troubleshooting is/was activated for conferences or endpoints.
After the troubleshooting job is completed the following data is displayed:
Troubleshooting
You can view the topology (Layer 2 and Layer 3) for the selected direction between endpoints in the Path View tab.
-
A straight line between the devices indicates that the devices are directly connected to each other.
-
A dotted line between the devices indicates that the devices may not be connected.
The following image shows a troubleshooting conference between endpoints.
For Cisco Prime Collaboration Release 11.1 and earlier
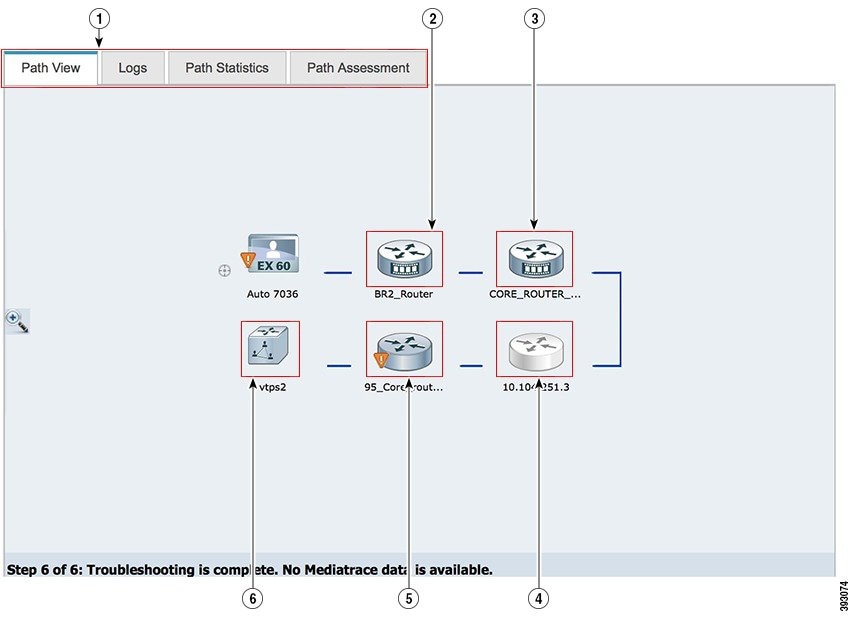
| 1 |
Troubleshooting results tab. Based on the configurations (mediatrace, performance monitor) on the devices, some of the tabs may not be displayed. |
2 |
Devices that contains the Cisco Prime Network Analysis Module (Prime NAM) application are displayed with an additional badge on the device. Inaccessible devices are displayed in gray. |
| 3 |
Mediatrace enabled devices are displayed with an additional badge on the device. |
4 |
Inaccessible devices are displayed in gray |
| 5 | An alarm badge on the endpoint indicates that there is a fault in the endpoint. | 6 |
An information badge on a discovered device indicates that there is an issue with the Memory, CPU utilization, and/or Call Quality Statistics (RTP Packet Loss, RTP Packet Jitter, DSCP) for media flows. The threshold value for the Call Quality Statistics and utilization (memory and CPU) is defined in the Conference Path Threshold Settings page (). |
If the devices are accessible, you can rest your mouse pointer over the device and click the quick view icon, to view the system, interface details.
For Cisco Prime Collaboration Release 11.6 and later
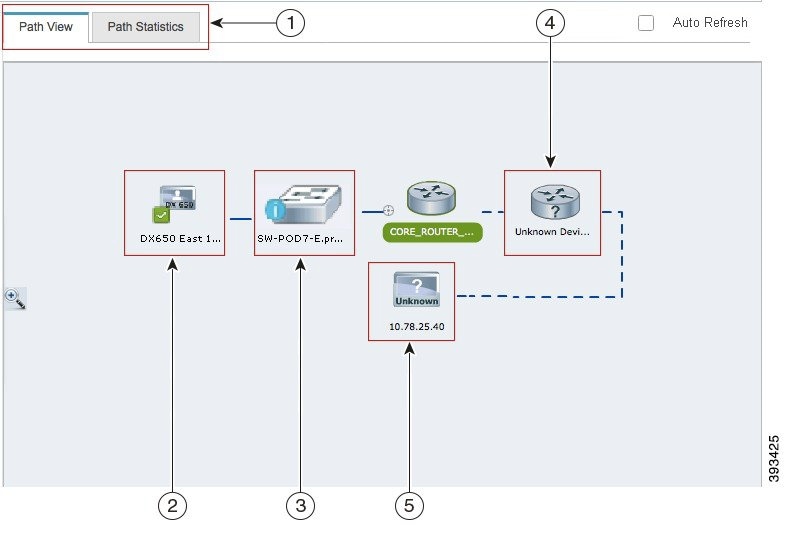
| 1 |
Troubleshooting results tab. |
2 |
The source endpoint from where the troubleshooting is initiated. |
| 3 |
The midpoint (router or switch) that is in the path. A blue badge on the midpoint indicates that the threshold value has exceeded the configured limit for Rx packet loss, jitter, or latency for all devices. The threshold value is defined in the Conference Path Threshold Settings page (). |
4 |
Unknown devices that are not identified by Cisco APIC-EM. The unknown devices are displayed with a question mark (?). |
| 5 |
The destination endpoint. Cisco Prime Collaboration supports troubleshooting even when the destination device or endpoint is in Unknown state. |
||
For Cisco Prime Collaboration Release 11.6 and later
By default, the Conference Troubleshooting page auto refreshes every 30 seconds. To disable the auto refresh functionality, uncheck the Auto Refresh check box at the top right corner of the Conference Troubleshooting page. You can rest your mouse pointer over the device and click the quick view icon, to view the system, interface, and flow details.
The following table lists the system, interface, and flow details that are listed in the quick view.
For Cisco Prime Collaboration Release 11.1 and earlier
For Cisco Prime Collaboration Release 11.6 and later
|
Field |
Description |
|||
|---|---|---|---|---|
|
Hostname |
Hostname configured for the device. |
|||
|
IP Address |
IP address used for managing the device. You can launch to the endpoint or infrastructure device log in page, using this link. |
|||
|
System Status |
Physical Memory Utilization (in%) |
Percentage of the physical memory utilization. |
||
|
CPU Utilization (in%) |
Percentage of the CPU utilization. |
|||
|
Interface Details |
System Status |
Administrative status of the interface as specified in the ifOperStatus object. |
||
|
Input Metrics |
The data displayed are based on the RFC1213 MIB attributes. |
|||
|
Output Metrics |
The data displayed are based on the RFC1213 MIB attributes. |
|||
|
Media Flow Information
|
||||
|
DSCP |
DSCP value configured on the device. |
|||
|
IP Packet Drop Count |
Number of IP packets dropped. |
|||
|
RTP Packet Loss |
Packet loss indicated by the Real-time Transport Protocol (RTP). |
|||
|
RTP Packet Jitter (RFC 3550) |
Jitter indicated by the Real-time Transport Protocol (RTP). |
|||
|
Ingress Interface |
Details on ingress interface. |
|||
|
Egress Interface |
Details on egress interface. |
|||
Path Statistics
The Path Statistics View displays the statistics for each node in the path.
The following graphs are displayed in the Path Statistics View:
- CPU and Memory
- CPU and Packet Loss
- Video IP Bit Rate and Packet Loss
- Video Interarrival Jitter and Packet Loss
- IP DSCP and Packet Loss
CPU and Memory
The graph is displayed for all devices and includes the following information:
-
The vertical axis (y-axis) provides the CPU utilization details of last 5 minutes as a percentage.
-
The horizontal axis (x-axis) provides lists of all network devices that were discovered during the path trace.
-
The spheres in the graph provides the processor memory utilization details as a percentage. The tool tip on the sphere indicates the exact memory utilization value.
-
The size of the sphere varies, based on the processor memory utilization. The smaller the sphere size, the less the processor memory utilization.
Click on the sphere (red icon) to view the system, interface, and flow details.
CPU and Packet Loss
This graph is displayed for all devices and includes the following information:
-
The vertical axis (y-axis) provides the CPU utilization details of last 5 minutes as a percentage.
-
The horizontal axis (x-axis) provides lists of all network devices that were discovered during the path trace.
-
The spheres in the graph provides video packet loss details as a percentage:
-
Orange sphere indicates that the video packet loss is more than 1%. The size of the sphere varies, based on the video packet loss. The smaller the sphere size, the less the video packet loss.
You can click on the sphere to further analyze the packet loss at the interface-level.
-
Blue square box indicates that the perfmon counter statistics are not available from the devices.
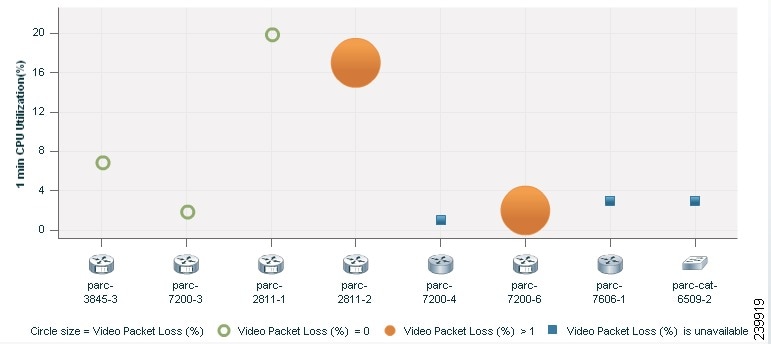
Click on the sphere or square box (red icon) to view the system, interface, and flow details.
Video IP Bit Rate and Packet Loss
This graph is displayed for all devices and includes the following information:
-
The vertical axis (y-axis) provides the video IP bit rate in kilobits per second (kbps).
-
The horizontal axis (x-axis) provides lists of all network devices that were discovered during the path trace.
-
The spheres in the graph provides the video packet loss details as a percentage.
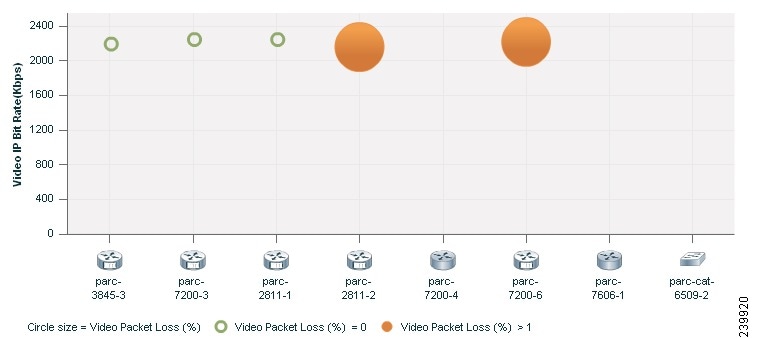
Click on the sphere (red icon) to view the system, interface, and flow details.
Video Interarrival Jitter and Packet Loss
This graph is displayed for all devices and includes the following information:
-
The vertical axis (y-axis) provides the average video interarrival jitter in milliseconds (ms).
-
The horizontal axis (x-axis) provides lists of all network devices that were discovered during the path trace.
-
The spheres in the graph provide the video packet loss details as a percentage.
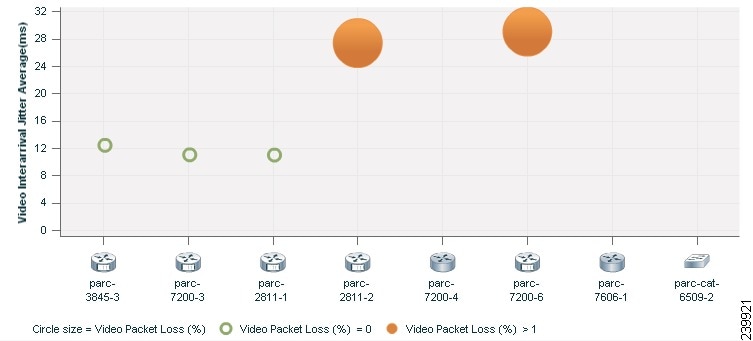
Click on the sphere (red icon) to view the system, interface, and flow details.
IP DSCP and Packet Loss
This graph is displayed for all devices and includes the following information:
-
The vertical axis (y-axis) provides the average IP DSCP (Differentiated Services Code Point). This value is pre-configured on the device.
-
The horizontal axis (x-axis) provides lists of all network devices that were discovered during the path trace.
-
The spheres in the graph provides the video packet loss details as a percentage.
Click on the sphere (red icon) to view the system, interface, and flow details.
Export Troubleshooting Data
You can export the data only after the conference ends. After the troubleshooting job is completed, the troubleshooting job status is displayed in the Conference Monitoring page.
The Troubleshooting Report in the HTML file format appears in a new browser window.
Understand the Export Troubleshooting Report
The export troubleshooting report contains the following details:
Cisco Prime Infrastructure Cross-Launch
Cisco Prime Collaboration allows you to perform network diagnosis using the Infrastructure applications. The Cisco Prime Infrastructure 4.1 and 4.2 versions are supported in Cisco Prime Collaboration.
Cisco Prime Collaboration requires the Cisco Prime Infrastructure hostname and user credentials to launch the Cisco Prime Infrastructure.
Prerequisites:
-
You must ensure that the device is managed in both Cisco Prime Infrastructure and Cisco Prime Collaboration applications.
-
You must ensure that all the required credentials for routers and switches are added in Cisco Prime Collaboration. For more information, see the Setting Up Devices for Prime Collaboration Assurance wiki page.
- You must ensure that the network devices that contain the Cisco Prime Infrastructure software is accessible from Cisco Prime Collaboration.
Based on the Cisco Prime Infrastructure user privilege, you can launch the following features of the Cisco Prime Infrastructure application:
-
Device View—A graphical device management tool that provides real-time views of network devices. These views deliver a continuously updated physical picture of device configuration and performance conditions.
-
Connected Hosts—Displays details on all hosts that are connected to the access switch.
-
Change Audit Report (24 hours)—Displays a summary of all changes on the device for the last 24 hours. The changes can be on the software image, configuration file, and hardware.
-
View/Edit Configuration—Displays the archived device configuration file in the raw and processed format. If you have the required privilege you can also edit the configuration file.
-
Faults (24 hours)—Displays details on the alerts and events that were triggered on the device in the last 24 hours.
-
Syslog Messages—Displays details on the syslog messages that were triggered on the device.
-
System Performance—Displays all performance parameters of the device, such as memory utilization, CPU utilization, interface utilization, environmental temperature, and poller failures.
Cross-Launch Cisco Prime Infrastructure
Note | For Cisco Prime Collaboration Release 11.5 and later Cross launch of Cisco Prime Infrastructure from 360 Integration page is not supported for Cisco Prime Collaboration Assurance 11.5. |
| Step 1 | Choose . |
| Step 2 | Enter the required details in the Cisco Prime Infrastructure Setup pane. See Cisco Prime LMS Setup Pane - Field Descriptions for more details on field descriptions. |
| Step 3 | Click Save. |
 Feedback