- Index
- Preface
- Introduction to Cisco WAAS
- Planning Your WAAS Network
- Using Device Groups and Device Locations
- Configuring Traffic Interception
- Configuring Network Settings
- Configuring Administrative Login Authentication, Authorization, and Accounting
- Creating and Managing Administrator User Accounts and Groups
- Creating and Managing IP Access Control Lists for WAAS Devices
- Configuring Other System Settings
- Using the WAE Device Manager GUI
- Configuring Wide Area File Services
- Configuring Application Acceleration
- Configuring and Managing WAAS Print Services
- Configuring Virtualization
- Maintaining Your WAAS System
- Monitoring and Troubleshooting Your WAAS Network
- Configuring SNMP Monitoring
- Default Application Policies
Cisco Wide Area Application Services Configuration Guide (Software Version 4.1.1)
Bias-Free Language
The documentation set for this product strives to use bias-free language. For the purposes of this documentation set, bias-free is defined as language that does not imply discrimination based on age, disability, gender, racial identity, ethnic identity, sexual orientation, socioeconomic status, and intersectionality. Exceptions may be present in the documentation due to language that is hardcoded in the user interfaces of the product software, language used based on RFP documentation, or language that is used by a referenced third-party product. Learn more about how Cisco is using Inclusive Language.
- Updated:
- August 28, 2008
Chapter: Monitoring and Troubleshooting Your WAAS Network
- Viewing System Information from the System Dashboard Window
- Troubleshooting Devices Using Alerts
- Viewing Device Information
- Customizing a Dashboard or Report
Monitoring and Troubleshooting Your WAAS Network
This chapter describes the monitoring and troubleshooting tools available in the WAAS Central Manager GUI that can help you identify and resolve issues with your WAAS system.

Note Throughout this chapter, the term WAAS device is used to refer collectively to the WAAS Central Managers and WAEs in your network. The term WAE refers to WAE appliances and WAE Network Modules (the NME-WAE family of devices).
This chapter contains the following sections:
- Viewing System Information from the System Dashboard Window
- Troubleshooting Devices Using Alerts
- Viewing Device Information
- Customizing a Dashboard or Report
- Using Predefined Reports to Monitor WAAS
- Configuring Flow Monitoring
- Managing Reports
- Configuring System Logging
- Configuring Transaction Logging
- Viewing the System Message Log
- Viewing the Audit Trail Log
- Viewing the Device Log
- Enabling the Kernel Debugger
- Troubleshooting Using Diagnostic Tests
- Using the show and clear Commands from the WAAS Central Manager GUI
Viewing System Information from the System Dashboard Window
The WAAS Central Manager GUI allows you to view general and detailed information about your WAAS network from the System Dashboard window. This section describes the System Dashboard window and contains the following topics:
Figure 16-1 shows the System Dashboard window.
Figure 16-1 System Dashboard Window
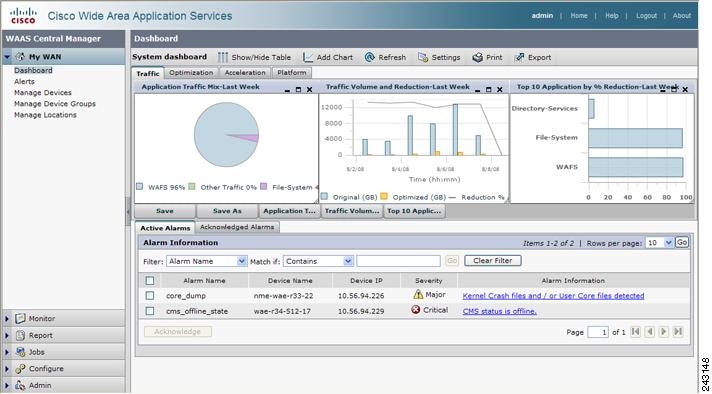
The information displayed in the charts in the System Dashboard window is based on a snapshot of your WAAS network that represents the state of your WAE devices at the end of every two polling periods. You may configure the interval between polls in the WAAS Central Manager GUI ( Configure > System Properties > System.monitoring.collectRate ). The default polling rate is 300 seconds (5 minutes). Alarms are presented in real time and are independent of the polling rate.
Monitoring Graphs and Charts
The default System Dashboard window contains four tabs that show several graphical displays about the application traffic processed by your WAAS system:
– Application Traffic Mix chart—Displays the nine applications with the highest percentage of traffic in the WAAS network for the last day.
– Traffic Volume and Reduction chart—Displays the volume of original and optimized traffic, and the percentage of traffic reduction, for the last day.
– Traffic % Reduction chart—Displays the ten applications with the highest percentage of traffic reduction for the WAAS network for the last day. The percent calculation includes pass-through traffic.
– Pass-through Traffic Mix chart—Displays the percentage of pass-through traffic due to various reasons.
– Reduction Excluding Pass-through chart—Displays the percentage of traffic reduction, excluding pass-through traffic.
– Optimized vs. Pass-through Traffic graph—Displays the amount of optimized and pass-through traffic for the last seven days.
– HTTP: Estimate Time Saved % graph—Displays an estimate of the amount of connection setup time saved for HTTP traffic for the last day due to the HTTP accelerator.
– MAPI: Estimate Time Saved % graph—Displays an estimate of the amount of response time saved for MAPI traffic for the last day due to the MAPI accelerator.
– NFS: Estimate Time Saved % graph—Displays an estimate of the amount of response time saved for NFS traffic for the last day due to the NFS accelerator.
– Video: Byte Savings for Video AO graph—Displays the amount of bytes saved for video traffic for the last day due to the video accelerator.
– Managed Devices Information—Displays the total number of WAAS devices in your network, showing the number that are online, offline, inactive, and pending. This display also shows the number of alarms of different severities and the software versions that are deployed in your network.
Numbers shown in charts and graphs are rounded to whole units (KB, MB, or GB), while those displayed in tables are rounded to three decimal places. Data values exported to CSV files are in bytes, so are not rounded.
You can customize the graphical displays and tables that are displayed on the system dashboard. For more information see the “Customizing a Dashboard or Report” section.
Much of the device, statistical, and alarm information that is presented in the system dashboard and associated graphs and charts is also available programmatically through the monitoring API. For more information, see the Cisco Wide Area Application Services API Reference .
Note You must synchronize the clock on each WAE device within a half hour of the WAAS Central Manager clock for statistics to be displayed.
Alarm Panel
The alarm panel in the System Dashboard window provides a near real-time view of incoming alarms. The panel refreshes every 2 minutes to reflect updates to the system alarm database.
The alarm panel contains two tabs: Active Alarms and Acknowledged Alarms. The Active Alarms tab displays a dynamic view of all incoming alarms. You may remove an alarm from the active display by acknowledging the alarm. Acknowledged alarms are moved to the Acknowledged Alarms view. You may choose to unacknowledged an alarm and return it to the Active view at any time.
Only Active alarms can be acknowledged in the alarm panel. Pending, Offline, and Inactive alarms cannot be acknowledged in the alarm panel.
For either view, the alarm panel also allows you to filter your view of the alarms in the list. Filtering allows you to find alarms in the list that match the criteria that you set.
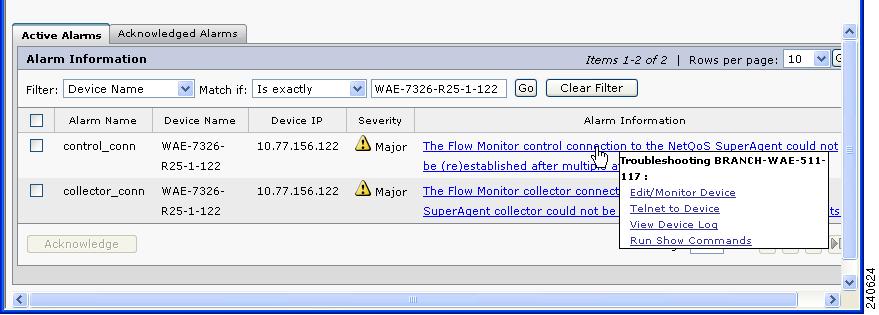
When you roll your mouse over an item under the Alarm Information column, a contextual popup menu appears. The popup menu provides links to the troubleshooting and monitoring windows in the WAAS Central Manager GUI. For more information on these links, see the “Troubleshooting Devices Using Alerts” section.
Figure 16-2 shows the alarm panel in the System Dashboard window.
Figure 16-2 System Dashboard Window Alarm Panel
To acknowledge an active alarm and move it from Active Alarms to the separate Acknowledged Alarms section, follow these steps:
Step 1 From the System Dashboard window alarm panel, check the check box next to the name of the alarm that you want to acknowledge.
Step 2 Click the Acknowledge button.
A dialog box pops up that allows you to enter comments about the alarm.
Step 3 Enter a comment and click OK . Alternatively, click Cancel to return to the Active Alarm panel without completing the acknowledge action.
Comments enable you to share information about the cause or solution of a particular problem that caused the alarm. The comments field accepts up to 512 characters. You may use any combination of alpha, numeric, and special characters in this field.
The alarm will be moved to the Acknowledged Alarms tab.
To filter and sort alarms displayed in the System Dashboard window alarm panel, follow these steps:
Step 1 From the Filter drop-down list, choose one of the following filtering options:
Step 2 From the Match if drop-down list, choose one of the following match conditions:
Step 3 Enter a match string in the text entry field. This field accepts any alphanumeric text, including special characters.
Step 5 To sort alarm entries, click a column header.
Entries are sorted alphabetically (in ASCII order). The sort order (ascending or descending) is indicated by an arrow in the column header that points up for ascending order.
Step 6 To clear the filter, click Clear .
Device Alarms
Device alarms are associated with device objects and pertain to applications and services running on your WAAS devices. Device alarms are defined by the reporting application or service. Device alarms can also reflect reporting problems between the device and the WAAS Central Manager GUI. Table 16-1 describes the various device alarms that can appear.
Troubleshooting Devices Using Alerts
The WAAS Central Manager GUI allows you to view the alarms on each device and troubleshoot a device in the Troubleshooting Devices window.
To troubleshoot a device from the Troubleshooting Devices window, follow these steps:
Step 1 From the WAAS Central Manager GUI navigation pane, invoke the Troubleshooting Devices window in one of these ways:
The Troubleshooting Devices window appears, either in the WAAS Central Manager window or as a separate popup window. (See Figure 16-3.)
Figure 16-3 Troubleshooting Devices Window
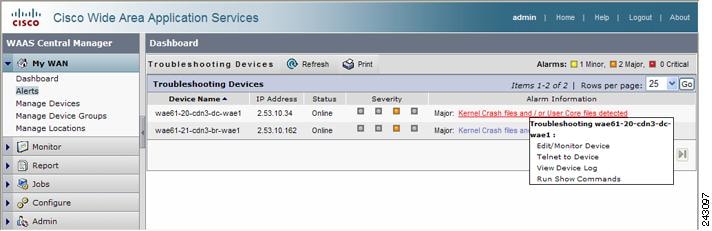
Step 2 In the Alarm Information column, hold your mouse over an alarm message until the Troubleshooting tools contextual menu appears. The popup menu provides links to the troubleshooting and monitoring windows in the WAAS Central Manager GUI.
Step 3 Choose the troubleshooting tool that you want to use, and click the link. The link takes you to the appropriate window in the WAAS Central Manager GUI. Table 16-2 describes the tools available for device alarms.
Displays Software Update window for this device. Appears only if the device software version is lower than the Central Manager. |
||
Displays device show command tool. For more information, see the “Using the show and clear Commands from the WAAS Central Manager GUI” section. |
Viewing Device Information
The WAAS Central Manager GUI allows you to view basic and detailed information about a device from the following two windows:
- Devices Window—Displays a list of all the devices in your WAAS network along with basic information about each device such as the device status and the current software version installed on the device.
- Device Dashboard Window—Displays detailed information about a specific device, such as the installed software version and whether the device is online or offline.
Each window is explained in the sections that follow.
Devices Window
The Devices window lists all the WAAS devices that are registered with the WAAS Central Manager. To view this list, choose My WAN > Manage Devices in the WAAS Central Manager GUI.
Figure 16-4 shows an example of the Devices window.
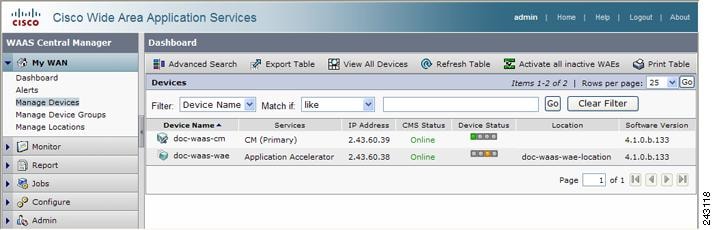
This window displays the following information about each device:
- Services enabled on the device. See Table 16-3 for a description of these services.
- IP address of the device.
- CMS Status (online, offline, pending, or inactive). For more information about the status, see the “Device Alarms” section.
- Device Status. The system status reporting mechanism uses four alarm lights to identify problems that need to be resolved. Each light represents a different alarm level as follows:
– Green—No alarms (the system is in excellent health)
When you roll your mouse over the alarm light bar, a popup message provides further details about the number of alarms. Click the alarm light bar to troubleshoot the device. For more information, see the “Troubleshooting Devices Using Alerts” section.
- Location associated with the device. For more information about locations, see Chapter3, “Using Device Groups and Device Locations”
- Software version installed and running on the device.
Any WAE devices that are at a higher software version level than the WAAS Central Manager are shown in red. Also, if the standby WAAS Central Manager has a different version level from the primary WAAS Central Manager, the standby WAAS Central Manager is shown in red.
The device has been enabled as the primary WAAS Central Manager. For information on primary and standby Central Manager devices, see the “Switching a WAAS Central Manager from Standby to Primary” section. |
|
The device has been enabled as a standby WAAS Central Manager. For information on primary and standby Central Manager devices, see the “Switching a WAAS Central Manager from Standby to Primary” section. |
|
The device has been enabled as a replication accelerator. (Supported only on 4.0.19 or later 4.0.x devices.) |
|
The device has been enabled with legacy WAFS Edge services so it can accelerate data stored on a remote file server. For information on enabling WAFS, see Chapter11, “Configuring Wide Area File Services” |
|
The device has been enabled with legacy WAFS Core services so it can accelerate data stored on a remote file server. For information on enabling WAFS, see Chapter11, “Configuring Wide Area File Services” |
|
The device has been enabled with legacy print services so it can act as a print server to branch office clients. For information on setting up a print server, see Chapter13, “Configuring and Managing WAAS Legacy Print Services” |
Device Dashboard Window
The Device Dashboard window provides detailed information about a WAAS device such as the device model, IP address, interception method, and device-specific charts. (See Figure 16-5.)
To access the Device Dashboard window, go to My WAN > Manage Devices and click the Edit icon next to the device that you want to view.
Figure 16-5 Device Dashboard Window

From the Device Dashboard window, you can perform the following tasks:
- View charts and graphs about the application traffic processed by the selected WAE device. (No charts or graphs are displayed if a WAAS Central Manager device is selected.)
- Customize the charts displayed in the chart panel in the top of the window. For more information, see the “Customizing a Dashboard or Report” section.
- View basic details such as whether the device is online, the device’s IP address and hostname, the software version running on the device, and the amount of memory installed in the device.
- View the device groups to which the device belongs. For more information about device groups, see Chapter3, “Using Device Groups and Device Locations”
- Click Update Software to update the software on the device. For more information, see Chapter15, “Maintaining Your WAAS System”
- Click Device GUI to open the WAE Device Manager. For more information on managing a device using this GUI, see Chapter10, “Using the WAE Device Manager GUI”
- Click Telnet to establish a Telnet session into the device and issue CLI commands.
- Assign and unassign the device to baseline groups. For more information, see Chapter3, “Using Device Groups and Device Locations”
Customizing a Dashboard or Report
You can customize the system and device dashboards and any report. The dashboards and reports work the same way. For more information about creating custom reports, see the “Managing Reports” section.
If the charts panel (see Figure 16-6) in the upper part of the window has tabs, you can click other tabs to display other groups of charts.
You can use the minimize, maximize, and close buttons on the top of individual chart panes to minimize, maximize, and close the chart. When a chart is maximized, the middle button changes to a restore button that restores the chart to its smaller size. You can move a chart pane by clicking and dragging its title bar. You can resize a chart by clicking and dragging on the resize control in the lower right corner of the chart pane.
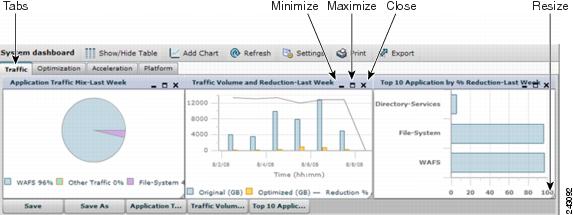
Icons across the top of the dashboard allow you to do the following:
- Show/Hide Table—Shows or hides the table panel in the lower part of the window. For the system dashboard, this is the Alarms table, and for the device dashboard, it is the Device Information table. Dashboard tables are fixed and cannot be changed. You can include different tables in custom reports.
- Add Chart—Adds a graphical chart to the charts panel. You can display a maximum of six charts. For details on adding a chart, see the “Adding a Chart” section.
- Refresh—Refreshes the charts and tables with new information.
- Settings—Sets the time frame and included applications for the data presented in each chart. For details on these settings, see the “Configuring Chart Settings” section.
- Print—Prints the charts panel.
- Export—Exports the chart statistical data to a CSV file. The statistical data shown in charts is rounded to whole units (KB, MB, or GB), while the exported data contains exact byte values.
Buttons below the charts panel allow you to do the following:
- Save—Saves the dashboard or report with its current settings. The next time you view it, it is displayed with these settings.
- Save As—Saves the report with its current settings under a new name.
- Chart Names—Displays or hides the named chart.
Adding a Chart
To add a chart to a dashboard or report, follow these steps:
Step 1 From the dashboard or report chart panel, click the Add Chart icon in the taskbar. The Add Chart window is displayed, as shown in Figure 16-7.
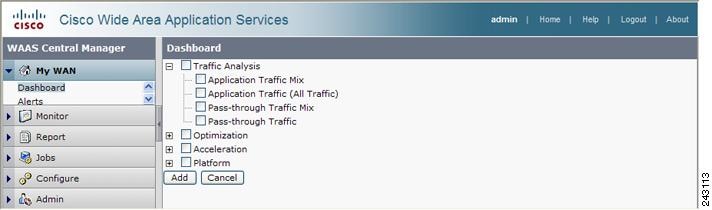
Step 2 Expand any of the chart categories by clicking on the plus sign next to the category.
Step 3 Check the box next to each chart that you want to display. See Table 16-4 for a description of the charts.
Remember that a report can contain a maximum of six charts.
Table 16-4 describes the charts that you can choose to include in a dashboard or report.
|
|
|
|
|
|
|
|
|
|
|
|
|
|
Displays a graph of the percent of total traffic that was reduced on the WAE device using the WAAS optimization techniques. This chart excludes pass-through traffic in the total results. You can choose which applications to include; the default is all traffic. This graph is similar to the Reduction Incl PT graph, but it excludes pass-through traffic. |
|
|
|
|
|
|
|
Displays the optimized CIFS session count. Available only for a device that is operating in transparent CIFS accelerator mode or WAFS legacy mode as an Edge device. |
|
Displays the open CIFS file count. Available only for a device that is operating in transparent CIFS accelerator mode or WAFS legacy mode as an Edge device. |
|
Displays the hit rate for the CIFS cache. Available only for a device that is operating in transparent CIFS accelerator mode or WAFS legacy mode as an Edge device. |
|
Displays the object count for the CIFS cache. Available only for a device that is operating in transparent CIFS accelerator mode or WAFS legacy mode as an Edge device. |
|
Displays the utilization percentage of the CIFS cache. Available only for a device that is operating in transparent CIFS accelerator mode or WAFS legacy mode as an Edge device. |
|
Displays the CIFS request count. Available only for a device that is operating in transparent CIFS accelerator mode or WAFS legacy mode as an Edge device. |
|
Displays the CIFS cache disk capacity. Available only for a device that is operating in transparent CIFS accelerator mode or WAFS legacy mode as an Edge device. |
|
Displays the count of connected WAFS Core devices. Available only for a device that is operating in WAFS legacy mode as an Edge device. |
|
Displays the count of connected WAFS Edge devices. Available only for a device that is operating in WAFS legacy mode as a Core device. |
|
|
|
|
|
|
|
|
|
|
|
|
|
Displays an estimate of the percentage of response time saved by the MAPI accelerator. This graph is similar to the HTTP: Estimate Time Saved % graph. |
|
Displays the MAPI session connection statistics, showing the total number of connections handled along with the number of unaccelerated connections. This graph is similar to the HTTP: Connection Statistics graph. |
|
|
|
Displays the effective bandwidth capacity of the WAN link as a result of MAPI acceleration, as a multiplier of its base capacity. Effective capacity is shown for other traffic and for email and messaging (MAPI) traffic. This graph is similar to the HTTP: Effective WAN Capacity graph. |
|
Displays the percentage of local and remote NFS responses. A local response is one that is sent to the client without waiting for a response from the peer WAE. A remote response comes from the remote server. This graph is similar to the MAPI: Response Counts graph. |
|
Compares the average time (in milliseconds) used for local and remote NFS responses. This graph is similar to the MAPI: Average Response Time graph. |
|
|
|
Displays an estimate of the percentage of response time saved by the NFS accelerator. This graph is similar to the HTTP: Estimate Time Saved % graph. |
|
Displays the NFS session connection statistics, showing the total number of connections handled along with the number of unaccelerated connections. This graph is similar to the HTTP: Connection Statistics graph. |
|
Displays a pie chart of the reasons that NFS traffic is not accelerated. This graph is similar to the MAPI: Reason for un-accelerations graph. |
|
Displays the effective bandwidth capacity of the WAN link as a result of NFS acceleration, as a multiplier of its base capacity. Effective capacity is shown for other traffic and for file system (NFS) traffic. This graph is similar to the HTTP: Effective WAN Capacity graph. |
|
|
|
|
|
Displays the video session connection statistics, showing the total number of connections handled along with the number of unaccelerated connections. This graph is similar to the HTTP: Connection Statistics graph. |
|
Displays a pie chart of the reasons that video traffic is not accelerated. This graph is similar to the MAPI: Reason for un-accelerations graph. |
|
Displays the effective bandwidth capacity of the WAN link as a result of video acceleration, as a multiplier of its base capacity. Effective capacity is shown for all traffic and for streaming (video) traffic. This graph is similar to the HTTP: Effective WAN Capacity graph. |
|
|
|
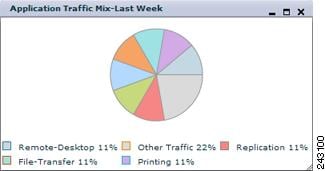 Displays the top nine applications with the highest percent of traffic. Each section
 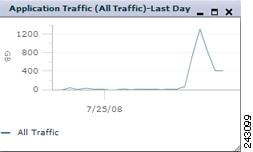 Displays a graph of the amount of traffic processed on the WAE device. You can choose which applications to include; the default is all traffic.
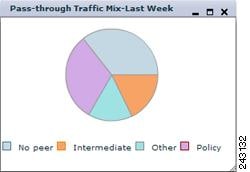 Displays a pie chart showing the most common reasons that traffic passed through the WAE device unoptimized. WAAS devices will pass-through traffic unoptimized for the following reasons:
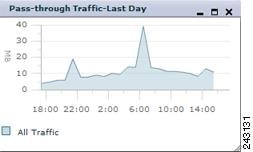 Displays a graph of the amount of pass-through traffic. You can choose which applications to include; the default is all traffic.
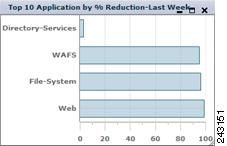 Displays a bar chart of the top ten applications with the highest percentage of traffic reduction.
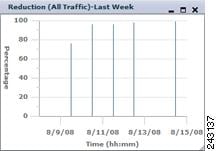 Displays a bar chart of the percent of total traffic that was reduced on the WAE device using the WAAS optimization techniques.
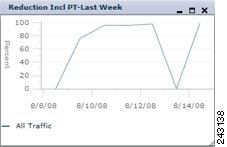 Displays
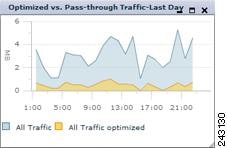 Displays a graph of the amount of optimized and pass-through traffic on the WAE device. The chart in the display is a stacked graph; the pass-through traffic data is indicated by the color blue and is shown behind the optimized data which is indicated by the color orange.
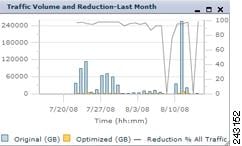 Displays the amount of original and optimized traffic in a bar chart, along with the percentage of traffic reduction.
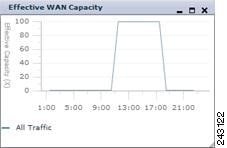 Displays the effective increased bandwidth capacity of the WAN link as a result of WAAS optimization, as a value between 1X (times) and 100X. You can choose which applications to include; the default is all traffic.
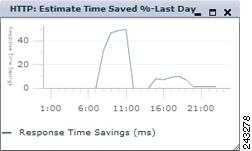 Displays an estimate of the percentage of connection setup time saved by the HTTP accelerator. For example, a value of 50% indicates that 50% of the HTTP connections were reused.
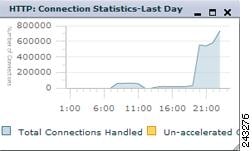 Displays the HTTP session connection statistics, showing the total number of connections handled along with the number of unaccelerated connections.
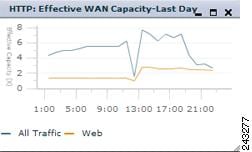 Displays the effective bandwidth capacity of the WAN link as a result of HTTP acceleration, as a multiplier of its base capacity. Effective capacity is shown for all traffic and for web (HTTP) traffic.
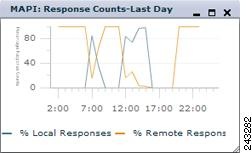 Displays the percentage of local and remote MAPI command responses. A local response is one that is sent to the client without waiting for a response from the peer WAE. A remote response comes from the remote server.
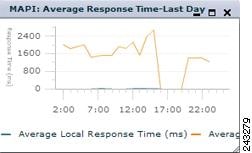 Compares the average time (in milliseconds) used for local and remote MAPI responses.
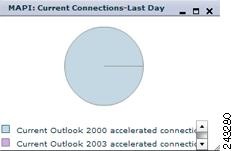 Displays a pie chart of the current number of active MAPI connections.
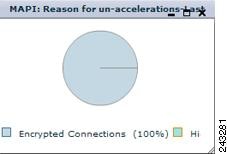 Displays a pie chart of the reasons that MAPI traffic is not accelerated.
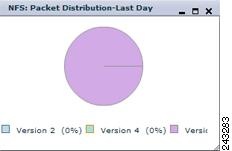 Displays a pie chart of the number of NFS messages seen for each NFS version (2, 3, and 4). The NFS accelerator works with NFS version 3 traffic, so you will want to see this kind of traffic for best results.
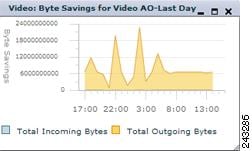 Displays the percentage of byte savings for the video accelerator.
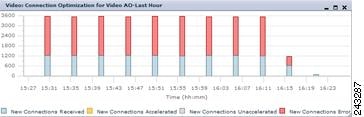 Displays the number of video connections received, accelerated, not accelerated, and received with errors by the video accelerator.
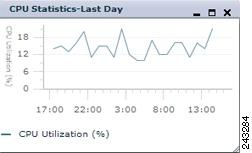 Displays the percentage of CPU utilization for the device.
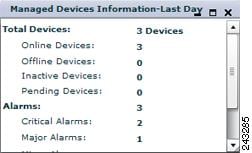 Displays information about the number of devices managed by the WAAS Central Manager, the device status, number of alarms, and software versions.
Configuring Chart Settings
To configure the data presented in a chart, follow these steps:
Step 1 From the dashboard or report chart panel, click the Settings icon in the taskbar. The Settings window is displayed, as shown in Figure 16-8.
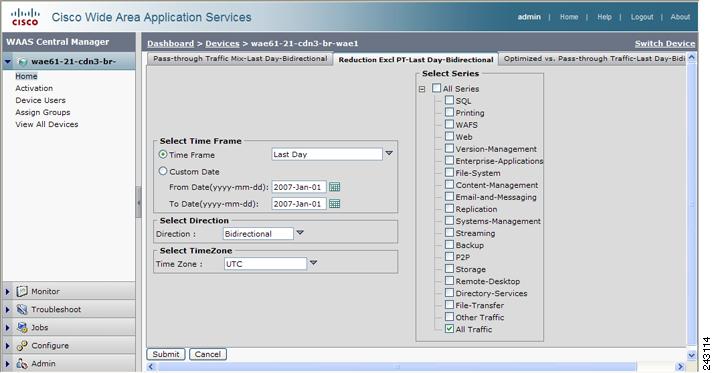
Step 2 Click on the tab corresponding to the chart that you want to change.
Step 3 In the Select Time Frame area, choose a time frame for the chart. Choose one of these options by clicking on the appropriate radio button:
– Last Hour —Displays data for the past hour (in five-minute intervals). You can change this interval using the System.monitoring.collectRate configuration setting described in the “Modifying the Default System Configuration Properties” section.
– Last Day —Displays data for the past day (in hourly intervals).
– Last Week —Displays data for the past week (in daily intervals).
– Last Month —Displays data for the past month (in daily intervals).
Step 4 From the Direction drop-down list, choose one of the following options:
The Select Direction area appears only when you are configuring certain device level charts.
Step 5 From the Time Zone drop-down list, choose one of the following options:
- UTC —Sets the time zone of the report to UTC.
- CDM Local Time —Sets the time zone of the report to the time zone of the WAAS Central Manager.
- CE Local Time —Sets the time zone of the report to the time zone of the WAE device. This option appears only when you are configuring a device level chart.
Step 6 In the Select Series area, click the plus sign to expand the All Series list. Place a check mark next to the applications whose statistics you want to include in the chart data. This optional area applies only to specific chart types. To include all applications, choose All Traffic .
Using Predefined Reports to Monitor WAAS
The WAAS Central Manager includes a number of predefined reports that you can use to monitor the system operation. These reports are available in the Monitor drawer in the navigation pane.
You can customize these predefined reports by editing them with the Manage Report function available in the Report drawer, as described in the “Viewing and Editing Reports” section.
The following predefined reports are available at the WAAS system level and at the WAE device level:
– Network Traffic Summary Report—Displays a summary of all traffic.
– Network Traffic Application Mix—Displays the application traffic mix.
– Network Pass Through Report—Displays the pass-through traffic.
– Acceleration reports for HTTP, Video, MAPI, and NFS traffic—Displays a report showing graphs of time saved (or bytes saved), effective WAN capacity, connection statistics, and reasons for unaccelerated traffic, and a table of acceleration statistics for five-minute intervals.
- Topology—Displays a graphical representation of all connections between WAE devices. For more information, see the “Viewing Connections and Peer Devices” section.
The following predefined reports are available only at the device level:
– Volume Analysis Report—Displays a traffic volume analysis.
– Connections Statistics—Displays TCP connection information. For more information, see the “Monitoring Device TCP Connections” section.
– CIFS Acceleration Report—Includes the following WAFS detail charts. Most of these charts (except as noted) are available only when the device is operating in transparent CIFS accelerator mode or WAFS legacy mode as an Edge device. These graphs are the same WAFS Edge device and WAFS Core traffic monitoring graphs that are available from the WAE Device Manager GUI. These graphs are described in the “Monitoring the WAE” section.
Request Hit Rate—Displays the hit rate for the CIFS cache.
Cache Object Count—Displays the object count for the CIFS cache.
Optimized CIFS Sessions Count—Displays the optimized CIFS session count.
Cache Utilization—Displays the utilization percentage of the CIFS cache.
Open File Count—Displays the open CIFS file count.
Cache Disk Capacity—Displays the CIFS cache disk capacity.
Request Count—Displays the CIFS request count.
Connected CIFS Core Count—Displays the count of connected WAFS Core devices. Available only when the device is operating in WAFS legacy mode as an Edge device.
Connected CIFS Edge Count—Displays the count of connected WAFS Edge devices. Available only when the device is operating in WAFS legacy mode as a Core device.
– CPU Statistics—Displays the CPU utilization percentage. For more information, see the “Viewing CPU Utilization” section.
– Disks—Displays device disk information. For more information, see the “Viewing Disk Information” section.
Viewing Connections and Peer Devices
The WAAS Central Manager GUI lets you view a list of the all the peer devices connected to a specific WAE so that you can see the relationship between devices in your WAAS network. You can also use the WAAS Central Manager GUI to view a topology map so that you see a graphical representation of all the connections between the WAE devices. For example, if you are interested in seeing the WAEs that have participated in TFO connections with Device A, you can use the topology map or the device list to view these connections.
Note The WAAS Central Manager device does not have any peers because it does not participate with any WAEs to optimize traffic. For this reason, the topology feature is not available on the WAAS Central Manager device.
To view the topology for a WAE device, follow these steps:
Step 1 From the WAAS Central Manager GUI navigation pane, choose My WAN > Manage Devices .
Step 2 Click the Edit icon next to the device for which you want to view its TFO peers. The Device Dashboard window appears.
Step 3 From the navigation pane, choose Monitor > Topology . The TFO List Reported by Device window appears.
This window displays information about each peer device involved in optimized connections with this WAE.
If a peer device is not registered with the WAAS Central Manager, the MAC address for the peer device name is shown and “unknown” is displayed for the IP address.
Step 4 View a topology map that displays a grid of all the connections between your WAE devices, by doing one of the following steps:
The topology map uses blue squares to show connections between devices. Use the legend to the right of the grid to associate the device name with the number that appears at the top of the grid.
Step 5 Use the drop-down lists at the top of the window to perform the following tasks:
Step 6 Click the View icon next to the WAE to view a list of peer devices for a specific WAE. The TFO Peer List window appears.
Monitoring Device TCP Connections
To view the device TCP connection information, follow these steps:
Step 1 From the WAAS Central Manager GUI navigation pane, choose My WAN > Manage Devices .
Step 2 Click the Edit icon next to the device for which you want to view TCP connection information.
Step 3 Choose Monitor > Traffic Analysis > Connections Statistics . The Connection Summary Table for Device window appears.
This window displays all of the TCP connections handled by the device and corresponds to the show tfo connections summary EXEC mode command. (See Figure 16-9.)
Figure 16-9 Device Connections Summary Table
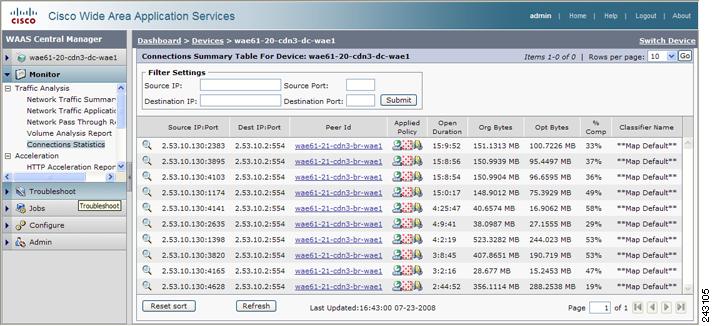
This window displays the following information about each connection:
- Source IP address and port
- Destination IP address and port
- Peer ID—Hostname of the peer device
- Applied Policy (icons represent TFO, DRE, and LZ, respectively)
- Open Duration—Number of hours, minutes, and seconds that the connection has been open
- Total number of original bytes
- Total number of optimized bytes
- Percentage of compression
- Classifier name
The data in the Connection Summary Table is retrieved from the device one time when you view the window for the first time.
Step 4 Click the Refresh button at the bottom of the window to refresh the data in the Connection Summary Table.
From the Connection Summary Table for Device window, you may perform the following tasks:
Step 5 Click the Details icon next to the connection entry in the summary table to view connection details.
The Connection Details window appears. This window contains connection addresses, port information, policy information, and traffic statistics. The Connection Details window also displays a graph that plots real-time traffic statistics. (See Figure 16-10.)
Figure 16-10 Connection Details
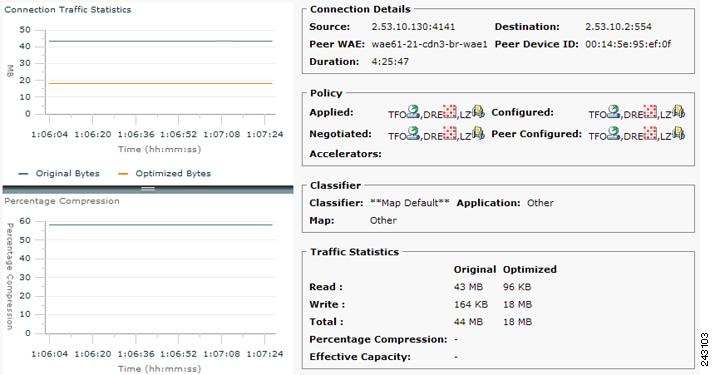
Note If the value for Percentage Compression is negative, the Percentage Compression and Effective Capacity values do not appear.
Viewing CPU Utilization
To view the CPU Utilization report and configure the reporting options, follow these steps:
Step 1 From the WAAS Central Manager GUI navigation pane, choose My WAN > Manage Devices .
Step 2 Click the Edit icon next to the WAAS device for which you want to view CPU utilization.
Step 3 In the navigation pane, choose Monitor > Platform > CPU Statistics . The CPU Utilization Report window appears, displaying the statistical data. You can do the following:
Viewing Disk Information
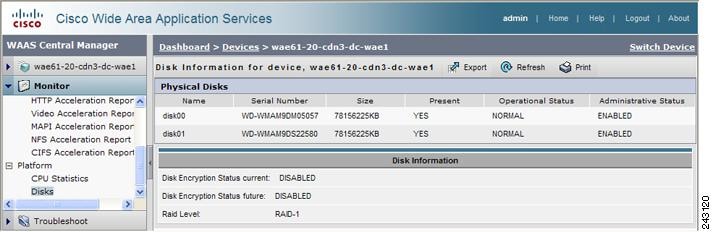
The WAAS Central Manager GUI allows you to monitor physical and logical disk information. The Device Dashboard window shows the number of local disks and the RAID level. View further disk information details in the Disk Information for device window ( My WAN > Manage Devices > Monitor > Platform > Disks ). (See Figure 16-11.)
This window displays the following information about each disk:
- Physical disk information, including the disk name, serial number, and disk size.
- Present status. The Present field will show either Yes if the disk is present, or Not Applicable if the disk is administratively shut down.
- Operational status (NORMAL, REBUILD, BAD, or UNKNOWN).
- Administrative status (ENABLED or DISABLED). When the Administrative Status field shows DISABLED, the Present field will show Not Applicable.
- Current and future disk encryption status.
- RAID level. For RAID-5 devices, the Disk Information window includes the RAID device name, RAID status, and RAID device size.
From this window, you may save all disk information details to an Excel spreadsheet by clicking the Export Table icon in the taskbar.
Figure 16-11 Disk Information for Device Window
Configuring Flow Monitoring
Flow monitoring applications collect traffic data that is used for application trend studies, network planning, and vendor-deployment impact studies. This section describes how to configure the flow monitoring feature on the WAE and includes the following topics:
The NetQoS monitoring application can interoperate with the WAAS software to provide flow monitoring. To integrate this application with the WAAS software, you configure the NetQoS FlowAgent module on the WAE devices. The NetQoS FlowAgent module on the WAE collects important metrics of packet flows, which are then sent across the network to the NetQoS SuperAgent. This monitoring agent analyzes the data and generates reports. For this feature to work, additional configuration is required on the NetQoS FlowAgent. (See the “Example Using NetQoS for Flow Monitoring” section.)
The monitoring agent is composed of two modules: the console (or host) and the collector. The WAE initiates two types of connections to these two monitoring agent modules: a temporary connection to the console and a persistent connection to the collector. You configure the console IP address on the WAE by entering the flow monitor tcpstat-v1 host configuration mode command in either the WAE CLI or through the Central Manager GUI. This temporary connection is referred to as the control connection. The control connection uses TCP port 7878. Its purpose is to obtain the IP address and port number of the collector to which the WAE is assigned. The WAE also pulls the configuration information regarding which servers are to be monitored over the control connection. Once the WAE obtains the IP address and port number of the collector, the WAE opens a persistent connection to the collector. Collected summary data for the servers that are being monitored is sent over this persistent connection.
You may place the console (or host) module and the collector module on a single device or on separate devices. These connections are independent of one another. A failure of one connection does not cause the failure of the other connection and vice versa.
The state of these connections and various operation statistics display when you use the show statistics flow monitor tcpstat-v1 EXEC mode command. Connection errors and data transfer errors trigger alarms on the WAE and in the Central Manager GUI. (See the “Alarms for Flow Monitoring” section.) To display debug information, use the debug flow monitor tcpstat-v1 EXEC mode command.
To configure flow monitoring on your WAEs using the Central Manager GUI, follow these steps:
Step 1 Create a new device group for configuring flow monitoring on multiple devices. Choose My WAN > Manage Device Groups > Create New Device Group to create a device group.
a. When you create the device group, check the Automatically assign all newly activated devices to this group check box to enable this option.
b. Add your existing WAE devices to this new device group.
Step 2 From the Device Group listing window, click the Edit icon next to the name of the flow monitoring configuration device group that you want to configure.
Step 3 In the navigation pane, choose Configure > Network Monitoring > Flow Monitor . The Flow Monitor Settings for Device Group window appears.
Step 4 Check the Enable check box.
Step 5 In the tcpstat-v1 Host field, enter the IP address of the monitoring agent console.
This configuration allows the WAE to establish a temporary connection (a control connection) to the console for the purpose of obtaining the IP address of the collector device. You must configure the collector IP address information from the console device. (See the configuration documentation for your third-party flow monitoring application software.)
Step 6 Click Submit to apply the settings to the devices in this device group.
To configure flow monitoring on the WAE using the CLI, follow these steps:
Step 1 Register the WAE with the IP address of the monitoring agent console:
This configuration allows the WAE to establish a temporary connection (a control connection) to the console (or host) for the purpose of obtaining the IP address of the collector device. You must configure the collector IP address information from the console device. (See the configuration documentation for your third-party flow monitoring application software.)
Step 2 Enable flow monitoring on the WAE appliance:
Step 3 Check the configuration by using the show running-config EXEC command.
Alarms for Flow Monitoring
Table 16-5 describes the four different alarms that may be raised when errors occur with flow monitoring.
Example Using NetQoS for Flow Monitoring
NetQoS integrates with the WAAS software by running the NetQoS FlowAgent on WAE devices. FlowAgent is a software module developed by NetQoS that resides on the WAE appliance. The FlowAgent collects metrics about the packet flows, which are then sent across the network to a NetQoS SuperAgent. The SuperAgent measures the round-trip times, server response times, and data transfer times, analyzes the data, and generates reports.
Note When you use flow monitoring with the NetQoS SuperAgent, the flow monitor on the WAE captures optimized traffic only.
To configure flow monitoring with NetQoS, follow these steps:
Step 1 From the WAE CLI or Central Manager GUI, enter the SuperAgent Master Console IP address in the tcpstat-v1 Host field on your WAE appliances.
If you are configuring multiple appliances through a device group, wait for the configuration to propagate to all the appliances in the device list.
Step 2 From the NetQoS SuperAgent console, assign a WAE to a SuperAgent Aggregator (known as the collector in WAAS terminology) and configure the NetQoS Networks, Servers, and Applications entities.
Note For information about using the NetQoS SuperAgent Master Console and configuring NetQoS SuperAgent entities, go to the following website: http://www.netqos.com
Managing Reports
The WAAS Central Manager allows you to edit any of the predefined reports and to create custom reports. Additionally, you can schedule reports to be generated periodically such as daily, weekly, or monthly. When a scheduled report is generated, a link to the report is e-mailed to notify the recipients.
This section contains the following topics:
Creating Custom Reports
A report consists of one or more charts in the chart panel (upper portion of the window) and a table in the table panel (lower portion of the window). The system and device dashboard displays are examples of predefined reports, along with the other reports available in the Monitor drawer.
Reports can be created only at the system level, not at the device level.
To create a custom report, follow these steps:
Step 1 From the WAAS Central Manager GUI navigation pane, choose Report > Manage Reports .
Step 2 Click the Create New Report icon in the taskbar. The Custom Report window appears, as shown in Figure 16-12.
Figure 16-12 Creating a Report
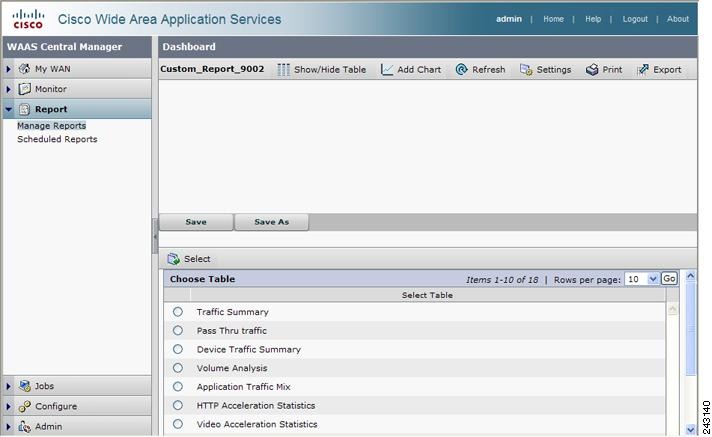
Step 3 Choose a table to display in the lower table panel of the report by clicking the radio button next to the table in the Choose Table area and then clicking the Select button above the Choose Table area.
Step 4 Add one or more charts to be displayed in the upper chart panel of the report by clicking the Add Chart icon in the taskbar. The Add Chart window is displayed, as shown in Figure 16-7.
Step 5 Expand any of the chart categories by clicking on the plus sign next to the category.
Step 6 Check the box next to each chart that you want to display. See Table 16-4 for a description of the charts.
A report can contain a maximum of six charts.
Step 8 Customize any of the chart settings by clicking the Settings icon in the taskbar. For more information, see the “Configuring Chart Settings” section.
Step 9 Click the Save As button below the chart panel to save the report with a new name. The Save As popup window appears.
(If you use the Save button, the report is saved with a default name such as Custom_Report_9001.)
Step 10 Enter the report name and any notes about the report.
All of the taskbar icons above the charts panel and the buttons below the charts panel work as described in the “Customizing a Dashboard or Report” section.
Viewing and Editing Reports
To view or edit a report, follow these steps:
Step 1 From the WAAS Central Manager GUI navigation pane, choose Report > Manage Reports .
Step 2 Check the box next to the report that you want to view or edit.
If you do not see the report that you are looking for, you may need to navigate to another page of the Reports table.
Step 3 To delete a report, click the Delete icon in the taskbar.
Step 4 To view or edit a report, click the Edit icon in the taskbar. The report is displayed.
Step 5 If you want to change any of the charts in the report, use the standard chart editing methods as described in the “Creating Custom Reports” section.
Step 6 Click Save or Save As to save the report.
When editing a report, you cannot change the table that is displayed in the table panel. If you want to change the table, you must create a new report.
When viewing a report, click the Refresh button below the table panel to refresh the data in the table.
Scheduling Reports
You can schedule reports to be generated once or periodically such as daily, weekly, or monthly. When a scheduled report is generated, a link to the report is e-mailed to notify the recipients.
To schedule a report, follow these steps:
Step 1 From the WAAS Central Manager GUI navigation pane, choose Report > Manage Reports .
Step 2 Check the box next to the report that you want to schedule.
If you do not see the report that you are looking for, you may need to navigate to another page of the Reports table.
Step 3 Click the Schedule icon in the taskbar. The scheduling window appears, as shown in Figure 16-13.
Figure 16-13 Scheduling a Report
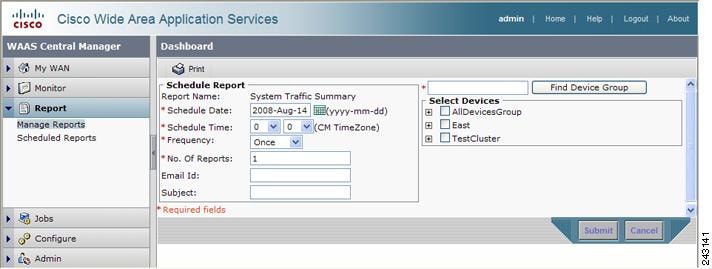
Step 4 In the Schedule Date field, enter the schedule date in the format YYYY-MM-DD, or click the calendar icon to display a calendar popup window from which to choose the date.
Step 5 In the Schedule Time field, choose the hours and minutes from the drop-down lists. The time represents the local time at the WAAS Central Manager.
Step 6 In the Frequency drop-down list, choose Once, Daily, Weekly, or Monthly for the report frequency.
Step 7 In the No. of Reports field, enter the number of times that a reoccurring report is to be generated. After being generated the specified number of times, the report is no longer generated.
Step 8 In the Email Id field, enter the e-mail addresses of the report recipients, separated by commas.
Step 9 In the Subject field, enter the subject of the e-mail message.
Step 10 In the Select Devices area, select the devices that are to be included in the statistics for the report. Place a check in the box next to each device or device group that you want to include.
To find (highlight) a device group in a long list, enter the device group name in the field above the list and click Find Device Group . The search is case sensitive.
Step 12 Configure the e-mail server settings for e-mail notification when reports are generated. For more information, see the “Configuring the E-mail Notification Server” section.
Managing Scheduled Reports
To view or delete a scheduled report, follow these steps:
Step 1 From the WAAS Central Manager GUI navigation pane, choose Report > Scheduled Reports . The Scheduled Reports window lists the scheduled reports.
Step 2 (Optional) If you want to view a report, click the plus sign on the row for the schedule. The row expands to show the report instances for the schedule. Each instance shows the report name, devices selected, scheduled time, completed time, frequency, and status.
Check the box next to the report instance that you want to view and click the View Completed Report icon on the taskbar; or, click the Completed link in the status column. You can view only completed reports. If a report instance has a status of Not Started or In Progress, you must wait for it to complete before you can view the report.
Step 3 (Optional) If you want to delete a report, check the box next to one or more report instances that you want to delete and click the Delete Selected Reports icon on the taskbar. You must select report instances, not the schedule name above a group of instances. If all report instances are deleted, the schedule is also deleted.
WAAS stores the 10 most recently completed or failed report instances for each custom report. This number is configurable by the System.monitoring.maxReports system property. For details on changing this property, see the “Modifying the Default System Configuration Properties” section.
Configuring System Logging
Use the WAAS system logging feature to set specific parameters for the system log file (syslog). This file contains authentication entries, privilege level settings, and administrative details. The system log file is located on the system file system (sysfs) partition as /local1/syslog.txt.
To enable system logging, follow these steps:
Step 1 From the WAAS Central Manager GUI navigation pane, choose My WAN > Manage Devices ( or Manage Device Groups ).
Step 2 Click the Edit icon next to the device or device group for which you want to enable system logging.
Step 3 From the navigation pane, choose Admin > System Log Settings . The System Log Settings window appears. (See Figure 16-14.)
Figure 16-14 System Log Settings Window
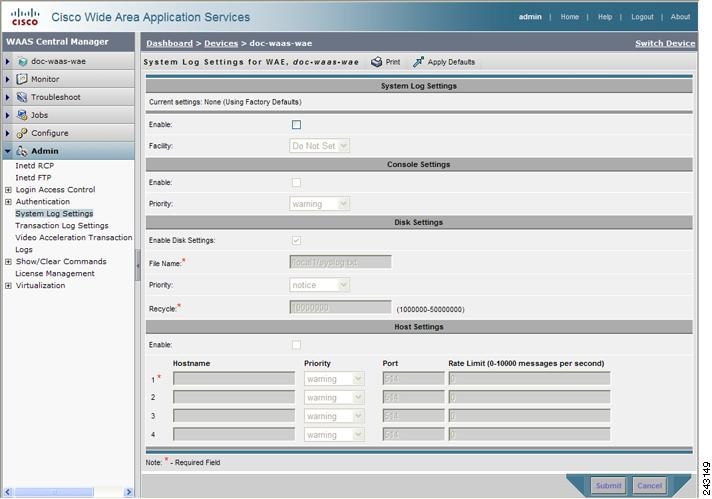
Step 4 Under the System Log Settings section, check the Enable check box to enable system logging. By default, this option is disabled.
Step 5 From the Facility drop-down list, choose the appropriate facility.
Step 6 Enable system log files to be sent to the console:
a. In the Console Settings section, check the Enable check box.
b. From the Priority drop-down list, choose the severity level of the message that should be sent to the specified remote syslog host. The default priority-code is “warning” (level 4). Each syslog host is capable of receiving a different level of event messages. (See Table 16-6 for a list of priority levels.)
Step 7 Enable syslog files to be sent to disk:
a. In the Disk Settings section, check the Enable Disk Settings check box.
b. In the File Name field, enter a path and a filename where the syslog files will be stored on disk.
c. From the Priority drop-down list, choose the severity level of the message that should be sent to the specified remote syslog host. The default priority-code is “warning” (level 4). Each syslog host is capable of receiving a different level of event messages. (See Table 16-6 for a list of priority levels.)
d. In the Recycle field, specify the size of the syslog file (in bytes) that can be recycled when it is stored on disk. The default value of the file size is 10000000.
Whenever the current log file size surpasses the recycle size, the log file is rotated. (The default recycle size for the log file is 10,000,000 bytes.) The log file cycles through at most five rotations, and each rotation is saved as log_file_name.[1-5] under the same directory as the original log.
The rotated log file is configured in the File Name field (or by using the logging disk filename command).
Step 8 Enable syslog files to be sent to a host:
a. In the Host Settings section, check the Enable check box. You can configure up to four hosts to which syslog messages can be sent. For more information, see the “Multiple Hosts for System Logging” section.”
b. In the Hostname field, enter a hostname or IP address of the remote syslog host. Specify up to three more remote syslog hosts in the Hostname fields 2 through 4. You must specify at least one hostname if you have enabled system logging to a host.
c. From the Priority drop-down list, choose the severity level of the message that should be sent to the specified remote syslog host. The default priority-code is “warning” (level 4). Each syslog host is capable of receiving a different level of event messages. (See Table 16-6 for a list of priority levels.)
d. In the Port field, specify the destination port on the remote host to which the WAAS device should send the message. The default port number is 514.
e. In the Rate Limit field, specify the number of messages per second that are allowed to be sent to the remote syslog host. To limit bandwidth and other resource consumption, messages to the remote syslog host can be rate limited. If this limit is exceeded, the specified remote syslog host drops the messages. There is no default rate limit, and by default all syslog messages are sent to all of the configured syslog hosts.
To configure system logging from the CLI, you can use the logging global configuration command.
This section contains the following topics:
Priority Levels
Table 16-6 lists the different priority levels of detail to send to the recipient of the syslog messages for a corresponding event.
Multiple Hosts for System Logging
Each syslog host can receive different priority levels of syslog messages. You can configure different syslog hosts with a different syslog message priority code to enable the WAAS device to send varying levels of syslog messages to the four external syslog hosts. For example, a WAAS device can be configured to send messages that have a priority code of “error” (level 3) to the remote syslog host that has an IP address of 10.10.10.1 and messages that have a priority code of “warning” (level 4) to the remote syslog host that has an IP address of 10.10.10.2.
If you want to achieve syslog host redundancy or failover to a different syslog host, you must configure multiple syslog hosts on the WAAS device and assign the same priority code to each configured syslog host (for example, assigning a priority code of “critical” (level 2) to syslog host 1, syslog host 2, and syslog host 3).
In addition to configuring up to four logging hosts, you can also configure the following for multiple syslog hosts:
- A port number different from the default port number, 514, on the WAAS device to send syslog messages to a logging host.
- A rate limit for the syslog messages, which limits the rate at which messages are sent to the remote syslog server (messages per second) to control the amount of bandwidth used by syslog messages.
Configuring Transaction Logging
This section contains the following topics:
Enabling Transaction Logging
To enable transaction logging for TFO flows and video streams, follow these steps:
Step 1 From the WAAS Central Manager GUI navigation pane, choose My WAN > Manage Devices ( or Manage Device Groups ).
Step 2 Click the Edit icon next to the device or device group for which you want to enable system logging. The Device Dashboard window or the Modifying Device Group window appears.
Step 3 From the navigation pane, choose Admin > Transaction Log Settings for TFO transaction logging, or Admin > Video Acceleration Transaction Log Settings for video transaction logging. The Transaction Log Settings window appears. (See Figure 16-15.) The Video Transaction Log Settings window looks the same, but does not include the General Settings area at the top.
Figure 16-15 Transaction Log Settings Window
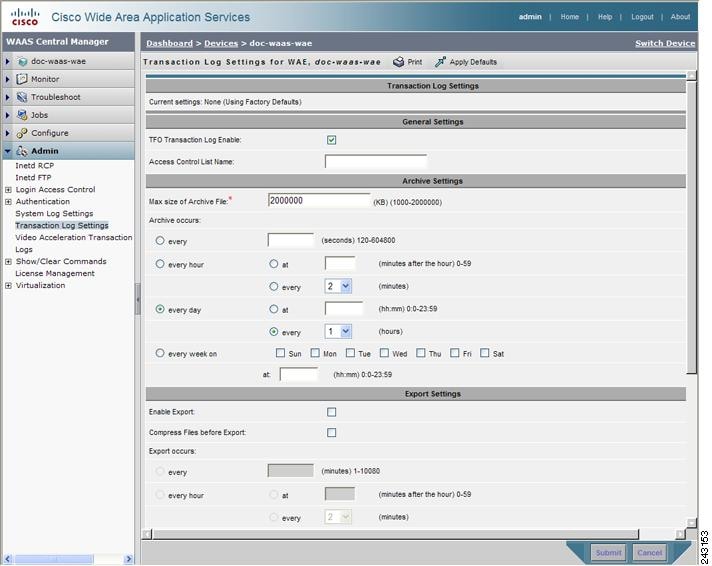
Step 4 Under the General Settings heading, check the TFO Transaction Log Enable check box to enable transaction logging. This check box does not appear for video transaction logging.
The fields on the window become active.
Step 5 In the Access Control List Name field, optionally enter the name of an access control list that you want to use to limit transaction logging. If you specify an access control list, only transactions from hosts that are defined in the access list are logged. This field does not appear for video transaction logging.
Use the ip access-list global configuration command to define an access list.
Step 6 Under the Archive Settings heading, specify values for the following fields:
- Max Size of Archive File—Maximum size (in kilobytes) of the archive file to be maintained on the local disk. This value is the maximum size of the archived file to be maintained on the local disk. The range is 1000 to 2000000. The default is 2000000.
- Archive Occurs Every (interval)—Interval at which the working log data is cleared and moved into the archive log.
Step 7 Configure the fields in the Export Settings section to export the transaction log file to an FTP server.
Table 16-7 describes the fields in the Export Settings section.
A “Click Submit to Save” message appears in red next to the Current Settings line when there are pending changes to be saved after you have applied default or device group settings. You can also revert to the previously configured settings by clicking Reset . The Reset button is visible only when you have applied default or group settings to change the current device settings but have not yet submitted the changes.
If you try to leave this window without saving the modified settings, a warning dialog box prompts you to submit the changes. This dialog box only appears if you are using the Internet Explorer browser.
To enable and configure transaction logging from the CLI, you can use the transaction-logs global configuration command.
Transaction Logs
TFO transaction logs are kept on the local disk in the directory /local1/logs/tfo. Video (Windows media) logs are kept in the directory /local1/logs/wmt/wms-90.
When you enable transaction logging, you can specify the interval at which the working log should be archived by moving the data to an archive log. The archive log files are located on the local disk in the directory /local1/logs/.
Because multiple archive files are saved, the filename includes the time stamp when the file was archived. Because the files can be exported to an FTP/SFTP server, the filename also contains the IP address of this WAAS device.
The archive filenames for TFO transactions use this format:
tfo_IPADDRESS_YYYYMMDD_HHMMSS.txt.
The archive filenames for Windows media transactions use this format:
Viewing the System Message Log
Using the system message log feature of the WAAS Central Manager GUI, you can view information about events that have occurred in your WAAS network. The WAAS Central Manager logs messages from registered devices with a severity level of “warning” or higher.
To view logged information for your WAAS network, follow these steps:
Step 1 From the WAAS Central Manager GUI navigation pane, choose Admin > Logs > System Messages . The System Message Log window appears. (See Figure 16-16.)
Figure 16-16 System Message Log
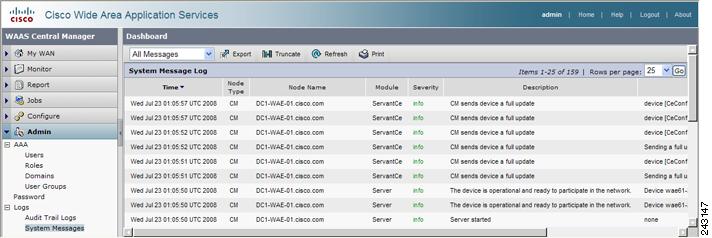
Step 2 From the System Message Log drop-down list, choose one of the following types of messages to display:
Step 3 (Optional) Click a column heading by node type, node name, module, or message text to sort the messages. By default, messages are listed chronologically.
Note If no name is available for a node, the name displayed is “Unavailable.” This might occur if the node has been deleted or has been reregistered with WAAS software.
Step 4 (Optional) Truncate the message log so that not as many messages appear in the table, by completing the following steps:
a. Click the Truncate icon in the taskbar. The Truncate System Message Log window appears.
b. Choose one of the following options:
– Size Truncation —Limits the messages in the log to the number you specify. The log uses a first in, first out process to remove old messages once the log reaches the specified number.
– Date Truncation —Limits the messages in the log to the number of days you specify.
– Message Truncation —Removes messages from the log that match the specified pattern.
c. Click Submit when finished specifying the truncation parameters.
Step 5 If you have many event messages, you may need to view multiple pages to view the activity in which you are interested. Click the forward (>>) and back (<<) buttons to move between pages. Alternatively, click the link for a specific page number to jump to that page.
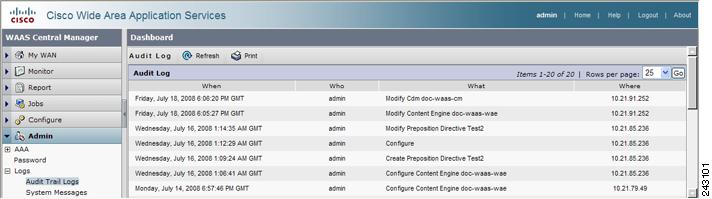
Viewing the Audit Trail Log
The WAAS Central Manager logs user activity in the system. The only activities that are logged are those that change the WAAS network. This feature provides accountability for users’ actions by describing the time and action of the task. Logged activities include the following:
- Creation of WAAS network entities
- Modification and deletion of WAAS network entities
- System configurations
To view audit trail logs, follow these steps:
Step 1 From the WAAS Central Manager GUI navigation pane, choose Admin > Logs > Audit Trail Logs .
The Audit Log window appears. (See Figure 16-17.) All logged transactions in the WAAS Central Manager are listed by date and time, user, actual transaction that was logged, and the IP address of the machine that was used.
Step 2 Choose a number from the Rows drop-down list to determine the number of rows that you want to display.
Viewing the Device Log
To view information about events that have occurred on a specific device in your WAAS network, you can use the system message log feature available in the WAAS Central Manager GUI.
To view events that have occurred on your entire WAAS network, see the “Viewing the System Message Log” section.
To view the logged information for a WAAS device, follow these steps:
Step 1 From the WAAS Central Manager GUI navigation pane, choose My WAN > Manage Devices . The Devices window appears.
Step 2 Click the Edit icon next to the device for which you want to view the system message log details. The Device Dashboard window appears.
Step 3 In the navigation pane, choose Admin > Logs. The System Message Log for Device window appears.
Step 4 Choose the type of messages to be displayed from the System Message Log drop-down list.
You can view the following types of messages in the system log:
Step 5 Click a column heading to arrange the messages chronologically by node type, node name, or module. By default, messages are displayed chronologically.
If no name is available for a node because the node has been deleted or reregistered with the WAAS software, the message displayed is “Unavailable.”
Step 6 If you have many event messages, you may need to use the forward (>>) and back (<<) buttons to move between pages. Alternatively, click the link for a specific page number to move to that particular page.
Enabling the Kernel Debugger
The WAAS Central Manager GUI allows you to enable or disable access to the kernel debugger (kdb). Once enabled, kernel debugger is automatically activated when kernel problems occur.
To enable the kernel debugger, follow these steps:
Step 1 From the WAAS Central Manager GUI navigation pane, choose My WAN > Manage Devices (or Manage Device Groups ).
Step 2 Click the Edit icon next to the WAAS device (or device group) that you want to debug.
Step 3 In the navigation Pane, choose Troubleshoot > Kernel Debugger . The Kernel Debugger window appears.
Step 4 Check the Enable check box to enable the kernel debugger, and click Submit . By default, this option is disabled.
Troubleshooting Using Diagnostic Tests
WAAS includes various troubleshooting tools as described in the following sections:
Troubleshooting Using the GUI
The WAAS Central Manager includes a troubleshooting and diagnostic reporting facility.
To perform diagnostic tests, follow these steps:
Step 1 From the WAAS Central Manager GUI navigation pane, choose My WAN > Manage Devices (or Manage Device Groups ).
Step 2 Click the Edit icon next to the name of the device (or device group) for which you want to perform diagnostic tests.
Step 3 In the navigation pane, choose Troubleshoot > Diagnostics Tests . The Diagnostic Tool window appears.
Step 4 Check the check box next to each diagnostic test that you want to run, or check the top check box to run all tests. The following tests are available:
- Device Operation—Check device status, presence of coredump files or alarms of major or critical severity.
- Basic Configuration—Check device basic network configuration.
- Basic Connectivity—Check device connectivity to configured external devices (DNS, authentication, NTP servers, etc.).
- Physical Interface—Check configuration and operation of device physical interfaces.
- Traffic Optimization—Check TFO configuration and operation.
- WCCP configuration and operation—Check configuration and operation of WCCP traffic interception.
- Inline configuration and operation—Check configuration and operation of inline group interfaces.
- WAFS configuration and operation—Check configuration and operation of WAFS services.
Step 6 View the test results in the lower part of the window. You may have to scroll the window to see all results.
For tests that fail, error messages describe the problem and provide recommended solutions.
You can run the same diagnostic tests again and refresh the results by clicking the Refresh icon in the taskbar.
Troubleshooting Using the CLI
You can use the test EXEC command to perform diagnostic and connectivity tests.
You can use network-level tools to intercept and analyze packets as they pass through your network. Two of these tools are TCPdump and Tethereal, which you can access from the CLI by using the tcpdump and tethereal EXEC commands.
The WAAS device also supports multiple debugging modes, reached with the debug EXEC command. These modes allow you to troubleshoot problems from configuration errors to print spooler problems. We recommend that you use the debug command only at the direction of Cisco TAC.
The output associated with the debug command is written to either the syslog file in /local1/syslog.txt or the debug log associated with the module in the file /local1/errorlog/ module_name -errorlog.current.
The output associated with the debug accelerator name module command for an application accelerator is written to the file name ao-errorlog.current, where name is the accelerator name. The accelerator information manager debug output is written to the file aoim-errorlog.current.
The debug log file associated with a module will be rotated to a backup file when the current file reaches its maximum size. The backup files are named as follows: name -errorlog. # , where # is the backup file number.
For any debug command, system logging must be enabled. The command to enable logging is the logging disk enable global configuration command, which is enabled by default.
If a debug command module uses the syslog for debug output, then the logging disk priority debug global configuration command must be configured (the default is logging disk priority notice ).
If a debug command module uses the debug log for output, then the output can be filtered based on priority level configuration for the four different levels of debug log output, as follows:
- For filtering on critical debug messages only, use the following global configuration command: logging disk priority critical .
- For filtering on critical and error level debug messages, use the following global configuration command: logging disk priority error .
- For filtering on critical, error, and trace debug level debug messages, use the following global configuration command: logging disk priority debug .
- For seeing all debug log messages, which include critical, error, trace and detail messages, use the following global configuration command: logging disk priority detail .
Regardless of the priority level configuration, any syslog messages at the LOG_ERROR or higher priority will be automatically written to the debug log associated with a module.
For more details on these CLI commands, see the Cisco Wide Area Application Services Command Reference .
Using the show and clear Commands from the WAAS Central Manager GUI
To use the WAAS Central Manager GUI show and clear command tool, follow these steps:
Step 1 From the WAAS Central Manager GUI navigation pane, choose My WAN > Manage Devices .
Step 2 Click the Edit icon next to the device for which you want to issue a show or clear command.
Step 3 From navigation pane, choose Admin > Show/Clear Commands and then click either Show Commands or Clear Commands .
Step 4 From the drop-down list, choose a show or clear command.
Step 5 Enter arguments for the command, if any.
Step 6 Click Submit to display the command output.
A window appears, displaying the command output for that device.
You can also use the show EXEC commands from the CLI. For more information, see the Cisco Wide Area Application Services Command Reference .
 Feedback