Release 2.0: Cisco StadiumVision Mobile Reporter Administration Guide
Bias-Free Language
The documentation set for this product strives to use bias-free language. For the purposes of this documentation set, bias-free is defined as language that does not imply discrimination based on age, disability, gender, racial identity, ethnic identity, sexual orientation, socioeconomic status, and intersectionality. Exceptions may be present in the documentation due to language that is hardcoded in the user interfaces of the product software, language used based on RFP documentation, or language that is used by a referenced third-party product. Learn more about how Cisco is using Inclusive Language.
- Updated:
- October 17, 2014
Chapter: System State Reports
System State Reports
First Published: October 17, 2014
The System State Report feature enables easy capture and export of system state data for the Cisco StadiumVision Mobile Reporter server. This information can be sent to a remote support engineer to help troubleshoot any issues that may occur with the system.
Information About System State Reports
Figure 1 shows the System State Report screen.
Figure 1 System State Report Screen
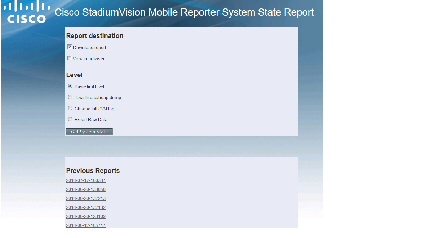
Table 1 describes the options provided on the System State Report screen.
Table 1 System State Report Screen Description
How to Run a System State Report
This section includes the following tasks:
- Running a System State Report
- Viewing the Contents of the Zip File
- Exporting Raw Data From Cisco StadiumVision Mobile Reporter
Running a System State Report
You can run a System State Report when logged into Cisco StadiumVision Mobile Reporter, or from a browser when the reporter GUI is not available.
Using the Cisco StadiumVision Mobile Reporter GUI to Run a System State Report
To use the GUI to run a System State Report, complete the following steps:
Step 1![]() Log into Cisco StadiumVision Mobile Reporter as admin.
Log into Cisco StadiumVision Mobile Reporter as admin.
Step 2![]() From the System Tools menu, click System
From the System Tools menu, click System![]() State Report.
State Report.
Step 3![]() Under Report Destination, select one or both types, Download report and/or View in browser.
Under Report Destination, select one or both types, Download report and/or View in browser.
Step 4![]() Under Level, select the type of report that you want to run.
Under Level, select the type of report that you want to run.
Step 5![]() Click Get System
Click Get System![]() State.
State.
A status bar is displayed while the report is generating.
Running a System State Report When the Cisco StadiumVision Mobile Reporter GUI is Not Available
To run a System State Report when the GUI is not available, complete the following steps:
Step 1![]() Log into the TUI as installer.
Log into the TUI as installer.
Step 2![]() From the TUI, shut down the reporter by going to Services Control > StadiumVision Mobile Reporter Services.
From the TUI, shut down the reporter by going to Services Control > StadiumVision Mobile Reporter Services.
Step 5![]() From your browser, navigate to the system state report directly with the following URL, where reporter-ip-address is replaced with the IP address of your server:
From your browser, navigate to the system state report directly with the following URL, where reporter-ip-address is replaced with the IP address of your server:
https:// reporter-ip- address /cgi-bin/snap.cgi
Viewing the Contents of the Zip File
After the extract report runs, a resulting page will display Report is ready. If you selected View in browser, a link will appear to view the report in the browser. Depending on your browser and its settings, if you selected Download Report, you may get a dialog box to save the report on your local machine. If so, save it as desired.
If the automatic download does not work, you can click on the link after the word Download to again download the file. This is a compressed file containing multiple parts to the report. The file has the extension.zip, indicating a compressed folder. The heap dump is a compressed report file which you can save to your local drive and forward to support personnel for troubleshooting, packaged just the same way that the Basic Level report is.
Once you have downloaded the report file to your PC, you will have a.zip file. You can email it to Cisco support as is.

Note![]() The format of the file name is the date and time that the report was run.
The format of the file name is the date and time that the report was run.
To view the contents of this file, complete the following steps:
Step 1![]() Double-click on the file to open the.zip file archive manager.
Double-click on the file to open the.zip file archive manager.
The contents of this file depends on the file compression software program installed on your PC. For example purposes, these instructions will assume you have WinZip on a PC.
Step 2![]() Click Extract and extract ALL the contents of the archive to a new directory on your local drive.
Click Extract and extract ALL the contents of the archive to a new directory on your local drive.
Step 3![]() Using Windows Explorer, navigate to the extracted directory you just created. In the resulting folder is a file named index.html. Double-click that file and it will open in your internet browser.
Using Windows Explorer, navigate to the extracted directory you just created. In the resulting folder is a file named index.html. Double-click that file and it will open in your internet browser.
Step 4![]() You can now review the rest of the report by clicking on links available from this page.
You can now review the rest of the report by clicking on links available from this page.
Step 5![]() In the case of the heap dump and log file reports, there is no index.html. Simply navigate down the levels of folders until you see the log files of interest.
In the case of the heap dump and log file reports, there is no index.html. Simply navigate down the levels of folders until you see the log files of interest.
Exporting Raw Data From Cisco StadiumVision Mobile Reporter
To export raw data, complete the following steps:
Step 1![]() From the System State Report screen, select Export Raw Data.
From the System State Report screen, select Export Raw Data.
Step 2![]() Click Get System
Click Get System![]() State.
State.
Step 3![]() In the Start Date and End Date fields on the Raw Data Export screen, type the date and time range for the period from which you want data, as shown in Figure 2.
In the Start Date and End Date fields on the Raw Data Export screen, type the date and time range for the period from which you want data, as shown in Figure 2.
The default value is based on the last event times in the event schedule.
Figure 2 Cisco StadiumVision Mobile Reporter Raw Data Export Dialog
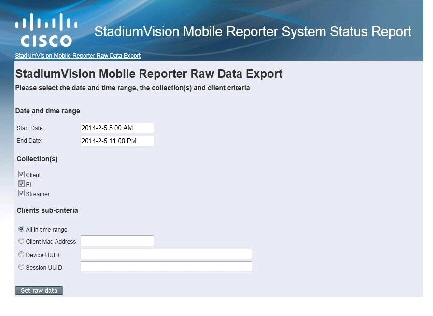
Step 4![]() Under Collections, select one or more of the checkboxes to specify where you want to get the data from:
Under Collections, select one or more of the checkboxes to specify where you want to get the data from:
- Client —Data from mobile clients using the Cisco StadiumVision Mobile SDK.
- PI —Data from Cisco Prime Infrastructure (if using the Cisco StadiumVision Mobile-PI integration capability).
- Streamer —Data sent from the Cisco StadiumVision Mobile Streamer to the Cisco StadiumVision Mobile Reporter.
Step 5![]() (Client data only) Under Clients sub-criteria, specify additional options to further refine the data that is returned.
(Client data only) Under Clients sub-criteria, specify additional options to further refine the data that is returned.
You can select either a specific client MAC address, or a device UUID or a session UUID. This data might be known to you from studying the report ‘J: Client Sessions’. You can only specify one type of sub-criteria, and only one specific mac address or UUID.
Note![]() For PI and Streamer data collections, All in time range is automatically selected and is all that applies.
For PI and Streamer data collections, All in time range is automatically selected and is all that applies.
The report generates as a.csv file inside of a.zip archive file.
 Feedback