Deploy Cisco Intersight and Cisco UCS Integrated Infrastructure with Splunk Enterprise
Available Languages
Bias-Free Language
The documentation set for this product strives to use bias-free language. For the purposes of this documentation set, bias-free is defined as language that does not imply discrimination based on age, disability, gender, racial identity, ethnic identity, sexual orientation, socioeconomic status, and intersectionality. Exceptions may be present in the documentation due to language that is hardcoded in the user interfaces of the product software, language used based on RFP documentation, or language that is used by a referenced third-party product. Learn more about how Cisco is using Inclusive Language.
Splunk software reliably collects and indexes machine data, from a single source to tens of thousands of sources, all in real time. Organizations typically start with Splunk to solve a specific problem and then expand from there to address a broad range of use cases, such as application troubleshooting, IT infrastructure monitoring, security, business analytics, Internet of Things (IoT), and many others. As operational analytics become increasingly critical to day-to-day decision making and Splunk deployments expand to terabytes of data, a high-performance, highly scalable infrastructure is critical to helping ensure rapid and predictable delivery of insights. The Cisco Intersight™ and Cisco Unified Computing System™ (Cisco UCS®) platforms’ ability to expand to thousands of servers allows Splunk deployments to scale horizontally while continuously delivering exceptional performance.
This document describes the architecture and deployment procedures for Splunk Enterprise on a distributed high-performance reference architecture. The configuration consists of three Cisco UCS C240 M6 Rack Servers as indexers, three Cisco C220 M6 Rack Servers as search heads, and three Cisco C220 M6 Rack Servers for performing administrative functions.
This section summarizes the Splunk and Cisco® solution.
This whitepaper describes the architecture and high-level steps for deploying Splunk Enterprise using sixth-generation Cisco UCS rack servers. The solution is designed with three Cisco UCS C240 M6 rack servers as indexers, three Cisco UCS C220 M6 rack servers as search heads, and three Cisco UCS C220 M6 rack servers to perform administrative function. This architecture is based on the Cisco UCS Integrated Infrastructure for Big Data with Splunk - https://www.cisco.com/c/dam/en/us/td/docs/unified_computing/ucs/UCS_CVDs/Cisco_UCS_Integrated_Infrastructure_for_Big_Data_with_Splunk_Enterprise.pdf.
Note: In this whitepaper we have chosen a single-site clustered distributed architecture for Splunk Enterprise with minimal required nodes to showcase a distributed architecture. You can choose to scale inderxers and search heads as per your requirements. For Splunk indexers to search head ratio, please visit: https://docs.splunk.com/Documentation/Splunk/8.2.6/
Capacity/Referencehardware - Ratio_of_indexers_to_search_heads.
The solution shows the infrastructure provisioning for sixth-generation Cisco UCS rack servers using the software-as-a-service (SaaS) Cisco Intersight platform and the Splunk Enterprise clustered distributed deployment model on Cisco UCS C-Series Rack Servers. Details about data ingestion rates and Splunk Enterprise best practices are beyond the scope of this solution.
The proposed solution is simple to install, scalable, and high performing. The configuration uses the following components:
● Cisco Unified Computing System
◦ Cisco UCS 6454 Fabric Interconnects
◦ Cisco UCS C240 M6 Rack Servers with Cisco UCS Virtual Interface Card (VIC) 1457
◦ Cisco UCS C220 M6 Rack Servers with Cisco UCS VIC 1457
● Splunk Enterprise Release 8.2.6
● Red Hat Enterprise Linux (RHEL) Release 8.5
The solution includes the following features:
● Cisco UCS infrastructure for a medium to large scale-out Splunk Enterprise deployment
● Design and implementation of Splunk Enterprise single-site distributed cluster for highly available Indexers and search heads
● Simplified infrastructure management with the Cisco Intersight platform
● Architectural scalability of hardware and software components
The Cisco UCS solution for Splunk Enterprise is based on Cisco UCS Integrated Infrastructure for Big Data and Analytics, a highly scalable architecture designed to meet a variety of scale-out application demands with seamless data integration and management integration capabilities built using the components described in this section.
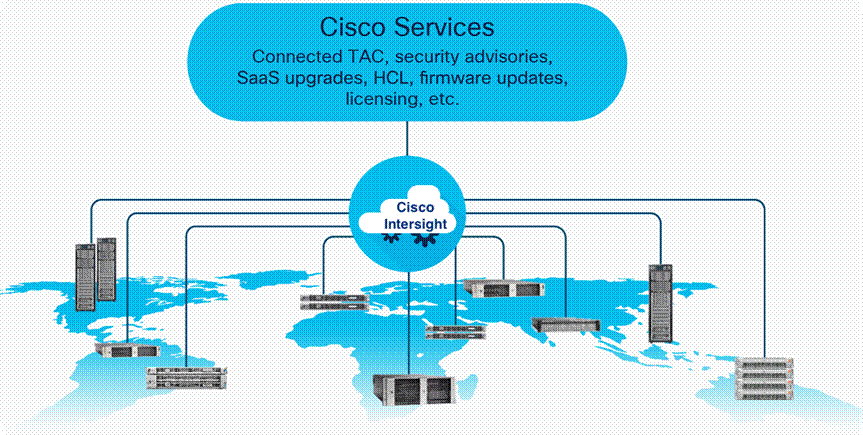
The Cisco Intersight platform is a SaaS infrastructure lifecycle management platform that delivers simplified configuration, deployment, maintenance, and support. With the Cisco Intersight platform, customers get all the benefits of SaaS delivery and the full lifecycle management of distributed servers connected to Cisco Intersight and third-party storage systems such as Pure Storage across data centers, remote sites, branch offices, and edge environments (Figure 1).
The Cisco Intersight platform is designed to be modular, so customers can adopt services based on their individual requirements. The platform significantly simplifies IT operations by bridging applications with infrastructure, providing visibility and management from bare-metal servers and hypervisors to serverless applications, thereby reducing costs and mitigating risk. This unified SaaS platform uses a unified open API that natively integrates with third-party platforms and tools.
Cisco Intersight Overview
The main benefits of Cisco Intersight infrastructure services are summarized here:
● Simplify daily operations by automating many daily manual tasks.
● Combine the convenience of a SaaS platform with the capability to connect from anywhere and manage infrastructure through a browser or mobile app.
● Stay ahead of problems and accelerate trouble resolution through advanced support capabilities.
● Gain global visibility of infrastructure health and status along with advanced management and support capabilities.
● Upgrade to add workload optimization and Kubernetes services when needed.
Cisco Intersight Virtual Appliance and Private Virtual Appliance
In addition to the SaaS deployment model running on Intersight.com, on-premises options can be purchased separately. The Cisco Intersight Virtual Appliance and Cisco Intersight Private Virtual Appliance are available for organizations that have additional data locality or security requirements for managing systems. The Cisco Intersight Virtual Appliance delivers the management features of the Cisco Intersight platform in an easy-to-deploy VMware or Microsoft Hyper-V Server virtual machine that allows you to control the system details that leave your premises. The Cisco Intersight Private Virtual Appliance is provided in a form factor specifically designed for users who operate in disconnected (air gap) environments. The Private Virtual Appliance requires no connection to public networks or back to Cisco to operate. At this time, Cisco Intersight managed mode is a tech-preview feature, and the configuration is available only through the Cisco Intersight SaaS platform.
Cisco Unified Computing System
Cisco UCS is an integrated computing infrastructure with intent-based management to automate and accelerate deployment of all your applications, including virtualization and cloud computing, scale-out and bare-metal workloads, and in-memory analytics, as well as edge computing that supports remote and branch locations and massive amounts of IoT data. This section provides an overview of the main components of Cisco UCS: unified fabric, unified management, and unified computing resources.
Cisco UCS Manager integrates blade, rack, and storage servers into a single self-aware, self-integrating, unified system. It quickly and accurately configures computing, network, storage, and storage-access resources to increase compliance and reduce the chance of errors that can cause downtime. Its role- and policy-based approach helps organizations more easily align policies and configurations with workloads. It automates system configuration through a “create once, deploy many” approach.
The Cisco Intersight SaaS platform provides cloud-based automation and management with a consistent interface for all of your Cisco UCS and Cisco HyperFlex™ systems regardless of their location. Cisco Intersight software accesses Cisco UCS and Cisco HyperFlex systems through a Secure Sockets Layer (SSL) connection from the cloud. Cisco Intersight supports complete software lifecycle orchestration and management. Through a workflow-based approach, you can manage the allocation of the physical and virtual infrastructure needed to deploy applications, including servers, networking resources, and third-party storage.
Delivering performance, versatility, and density in servers designed without compromise, Cisco UCS blade, rack, multinode, and storage servers can power every workload, including workloads for the following:
● Agile development environments requiring bare-metal servers
● Artificial intelligence and machine learning applications
● Big data
● Content delivery
● Cloud computing environments delivering virtual machines and bare-metal servers as a service
● Database management systems
● High-frequency trading
● Hyperconverged applications (Cisco HyperFlex nodes are based on Cisco UCS servers)
● Gaming applications
● Internet infrastructure applications
● Mission-critical enterprise applications
● Mobile application back-end services
● Virtualized environments
Cisco UCS is designed so that it is logically a single very large blade server chassis in which every server in our product line can connect and be managed as if it were part of the same single, unified system. In this sense, Cisco UCS is form-factor neutral, giving you more flexibility to choose the servers that best meet your needs without the penalty of having to use a different management approach for each type of server.
A pair of Cisco UCS fabric interconnects forms the single point of connectivity for a Cisco UCS domain. Cisco UCS rack servers can be connected directly to Cisco UCS fabric interconnects through up to four 10- or 25-Gbps connections.
The Cisco Unified Computing System is designed to deliver these benefits:
● Reduced total cost of ownership (TCO) and increased business agility
● Increased IT staff productivity through just-in-time provisioning and mobility support
● A cohesive, integrated system that unifies the technology in the data center
● Industry standards supported by a partner ecosystem of industry leaders
Cisco UCS 6400 Series Fabric Interconnects
Cisco UCS 6400 Series Fabric Interconnects provide high-bandwidth, low-latency connectivity for servers, with integrated, unified management provided for all connected devices by Cisco Intersight managed mode.
The Cisco UCS 6400 Series is a core part of Cisco UCS, providing both network connectivity and management capabilities for the system. The Cisco UCS 6454 Fabric Interconnect, with 54 ports (Figure 2), offers line-rate, low-latency, lossless 10, 25, 40, and 100 Gigabit Ethernet, Fibre Channel over Ethernet (FCoE), and Fibre Channel functions.
Deployed in redundant pairs, Cisco fabric interconnects offer the full active-active redundancy, performance, and exceptional scalability needed to support the large number of nodes that are typical in clusters serving big data applications. Cisco Intersight managed mode enables rapid and consistent server configuration using service profiles, automating ongoing system maintenance activities such as firmware updates across the entire cluster as a single operation. Cisco Intersight managed mode also offers advanced monitoring with options to raise alarms and send notifications about the health of the entire cluster.
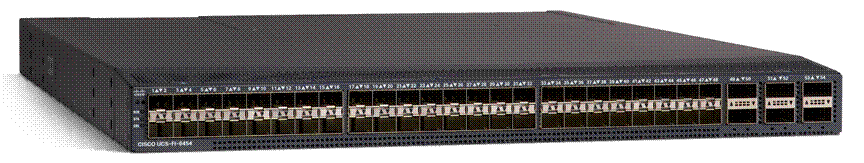
Cisco UCS 6454 54-port fabric interconnect
Cisco UCS C-Series Rack Servers
The Cisco UCS C220 M6 Rack Server (high-density small-form-factor [SFF] disk-drive model, Figure 3) and Cisco UCS C240 M6 Rack Server (high-density SFF disk-drive model, Figure 4) are enterprise-class servers that support a wide range of computing, I/O, and storage-capacity demands in compact designs. Cisco UCS C-Series Rack Servers are based on the Third-Generation (3rd Gen) Intel® Xeon® Scalable processors product family with more than 40 percent more cores per socket and 33 percent more memory, delivering up to 40 percent more performance and efficiency gains over the previous generation of servers. The performance-optimized option supports 26 SFF disk drives. The Cisco UCS VIC 1457 for the M6 generation of Cisco UCS C-Series are optimized for high-bandwidth and low-latency cluster connectivity.

Cisco UCS C220 M6 Rack Server

Cisco UCS Virtual Interface Cards (VICs)
Cisco UCS Virtual Interface Cards (VICs), unique to Cisco, incorporate next-generation converged network adapter (CNA) technology from Cisco, and offer quad 10/25-Gbps ports designed for use with Cisco UCS C-Series Rack-Mount Servers. Optimized for virtualized networking, these cards deliver high performance and bandwidth utilization and support up to 256 virtual devices. The Cisco UCS Virtual Interface Card (VIC) 1457 is a dual-port, Enhanced Small Form-Factor Pluggable (SFP+), 10/25 Gigabit Ethernet and Fiber Channel over Ethernet (FCoE)-capable, PCI Express (PCIe) modular LAN on motherboard (mLOM) adapter.
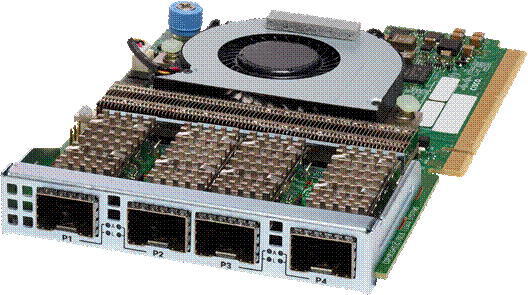
Cisco UCS VIC 1457
All your IT applications, systems, and technology infrastructure generate data every millisecond of every day. This machine data is one of the fastest growing, most complex components of big data. It is also one of the most valuable, containing a definitive record of user transactions, customer behavior, sensor activity, machine behavior, security threats, fraudulent activity, and more.
Splunk Enterprise provides a holistic way to organize and extract real-time insights from massive amounts of machine data from nearly any source. This information includes data from websites, business applications, social media platforms, application servers, hypervisors, sensors, traditional databases, and open-source data stores. Splunk Enterprise scales to collect and index tens of terabytes of data per day, across infrastructure in multiple locations, multiple data centers, and hybrid clouds.
Splunk Enterprise is an industry-leading platform for machine data, providing organizations with a fast, easy, and secure way to analyze the massive streams of machine data generated by their IT systems and technical infrastructure, whether that data is physical, virtual, or in the cloud. This focus on machine data makes Splunk Enterprise excellent for promoting the capture and analysis of data related to IT operations, application analytics, security, business analytics, and IoT. It offers the following advantages:
● End-to-end IT operations visibility: Splunk Enterprise ties together application, user, and infrastructure information to deliver comprehensive visibility.
● Capability to collect and index any machine data from almost any source, format, or location in real time: Splunk Enterprise can support data streaming from packaged and custom applications, application servers, web servers, databases, networks, virtual machines, telecom equipment, operating systems, sensors, and much more—without requiring custom parsers, adapters, or a back-end database. After the data is indexed, organizations can use Splunk to correlate complex events that span diverse data sources and obtain insights by using its powerful search, analysis, and visualization capabilities.
● The flexibility to run Splunk Enterprise software anywhere: Organizations can capture data from the data center, in the cloud, or at the edge from endpoints.
● Comprehensive management functions: Splunk Enterprise is a productivity-enhancing, easy-to-use operational intelligence solution. It addresses the full continuum of IT operational and management processes—from troubleshooting and analysis to proactive monitoring to capacity management. Because Splunk addresses the entire IT operations management lifecycle, organizations can achieve lower mean time to repair (MTTR) by finding and resolving issues in minutes instead of hours. They can also reduce costs using tool consolidation and take advantage of vastly improved operational visibility to make better decisions. And because Splunk is easy to use, a wide range of different IT teams and business analysts with different levels of training can make the most of its capabilities, making it easy to apply Splunk to many other types of analytics use cases.
Cisco’s solution for deploying Splunk Enterprise on Cisco UCS C-Series servers with the Cisco Intersight platform delivers a cloud-managed solution on the latest Cisco UCS hardware. This design allows storage flexibility with a variety of drive options (Non-Volatile Memory Express [NVMe], solid-state disk [SSD], and hard-disk drive [HDD]), supporting a wide range of hot-, warm-, cold-, and archive-tier requirements for Splunk. The Cisco Intersight cloud-management platform is used to configure and manage the infrastructure. In this solution we have configured NVMes for hot/warm, SSDs for cold and archive tier is not covered.
This section discusses the solution requirements and design details.
The Splunk solution on Cisco UCS servers and Cisco Intersight platform meets the following general design requirements:
● Resilient design across all layers of the infrastructure with no single point of failure
● Scalable design with the flexibility to add computing capacity, storage, and network bandwidth as needed
● Modular design that can be replicated to expand and grow as the needs of the business grow
● Flexible design that can support a variety of models with various components with ease
● Simplified design with the capability to integrate with external automation tools
● Cloud-enabled design that can be configured, managed, and orchestrated from the cloud using the GUI or APIs
The solution described in this document focuses on configuring a single-site distributed clustered deployment with search head clustering (SHC); see Figure 5. For more information about the various types of Splunk validated architectures, see https://www.splunk.com/pdfs/technical-briefs/splunk-validated-architectures.pdf.
This topology introduces indexer clustering in conjunction with an appropriately configured data replication policy. This configuration provides high availability of data in the event of indexer peer node failure. Similarly, SHC adds horizontal scalability and removes the single point of failure from the search tier. A minimum of three search heads are required to implement SHC.
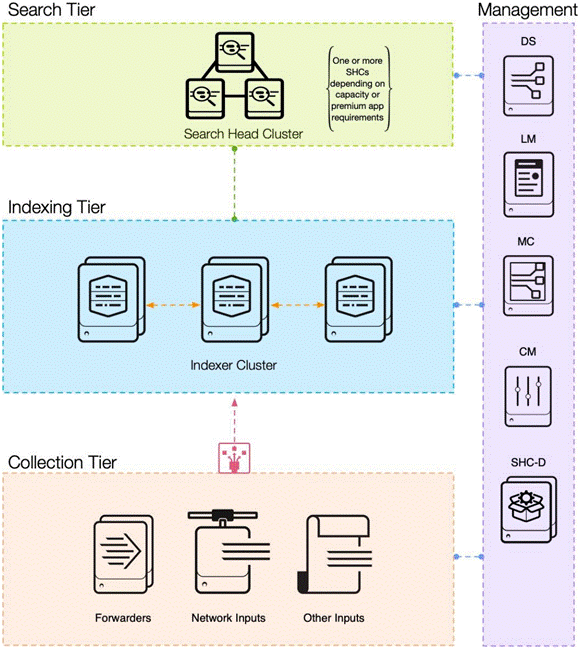
Splunk Enterprise single-site clustered distributed architecture
The Cisco UCS C-Series server connects to each Cisco UCS 6454 Fabric Interconnect using two Cisco VIC ports per server for fabric interconnect A and fabric interconnect B as shown in Figure 6.
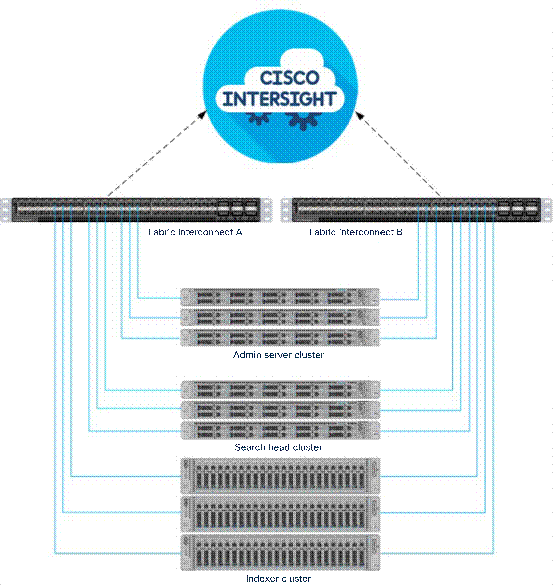
Physical topology
Tables 1 and 2 summarize the details of the solution components.
Table 1. Topology component options
| Splunk components |
Server type |
CPU options |
Memory options |
Storage |
Notes |
| Indexers |
Recommended: Cisco UCS C240 M6 SX |
5318Y
|
256 GB
|
Boot: Two 240 GB M.2 (Cisco Boot-Optimized M.2 RAID Controller) Hot/warm: NVMe Cold: SATA SSD |
RAID 1 – Boot RAID 1 – Hot/warm data RAID 5 – Cold data |
| Alternate: Cisco UCS C220 M6 SX Cisco UCS X210C |
|||||
| Search heads |
Recommended: Cisco UCS C220 M6 SX |
5318Y |
256 GB 128 GB
|
Boot: Two 240 GB M.2 Data: Two 480 GB SSDs |
RAID 1 – Boot RAID 1 – Data
|
| Alternate: Cisco UCS X210C |
|||||
| Management servers |
● Recommended: Cisco UCS C220 M6 SX
● Cisco UCS X210C
|
4310 |
256 GB 128 GB
|
Boot: Two 240 GB M.2 Data: Two 480 GB SSDs |
RAID 1 – Boot RAID 1 – Data
|
| Alternate: Cisco UCS X210C |
Table 2. Topology performance details
| Configuration |
Performance |
| Search heads |
Three Cisco UCS C220 M6 Rack Servers, each with:
● Two Intel Xeon processor scalable family 5318Y CPUs (48 cores) at 2.1 GHz
● Eight 32 GB 3200 MHz (256 GB) Memory
● Two 240 GB M.2 SSDs for OS with Cisco Boot-Optimized M.2 RAID Controller
● Two 480 GB SSDs configured as RAID1
● Cisco 12 Gbps RAID Controller with 4 GB Flash-Backed Write Cache (FBWC)
● Cisco UCS VIC 1457
|
| Management servers6
|
● Three Cisco UCS C220 M6 Rack Servers, each with:
● Two Intel Xeon processor scalable family 4310 CPUs (12 cores) at 2.1 GHz
● Eight 32 GB 3200 MHz (256 GB) Memory
● Two 240 GB M.2 SSDs for OS with Cisco Boot-Optimized M.2 RAID Controller
● Two 480 GB larger SSDs (for data) configured as RAID1
● Cisco 12 Gbps RAID Controller with 4 GB FBWC
● Cisco UCS VIC 1457
|
| Indexers2,3 |
Eight Cisco UCS C240 M6 Rack Servers, each with:
● Two Intel Xeon processor scalable family 5318Y CPUs (48 cores) at 2.1 GHz
● Eight 32 GB 3200 MHz (256 GB) Memory
● Two 240 GB M.2 SSDs for OS with Cisco Boot-Optimized M.2 RAID Controller
● Cisco 12 Gbps RAID Controller with 4 GB FBWC
● Cisco UCS VIC 1457
● One 3.2 TB NVMe for hot/warm data
● Twentyfive 960 GB SSDs configured as RAID5 for cold data
|
| Storage capacity per indexer4 |
Hot/warm: 3.2 TB (RAID 1) Cold: 23 TB (RAID 5) |
| Total storage
|
Hot/warm: 25.6 TB Cold: 184 TB |
| Sample retention5 (IT Operations Analytics [ITOA]) per indexer |
Hot/warm: 20 days Cold: 5 months |
| Sample retention5 (enterprise security) per indexer |
Hot/warm: 60 days Cold: 15 months |
Notes:
1. Other storage options:
◦ Larger SSDs may be used instead of the 960 GB SSDs.
◦ A combination of SSD for hot/warm data and HDDs for cold data are supported. For example, six 1.6 TB or larger SSDs configured as RAID5 for hot/warm data and twenty 1.8 TB, or 2.4 TB 10,000 rpm SAS HDDs configured as RAID10 for cold data (or) ten 800 GB SSD EP configured as RAID5 for hot/warm data and sixteen 1.9 SSD EV configured as RAID5 for cold data. When HDDs are used in the cold tier, it is important to configure them as RAID10 or more HDDs are recommended in this tier.
2. The indexers can be in standalone or distributed mode. In the distributed architecture, you can configure both the indexers and search heads as clustered or non-clustered. You can scale by adding search heads and indexers to the cluster.
3. The suggested maximum indexing capacities per indexer node are up to 300 GB per day for IT operational analytics, up to 200 GB per day for IT Services Intelligence (ITSI), and up to 100 GB per day for enterprise security.
4. The total storage capacity per server is the unformatted available storage space based on the parity used for the RAID group. The actual available storage space varies depending on the file system used.
5. Sample retention durations were calculated with the assumption of 50% compression of original data without any data replication. It is recommendation to set Replication Factor (RF) to 2 (to tolerate at least 1 node failure) or more and Search Factor (SF) to 2 in both HOT/WARM and COLD tiers. For more information on setting RF see sub section – “Provision the Indexer Cluster Master on admin1” under the section “Configure Splunk Indexer Volumes”.
6. Management servers include all the administration roles of Splunk such as cluster master, search head deployer, deployment server, monitoring console, and license master as shown in Figure 6.
Preparing for Splunk deployment
This section discusses how to set up the environment for deploying Splunk.
Set up Cisco UCS fabric interconnect for Cisco Intersight managed mode
Refer to the following link for more information about configuring Cisco Intersight managed mode: https://www.cisco.com/c/en/us/td/docs/unified_computing/Intersight/b_Intersight_Managed_Mode_Configuration_Guide.html.
Configure the initial fabric interconnect
You can implement the initial configuration for a fabric interconnect from the serial console when the fabric interconnect boots for the first time. You can do this either from the factory installed configuration or after the existing configuration is cleared. The configuration wizard enables you to select the management mode and other parameters, such as the administrative subnet, gateway, and Domain Name System (DNS) IP addresses for the fabric interconnect. For the management mode, you can choose the fabric interconnect through the Cisco Intersight platform.
1. Open the serial console.
2. Choose Cisco Intersight as the management mode.
3. Select Yes to continue.
4. Refer to the following link for more information about configuring the fabric interconnects: https://www.cisco.com/c/en/us/td/docs/unified_computing/Intersight/b_Intersight_Managed_Mode_Configuration_Guide/b_intersight_managed_mode_guide_chapter_00.html.
Claim a Cisco UCS fabric interconnect in the Cisco Intersight platform
After setting up the Cisco UCS fabric interconnect for Cisco Intersight managed mode, you next claim the fabric interconnects on a new or an existing Cisco Intersight account.
1. Log in to the fabric interconnect through your browser to get the device ID and claim code. You can see the serial numbers of both fabric interconnects on the device console tabs.
2. Refer to the following link for more information about claiming a device: https://intersight.com/help/saas/getting_started/claim_targets#minimum_permissions_for_targets.
3. After you have successfully added a Cisco UCS fabric interconnect to the Cisco Intersight platform, you complete all future configuration steps in the Cisco Intersight portal.
The Cisco Intersight platform uses a subscription-based license with multiple tiers (the setup described here uses the Premier tier). Customers can purchase a subscription duration of one, three, or five years and choose the required number of Cisco UCS servers for the selected subscription duration.
For more information about the features provided in the various licensing tiers, refer to https://intersight.com/help/getting_started#licensing_requirements.
Create a Cisco UCS domain profile
A Cisco UCS domain profile configures a fabric interconnect pair through reusable policies, allows configuration of ports and port channels, and configures the VLANs to be used in the network. It defines the characteristics and configures the ports of the fabric interconnects. One Cisco UCS domain profile can be assigned to one fabric interconnect domain. The Cisco Intersight platform supports the attachment of one port policy per Cisco UCS domain profile.
These are some of the characteristics of a Cisco UCS domain profile in the Splunk environment:
● A single domain profile is created for the pair of Cisco UCS fabric interconnects.
● Unique port policies are defined for the two fabric interconnects.
● The VLAN configuration policy is common to the fabric interconnect pair because both fabric interconnects are configured for the same set of VLANs.
● Network Time Protocol (NTP), multicast policy, network connectivity, and system quality-of-service (QoS) policies are common to the fabric interconnect pair.
After the Cisco UCS domain profile has been successfully created and deployed, the domain policies, including the port policies, are pushed to the Cisco UCS fabric interconnects. Pools (MAC address pool, universal unique ID [UUID] pool, IP address pool, etc.) are required for the servers to help provide unique identification. For more information about configuring the pools, refer to the Cisco Intersight managed mode configuration guide.
Create a server profile template
A server profile template enables resource management by simplifying policy alignment and server configuration. A server profile template is created using the server profile template wizard. The server profile template wizard groups the server policies into the following four categories to provide a quick summary view of the policies that are attached to a profile:
● Computing policies: BIOS, boot-order, and virtual media policies
◦ BIOS policy is created to specify various server parameters in accordance with Splunk best practices.
◦ Boot-order policy defines the local disk or virtual media (keyboard, video, and mouse [KVM] mapper DVD).
◦ Policy specifies the UUID pool.
● Management policies: Policies for IMC access, local user, syslog, and virtual KVM
◦ IMC access policy defines the management IP address pool for KVM access.
◦ Local user policy enables KVM-based user access.
◦ Syslog policy defines the logging level (minimum severity) to report for a log file collected from an endpoint.
● Storage policies: Policies for creating RAID groups, drive groups, and virtual drives for RAID and M.2 controllers
● Network policies: Adapter configuration, LAN connectivity, and network connectivity policies
◦ The LAN connectivity policy requires you to create Ethernet network group policy, Ethernet adapter policy, Ethernet network control policy, and Ethernet QoS policy.
◦ LAN connectivity policy is used to create virtual network interface cards (vNICs).
Figure 8 shows the template settings for the server policies configured for the Splunk deployment.
Derive and deploy server profiles from the Cisco Intersight server profile template
The Cisco Intersight server profile allows server configurations to be deployed directly on computing nodes based on polices defined in the server profile template. After a server profile template has been successfully created, server profiles can be derived from the template and associated with the servers.
After successful deployment of the server profile, the Cisco UCS M6 nodes are configured with the parameters defined in the server profile.
After you have configured the server, the next step is to install the operating system on all servers (the setup described here uses RHEL 8.5). To install the operating system, follow these steps:
1. Launch the KVM console on the desired server by choosing Operate > Server > Servers 1 > Action > Launch vKVM. Select KVM Console to open the KVM.
2. Select Virtual Media on the KVM. Enable the vKVM-Mapped vDVD and map the RHEL 8.5 ISO image.
3. Boot the server with the mapped ISO image and begin the installation process.
For detailed steps for installing RHEL 8, see https://access.redhat.com/documentation/en-us/red_hat_enterprise_linux/8/html-single/performing_a_standard_rhel_installation/index#installing-rhel-on-adm64-intel-64-and-64-bit-arm.
The servers are divided by Splunk tier: indexing tier, search tier, and admin tier. In this deployment, three servers per tier are used, and they form a cluster as shown in Table 3.
Table 3. Splunk server information
| Splunk tier |
Server profile name |
Server name and role |
| Admin tier |
Splunk-1 |
Admin1: Cluster master |
| Splunk-2 |
Admin2: Monitoring console and deployment server |
|
| Splunk-3 |
Admin3: Search head deployer and license master |
|
| Search tier |
Splunk-4 |
SearchHead1: Search head |
| Splunk-5 |
SearchHead2: Search head |
|
| Splunk-6 |
SearchHead3: Search head |
|
| Indexing tier
|
Splunk-7 |
Indexer1: Indexer |
| Splunk-8 |
Indexer2: Indexer |
|
| Splunk-9 |
Indexer3: Indexer |
Perform post-OS installation configuration
After the OS is installed, you need to perform some additional steps before you install Splunk. You need to configure the clustershell (clush) utility, enable syslog, set up OS limits (ulimit) and TCP tunings, disable transparent huge pages (THP), etc.
To implement these steps, you need to identify one of the management servers to act as the master node and then use the clush utility from that server to push these settings in the entire setup. The installation described here uses admin1 for this purpose.
Modify the /etc/hosts file on the admin server (here, admin1) as described here. Subsequently, you will copy the /etc/hosts file from the admin server (here, admin1) to all the other nodes (that is, admin 2 and 3, searchhead1 through 3, and indexer 1 through 3).
1. Log in to the admin server (admin1):
ssh admin1
Note: You can also use the IP address to start this SSH session.
2. Populate the host file with IP addresses and corresponding host names. You will later copy this file to the other nodes. On the admin server (admin1), enter the following:
vi /etc/hosts
3. Paste the following contents into the /etc/hosts file:
127.0.0.1 localhost localhost.localdomain localhost4
::1 localhost localhost.localdomain localhost6
10.29.150.90 admin1
10.29.150.91 admin2
10.29.150.92 admin3
10.29.150.93 searchhead1
10.29.150.94 searchhead2
10.29.150.95 searchhead3
10.29.150.96 indexer1
10.29.150.97 indexer2
10.29.150.98 indexer3
To manage all the cluster nodes from the admin server, set up password-free login. This setup helps in automating common tasks with clush, a clusterwide parallel shell command utility, and shell scripts without having to use passwords.
After RHEL is installed across all the nodes in the cluster, follow these steps to enable password-less login across all the nodes:
1. Log in to the admin server (admin1): for example, enter the following:
ssh 10.29.150.90
2. Run the ssh-keygen command to create both public and private keys on the admin server.
3. Run the following script from the admin server to copy the public key id_rsa.pub to all the nodes of the cluster. The ssh-copy-id command appends the keys to the remote host’s .ssh/authorized_keys entry.
for host in admin1 admin2 admin3 indexer1 indexer2 indexer3 searchhead1 searchhead2 searchhead3;
do
echo -n "$host -> "; ssh-copy-id -i ~/.ssh/id_rsa.pub $host;
done
4. Enter Yes at the prompt “Are you sure you want to continue connecting (yes/no)?” Then enter the password of the remote host.
Note: You need to copy the admin server’s /etc/hosts file to all 8 other servers by using the clush commands after it is installed. See the next section.
Configure the clustershell (clush) utility
The clustershell, or clush, utility is a clusterwide shell for running commands on several hosts in parallel.
1. From a system connected to the internet, download clush and install it on admin1. Clush is available from the Extra Packages for Enterprise Linux (EPEL) repository.
2. Download clush and copy it to the root folder of admin1.
3. Log in to admin1 and install clush:
yum -y install clustershell*
4. Edit the /etc/clustershell/groups file to include host names for all the nodes in the cluster. Create four special groups in addition to the group that includes all the hosts in the cluster. These groups help target the clusterwide commands to a specific set of nodes grouped by their role in the Splunk deployment.
vi /etc/clustershell/groups
5. Copy and paste the following content and save the groups file:
admins: admin[1-3]
indexers: indexer[1-3]
searchheads: searchhead[1-3]
all: admin[1-3],searchhead[1-3], indexer[1-3]
For more information and documentation about clush, see https://github.com/cea-hpc/clustershell/wiki/UserAndProgrammingGuide.
Note: You need to configure the subscription manager to download packages.
6. From the admin server (here, admin1), copy the /etc/hosts file to all the other servers:
clush -a -B -x admin1 -c /etc/hosts
7. Install httpd on the admin server.
8. Disable SELinux by editing /etc/selinux/config and changing the SELINUX line to SELINUX=disabled. The following command disables SELINUX on all nodes:
clush -a -b "sed -i 's/SELINUX=enforcing/SELINUX=disabled/g' /etc/selinux/config"
clush -a -b "setenforce 0"
9. Disable the Linux firewall:
systemctl disable firewalld
10. Configure NTP.
To preserve logs regarding killed processes and failed job, enable syslog on each node. Versions such as syslog-ng and rsyslog are used, making it more difficult to be sure that a syslog daemon is present.
1. Enable syslog.
2. Confirm that the service is properly configured by running the following commands:
clush -a -b rsyslogd -v
clush -a -b "systemctl status rsyslog.service"
In Linux, the nofile property in the /etc/security/limits.conf file defines the number of index nodes that can be opened simultaneously. With the default value of 1024, the system may appear to be out of disk space and would show that no inodes are available. This value should be set to 64000 on every node for users root and splunk.
Note: When the Splunk Enterprise software is installed, a service user account named splunk is created automatically. Because all Splunk-related operations are performed as user splunk, its ulimit value needs to be increased as well. Higher values are unlikely to result in an appreciable performance gain.
1. Set the nofile properties of root and splunk users to 64000 by editing the /etc/security/limits.conf file on the admin server. Add the following lines to this file:
root soft nofile 64000
root hard nofile 64000
splunk soft nofile 64000
splunk hard nofile 64000
2. Copy the /etc/security/limits.conf file from the admin server (admin1) to all the nodes using the following commands:
clush -a -b -c /etc/security/limits.conf
clush -a -b grep 64000 /etc/security/limits.conf
3. Verify the ulimit settings by running the following command. The command should report 64000.
clush -a -b ulimit -n
Adjusting the tcp_retries parameter for the system network enables faster detection of failed nodes. Given the advanced networking features of Cisco UCS, this is a safe and recommended change (failures observed at the operating system layer are most likely serious rather than transitory). On each node, setting the number of TCP retries to 5 can help detect unreachable nodes with less latency.
1. Edit the /etc/sysctl.conf file on admin1 and add the following line:
net.ipv4.tcp_retries2=5
2. Copy the /etc/sysctl.conf file from the admin server (admin1) to all the other nodes using the following command:
clush -a -b -c /etc/sysctl.conf
3. Load the settings from default sysctl file /etc/sysctl.conf by running the following command:
clush -a -b sysctl -p
Configure virtual machine swapping
The vm.swappiness parameter, with a value from 0 to 100, controls the degree to which the system swaps. A high value prioritizes system performance, aggressively swapping processes out of physical memory when they are not active. A low value avoids swapping processes out of physical memory for as long as possible.
To reduce swapping, run the following command on all nodes. The default value is 60.
clush -a -b "echo vm.swappiness=1 >> /etc/sysctl.conf"
Disable the IPv6 default settings. The addresses used at IPv4.
1. Disable IPv6 because the addresses used are IPv4.
2. Load the settings from the default sysctl file /etc/sysctl.conf:
clush -a -b "sysctl -p"
Disable transparent huge pages
Disabling THP reduces elevated CPU use otherwise caused by THP.
1. From the admin server, run the following commands:
clush -a -b "echo never > /sys/kernel/mm/transparent_hugepage/enabled"
clush -a -b "echo never > /sys/kernel/mm/transparent_hugepage/defrag"
2. Run the preceding commands every time the Linux system starts. Add these commands to /etc/rc.local so that they run automatically upon every reboot.
3. From the admin server, run the following commands:
rm -f /root/thp_disable
echo "echo never > /sys/kernel/mm/transparent_hugepage/enabled" > /root/thp_disable
echo "echo never > /sys/kernel/mm/transparent_hugepage/defrag " >> /root/thp_disable
4. Copy the file to all the nodes:
clush -a -b -c /root/thp_disable
5. Append the contents of thp_disable file to the /etc/rc.local file:
clush -a -b "cat /root/thp_disable >> /etc/rc.local"
Configure these XFS volumes after the OS is installed:
1. For search head and admin servers:
◦ Create a RAID 1 virtual disk from the service profile using two SAS SSDs. Create a partition using the parted utility and format the volume using mkfs.
◦ After the volume is formatted, mount it at the /data/disk1 location and add the entry in the /etc/fstab file.
2. For indexer servers:
◦ Create two volumes: one with two NVMe SSDs for RAID 1 and another with 10 SATA SSDs for RAID 5.
◦ Create a RAID 1 virtual disk with NVMe SSDs from the BIOS options under the Intel Virtual RAID on CPU (VROC) settings, using two NVMe SSDs.
Note: Intel VROC Technology (https://www.intel.com/content/www/us/en/software/virtual-raid-on-cpu-vroc.html) allows the use of hardware-level RAID for NVMe drives, and Cisco servers supports them for Intel NVMe drives. For more information, refer to https://www.cisco.com/c/dam/en/us/products/collateral/servers-unified-computing/ucs-c-series-rack-servers/c240m6-sff-specsheet.pdf. Currently, the RAID configuration needs to be performed using BIOS options. This feature is expected to be available from the Cisco Intersight user interface in future releases.
◦ Create the RAID 5 virtual disk from the service profile using SATA SSDs.
◦ Create a partition using the parted utility and format the volume using mkfs for both NVMe and SATA SSD virtual disks.
◦ After the volume is formatted, mount the NVMe virtual disk at the /data/disk1 location and the SATA SSD virtual disk at the /data/disk2 location and update the entry in the /etc/fstab file.
This section describes Splunk Enterprise and how to install it.
Splunk architecture and terminology
Splunk comes packaged as an all-in-one distribution. The single file can be configured to function as one or all of the components listed here and shown in Figure 8 (the Splunk universal forwarder is a separate package). In a distributed deployment, installations follow a three-tier approach.
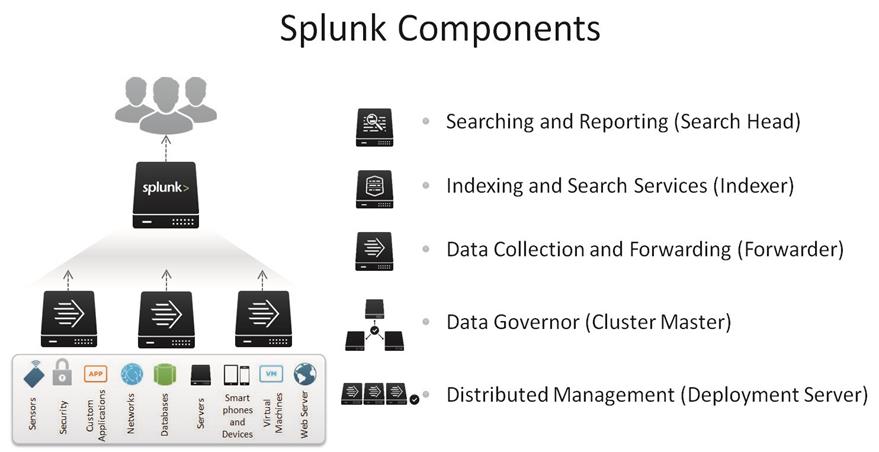
Splunk components
● Search head: The search head is a Splunk Enterprise instance that handles search management functions in a distributed search environment, directing search requests to a set of search peers and then merging the results back to the user. A Splunk Enterprise instance can function as both a search head and a search peer. If it performs only searching (and not any indexing), it is usually referred to as a dedicated search head. Search head clusters are groups of search heads that coordinate their activities.
● Indexer: The indexer is a Splunk Enterprise instance that indexes data, transforming raw data into events and placing the results into an index. It also searches the indexed data in response to search requests. The indexer also frequently performs the other fundamental Splunk Enterprise functions: data input and search management. In larger deployments, forwarders handle data input and forward the data to the indexer for indexing. Similarly, although indexers always perform searches across their own data, in larger deployments, a specialized Splunk Enterprise instance, called a search head, handles search management and coordinates searches across multiple indexers.
● Universal forwarder: The universal forwarder is a small-footprint version of a forwarder, a Splunk Enterprise instance that forwards data to another Splunk server or a third-party system without parsing.
● Heavy forwarder: The heavy forwarder is a fully functional Splunk instance that is configured to send data to the indexing tier. The heavy forwarder performs Splunk's parsing phase before forwarding data.
● Cluster master (master node): The cluster master is the indexer cluster node that regulates the functioning of an indexer cluster.
● Deployment server: The deployment server is a Splunk Enterprise instance that acts as a centralized configuration manager, grouping together and collectively managing any number of Splunk Enterprise instances. Instances that are remotely configured by deployment servers are called deployment clients. The deployment server downloads updated content, such as configuration files and applications, to deployment clients. Units of such content are known as deployment applications.
● Deployer (not shown in Figure 8): The deployer is a Splunk Enterprise instance that distributes applications and certain other configuration updates to search head cluster members.
● License master (not shown in Figure 8): The license is a license master that controls one or more license slaves. From the license master, you can define stacks and pools, add licensing capacity, and manage license slaves.
● Distributed management console (not shown in Figure 8): The distributed management console lets you view detailed performance information about your Splunk Enterprise deployment.
In the distributed configuration, indexers and search heads are configured in a clustered mode. Splunk Enterprise supports clustering for both search heads and indexers.
A search head cluster is a group of interchangeable and highly available search heads. By increasing concurrent user capacity and by eliminating single points of failure, search head clusters reduce the TCO.
Indexer clusters are made up of groups of Splunk Enterprise indexers configured to replicate peer data so that the indexes of the system become highly available. By maintaining multiple, identical copies of indexes, clusters prevent data loss while promoting data availability for searching.
For more information, refer to the Splunk documentation.
In this deployment, three clustered search heads, three clustered indexers, a deployment server, a deployer, a distributed management console, a master node, and a license master are configured.
The installation sequence is as follows:
● Install Splunk.
● Configure the license master.
● Configure the master node.
● Configure the indexing cluster.
● Configure the deployer.
● Configure the search head cluster.
● Configure the distribution management console.
● Configure the deployment server.
● Install the universal forwarder.
Install Splunk Enterprise
The Splunk Enterprise software is a single software package that can be configured to function in a specific role. Installation of Splunk across all nodes is the same, with no specific parameters required; configuration changes then are required for each component. Therefore, a simple installation across every server is used here as the base to build this architecture.
See the Splunk documentation for detailed installation steps: https://docs.splunk.com/Documentation/SplunkCloud/8.2.2203/SearchTutorial/InstallSplunk#Linux_installation_instructions.
1. From a host connected to the internet, download the Splunk Enterprise software from the Splunk.com website. Copy it to the server admin1.
2. Copy the Splunk software to all the nodes (three admin servers, three search heads, and threes indexers):
clush -a -c ./splunk-8.2.6-a6fe1ee8894b-linux-2.6-x86_64.rpm --dest=/tmp
3. Modify the permissions on the Splunk Enterprise Red Hat Package Manager (RPM) file to include execution privileges:
clush -a "chmod +x /tmp/splunk-8.2.6-a6fe1ee8894b-linux-2.6-x86_64.rpm"
4. Install Splunk Enterprise in the /data/disk1 directory of the indexers, search heads. and admin servers:
clush -a -b "rpm -ivh --prefix=/data/disk1 /tmp/splunk-8.2.6-a6fe1ee8894b-linux-2.6-x86_64.rpm"
Note: When Splunk Enterprise is installed using the RPM package as described here, the installation tool automatically creates a splunk user and a splunk group.
5. Set up the environment variable:
clush -a "echo SPLUNK_HOME=/data/disk1/splunk >> /etc/environment"
6. Log off and then log back in to the admin1 server. Use the ‘clush’ utility command to verify that the environment variable has been set up correctly:
clush -a -b echo $SPLUNK_HOME

7. Verify the ownership of the SPLUNK_HOME directory and its contents. All these files should belong to the splunk user and splunk group.
clush -a -b ls -l $SPLUNK_HOME
clush -a -b ls -l $SPLUNK_HOME/bin/splunk

Set up the login for user splunk
As mentioned earlier, the user splunk is created without a password. This section describes the procedure for assigning a password and configuring the password-free login for that user account.
The configurations described here enables the use of clush commands to manage the Splunk deployment across the cluster.
1. From the admin server admin1, assign the password for the user splunk on all the Splunk indexers, search heads, and admin servers:
clush -a -b "echo cisco123 | passwd splunk --stdin"
Note: The example here uses a command-line method with a clear-text password for simplification. The recommended approach is to set up a strong password and set the password manually on each server individually to match the target data centre’s security practices.
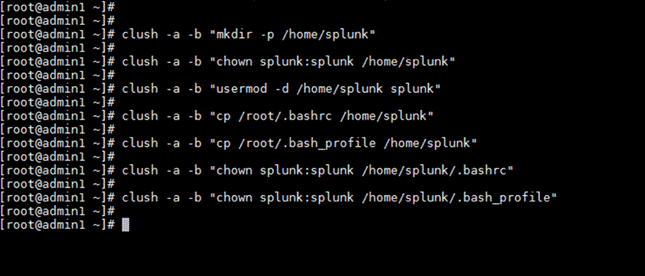
2. Create a new home directory for user splunk and assign it. Then copy the contents of the .bashrc file of the root user to user splunk. (This step is optional.)
clush -a -b "mkdir -p /home/splunk"
clush -a -b "chown splunk:splunk /home/splunk"
clush -a -b "usermod -d /home/splunk splunk"
clush -a -b "cp /root/.bashrc /home/splunk"
clush -a -b "cp /root/.bash_profile /home/splunk"
clush -a -b "chown splunk:splunk /home/splunk/.bashrc"
clush -a -b "chown splunk:splunk /home/splunk/.bash_profile"
3. Log in to the admin server as user splunk using the password assigned in the preceding step.
4. Run the ssh-keygen command to create both public and private keys on the admin server for the user splunk.
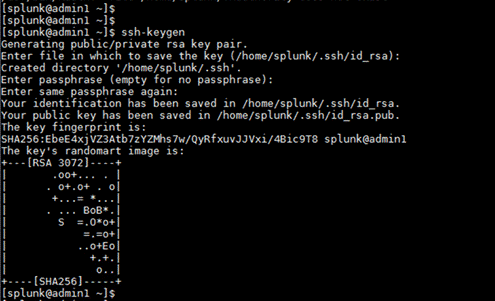
5. Run the following script from the admin server to copy the public key id_rsa.pub to all the Splunk servers: that is, the indexers, search heads, and admin servers of the cluster. The ssh-copy-id command appends the keys to the remote host’s .ssh/authorized_key.
for host in admin1 admin2 admin3 indexer1 indexer2 indexer3 searchhead1 searchhead2 searchhead3;
do
echo -n "$host -> "; ssh-copy-id -i ~/.ssh/id_rsa.pub $host;
done
6. Select Yes at the prompt “Are you sure you want to continue connecting (yes/no)?” Enter the password of the remote host.
7. Verify the password-free login by entering the following command. The output should display the host name of all Splunk servers.
clush -a hostname

Start the Splunk Enterprise cluster
Next, start the Spunk cluster.
1. Use Secure Shell (SSH) to log in to the admin server as user splunk.
2. Start the Splunk Enterprise cluster:
clush -a $SPLUNK_HOME/bin/splunk start --accept-license --no-prompt
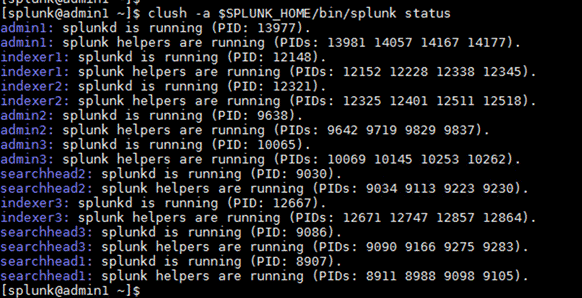
3. Verify the status of the Splunk Enterprise services:
clush -a $SPLUNK_HOME/bin/splunk status
4. Log out the shell user splunk and log back in as the root user to configure Splunk Enterprise to start automatically when the system is rebooted:
clush -a $SPLUNK_HOME/bin/splunk enable boot-start -user splunk
Create the Splunk admin user using the command-line interface
Because Splunk Enterprise was started with no prompts, you need to create the admin user with a seed password to start the system. This document uses the password cisco123 in clear text. Be sure to change this password to something more secure when you log in to the web user interface for the first time.
1. From the command-line interface (CLI), using SSH, log in to the admin server admin1 as user splunk.
2. Stop Splunk Enterprise on all servers:
clush -a $SPLUNK_HOME/bin/splunk stop
3. Generate the hash for the password of your choice. The password needs to be a minimum of eight alphanumeric characters. This document uses the password cisco123 to generate the hash.
4. Using a text editor, create a file named user-seed.conf at a temporary location with the following contents and save the contents:
[user_info]
USERNAME = admin
HASHED_PASSWORD = $6$9u8tq43HvezwE.bU$UHWjBaS15q.cCcaRaXf1Mck4KLHvoPruYL9QTab8Ueej9.c6J.dhDymoJ3v1qBUkZpUbaSq/vtIsHxpdYj.v//
5. Copy the file to $SPLUNK_HOME/etc/system/local/ on all Splunk nodes:
clush -a -c /tmp/user-seed.conf --dest=$SPLUNK_HOME/etc/system/local
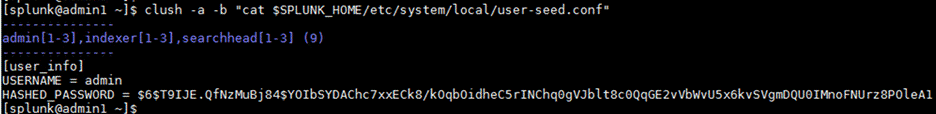
6. Verify the contents of the file user-seed.conf on all the servers:
clush -a -b "cat $SPLUNK_HOME/etc/system/local/user-seed.conf"
7. Start Splunk Enterprise on all servers and verify the status to make sure that the Splunk Enterprise services are running:
clush -a "$SPLUNK_HOME/bin/splunk start"
clush -a "$SPLUNK_HOME/bin/splunk status"
Log in as the Splunk admin the first time
1. Log in to the Splunk web user interface using your chosen password. The GUI will prompt you to change the admin password. This step needs to be performed on all Splunk instances separately by logging in to the GUI of each Splunk instance.
2. Launch the admin1 Splunk instance’s web user interface using the IP address and the default port 8000, as in this example:
http://admin1:8000
The Splunk sign-in page appears:
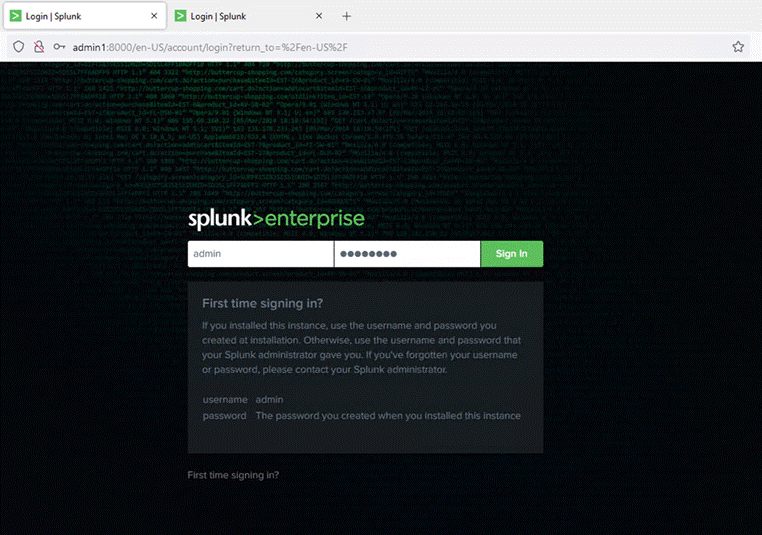
Note: In this document, the password for the Splunk administrator is set to cisco123 (the same as for the OS splunk user).
Splunk RPM packages automatically create the user splunk with the home directory of the original installation (for example, /data/disk1/splunk). If a different user is created, repeat the instructions in the earlier section
Table 4 lists the default ports used by Splunk software on every node. For more information, refer to the Splunk documentation.
Table 4. Default ports used by Splunk
| Function |
Default port |
| Management port |
8089 |
| Web interface |
8000 |
| Splunk indexing port |
9997 |
| Splunk index replication port |
8080 |
| Network input |
514 |
Configure the Splunk Enterprise cluster
Configure the main services of Splunk Enterprise as shown in Table 5. This document describes the method for configuring Splunk Enterprise with an indexer cluster and a search head cluster. Thus, you need to plan for services such as a deployer for the search head cluster and cluster master for the indexer cluster. In addition to these services, you need to plan for the Splunk monitoring console, license master, and deployment servers.
Table 5. Splunk Enterprise services
| Service |
Default port |
| License master |
admin3 |
| Cluster master |
admin1 |
| Monitoring console |
admin2 |
| Deployer for search heads |
admin3 |
| Deployment server |
admin2 |
Install the Splunk Enterprise licenses
The servers in the Splunk Enterprise infrastructure that perform indexing must be licensed. Any Splunk instance can be configured to perform the role of license master. In this deployment, the admin server (admin3) is configured as the license master, and all the other Splunk instances are configured as license slaves.
Configure the server admin3 as the central license master by following these procedures:
1. Log in to the server admin3 as user admin.
2. Navigate to the licensing screen by choosing Settings > Licensing.
3. Select Change License Group.
4. Select the Enterprise License radio button.
5. Click Save.
6. In the Add New License dialog box, click Choose File to select your license file.
7. Click Install to install the license.
8. Click Restart Now.
9. Click OK to restart Splunk to complete the license installation. When the process is complete, the Licensing screen should show the successful license installation:
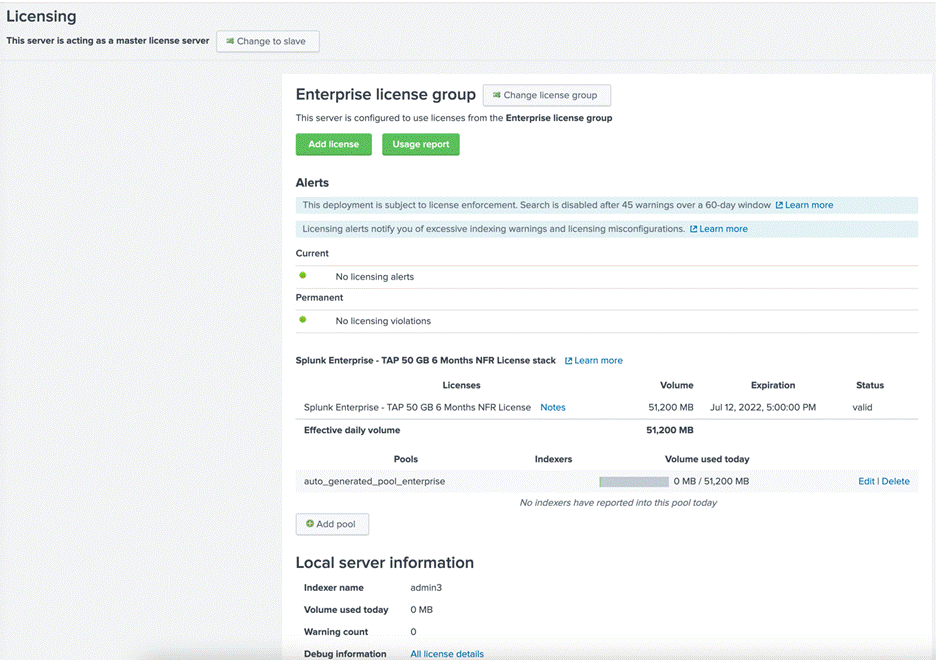
10. Log back in to Splunk (if “Are you sure you want to restart Splunk” is still visible, click Cancel).
For more information about Splunk Enterprise licensing, refer to the Splunk documentation.
About configuring the indexers, search heads, and admin server as license slaves
Configure all the other Splunk instances as license slaves to the Splunk license master: here, admin1. You can use either of the following two methods:
· The preferred method is to use clush command to configure all the Splunk instances as license slaves to the license master in admin3. This method is described in the following section.
· An alternative method is to configure each node as a license slave individually by accessing the respective web user interfaces.
Configure all the license slaves at one time using the CLI (clush)
Follow the steps here to configure all the license slaves at the same time using the clush command from the CLI:
1. From the admin server (admin1) as user splunk, run the following commands to configure all the Splunk Enterprise instances on indexers and search heads and admin servers admin1 and admin2 as the license slaves to the Splunk Enterprise instance running on admin3:
clush -a -x admin3 -b $SPLUNK_HOME/bin/splunk edit licenser-localslave -master_uri https://admin3:8089 -auth admin:cisco123
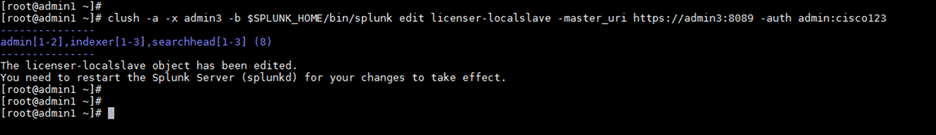
2. Restart the Splunk Enterprise services on all the nodes acting as the Splunk Enterprise license slaves. Run the following command to reboot all servers except admin3:
clush -a -x admin3 $SPLUNK_HOME/bin/splunk restart
All nodes except the node admin3 will restart. During the restart process, you will receive confirmation that the instances are running as license slaves.
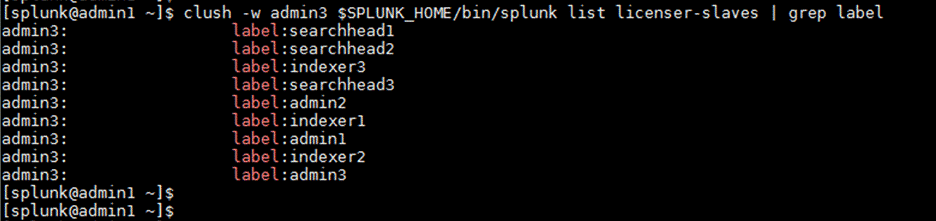
3. Run the following command on admin1 to see the list of license slaves. It should include all the servers: three indexers, three search heads, and three admin server:
clush -w admin3 $SPLUNK_HOME/bin/splunk list licenser-slaves | grep label
4. Verify the Splunk Enterprise licenser slaves configuration:
Verify the license master-slave relationships
You can, optionally, verify the master-slave relationships of your deployment.
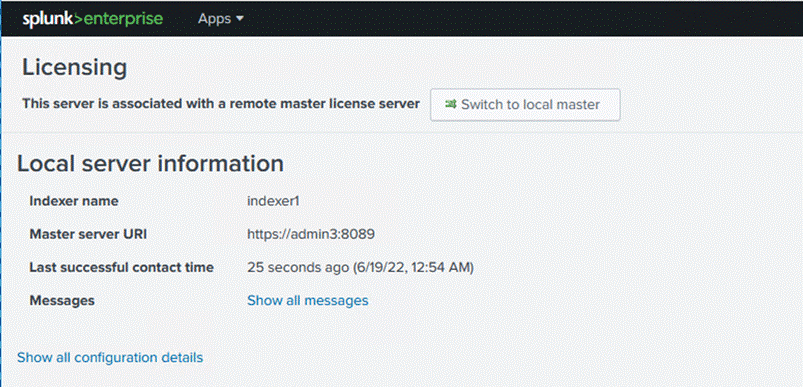
1. Review the licensing screen in the web user interfaces of the slave nodes. For example, the Licensing screen on an indexer is shown here. In this case, confirm that the master server uniform resource identifier (URI) is set to https://admin3:8089.
2. Verify the Licensing screen in the web user interface of the license master instance: here, admin3.
3. At the bottom of this screen, click Show All indexer Details to view the details. In this case, you should see nine license slaves listed: three indexers, three search heads, and three admin servers:
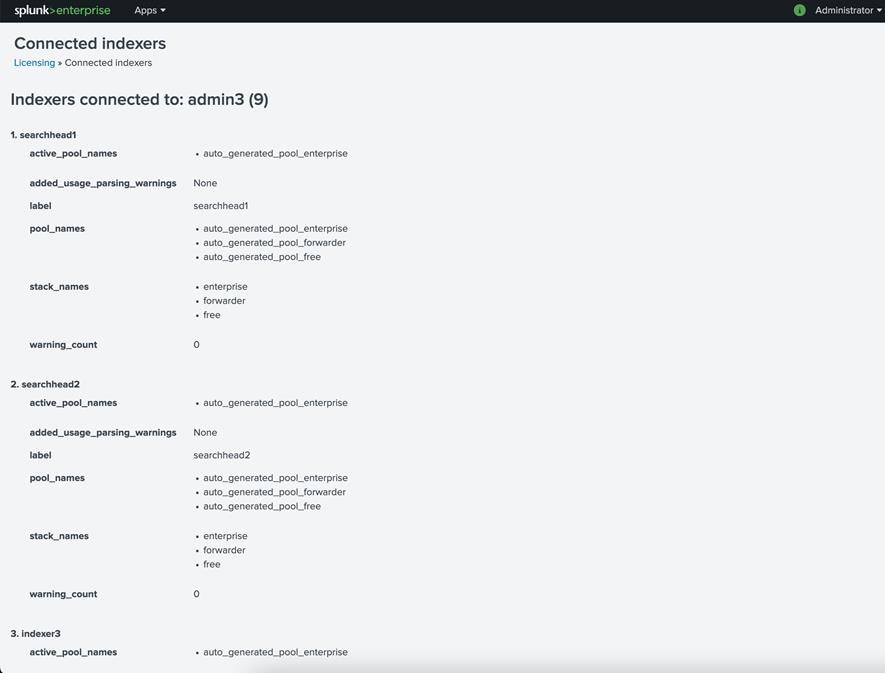
Note: The license master counts all the license slaves as Splunk indexer instances despite the actual roles that the instances have been configured to perform.
Configure Splunk indexer volumes
The Splunk Enterprise indexer instances are installed on Cisco UCS servers with hybrid storage. Two volumes are configured in this deployment. This section describes how to override the default settings in the indexes.conf file to make use of the two volumes:
● The /data/disk1 volume is backed by NVMe SSD storage media. This volume is used for installing Splunk Enterprise software and for storing the hot-tier databases.
● The /data/disk2 volume is backed by SATA SSD storage media. This volume is used for storing the warm- and cold-tier databases.
For additional information about partitions for index data, refer to https://docs.splunk.com/Documentation/Splunk/8.2.6/Indexer/Usemultiplepartitionsforindexdata.
Provision the indexer cluster master on admin1
This section describes the procedure for configuring the admin server admin1 as the indexer cluster master.
1. Using your browser, go to the Splunk Enterprise instance’s web user interface: for example, go to https://admin1:8000/
2. Choose Settings > Indexer Clustering.
3. Click Enable Indexer Clustering.
4. Select the Master Node radio button. Then click Next.
5. Set the Replication Factor field to 2 and the Search Factor field to 2.
6. Set up a security key. The installation described here uses the string Ciscoucs as the security key.
7. Specify a cluster label. The installation described here uses the string Cluster1 as the label.

8. Click Enable Master Node.
9. Click Restart Now to restart the Splunk Enterprise instance to apply the changes.
Note: Replication and search factors vary by deployment. The replication factor indicates the number of copies to be maintained on the indexers. The search factor indicates how many of those copies will return search results. In the configuration described here, one indexer could be down and searches will still return all results. If the configuration needs to be more resilient, you can increase the replication factor, but this change will also increase disk consumption. Consult the documentation for more information: https://docs.splunk.com/Documentation/Splunk/8.2.6/Indexer/Thereplicationfactor.
10. After the Restart Successful message appears, click OK to return to the login screen.
11. Log back in as the admin user.
12. Note that the Cluster Status indicator is now red because there are no indexers in the cluster. This behavior is expected.
About configuring indexing peers
Configure all the Splunk instances as the indexing peers of the master node, admin1. You can use either of the following methods:
● The preferred method is to use clush command to configure all the Cisco UCS C240 M6 servers as indexing peers. The following section describes the procedure for performing this configuration.
● An alternative method is to configure each C240 M6 server as an indexing peer individually by accessing the respective web user interfaces.
An indexer cluster is a group of Splunk Enterprise instances, or nodes, that, working in concert, provide a redundant indexing and searching capability. The indexer cluster consists of these parts:
● A single master node to manage the cluster
● A number of peer nodes to index and maintain multiple copies of the data and to search the data
● One or more search heads to coordinate searches across the set of peer nodes
The Splunk Enterprise indexers in an indexer cluster are configured to replicate each other’s data, so the system keeps multiple copies of all data. This process is known as index replication. The number of copies is controlled by a parameter known as the replication factor. By maintaining multiple, identical copies of Splunk Enterprise data, clusters prevent data loss while promoting data availability for searching.
Indexer clusters make use of automatic failover from one indexer to the next. Therefore, if one or more indexers fail, incoming data continues to be indexed, and indexed data continues to be searchable.
For more information, refer to the Splunk documentation.
Configure all indexing peers using the CLI (clush)
This document uses the CLI and the clush command to configure all indexing peers at the same time.
1. Log in to admin1 as the user splunk and issue the following commands:
clush --group=indexers $SPLUNK_HOME/bin/splunk edit cluster-config -mode slave -master_uri https://admin1:8089 -replication_port 8080 -secret Ciscoucs -auth admin:cisco123
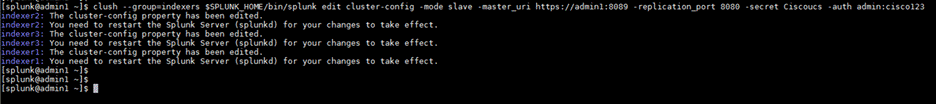
2. After cluster configuration has been edited, the Splunk Enterprise instances on all the indexers must be restarted. Use the following commands to restart the Splunk indexer instances and verify that all the Splunk Enterprise instances are running:
clush --group=indexers $SPLUNK_HOME/bin/splunk restart
clush -a $SPLUNK_HOME/bin/splunk status
Note: After the indexers are added to the cluster, you should not use the command $SPLUNK_HOME/bin/splunk restart on individual indexers. For more information, see http://docs.splunk.com/Documentation/Splunk/latest/Indexer/Restartthecluster
Verify the cluster configuration
You can verify your cluster configuration.
1. After all the Splunk Enterprise processes of peer nodes have been restarted, check the web user interface of the master node (admin1). The master node reports the number of available peers.
2. Navigate to the master node’s web GUI (for example, https://admin1:8000)
3. Choose Settings > Index Clustering.
All three indexers should appear available and searchable:
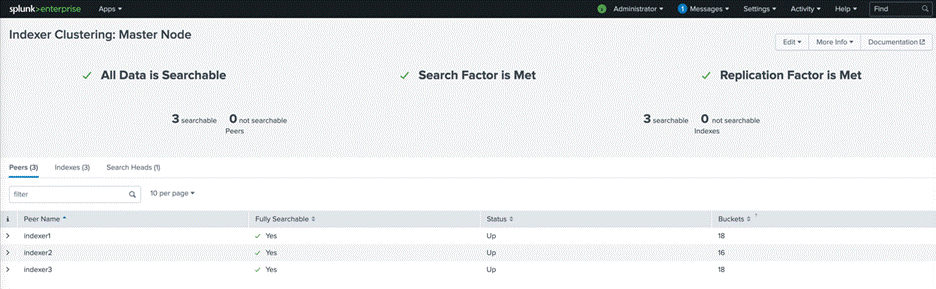
1. Note the cluster status. It should now be green:

Configure receiving on the peer nodes
For the indexers (or peer nodes) to receive data from the forwarders, the inputs.conf file of all the indexers needs to be configured with a line to enable TCP port 9997. You accomplish this by editing a special-purpose inputs.conf file in the cluster master (here, admin1) as shown here.
1. On the command line of the master node (admin1), navigate to the following directory:
cd $SPLUNK_HOME/etc/master-apps/_cluster/local
2. Create and edit the inputs.conf file with the following content:
[splunktcp://:9997]
connection_host = ip
Note: If this configuration uses DNS, edit the last line to connection_host = dns.
3. Go to the Splunk Enterprise web user interface on admin1 using a web browser.
4. Navigate to Settings > Distributed Environment > Indexer Clustering.
5. Click the Edit button and select Configuration Bundle Actions.
6. Note the various options available on the Configuration Bundle Actions page. You need to validate the configuration bundle changes before distributing the configuration to all the indexers.
7. Click the Validate and Check Restart button and wait for the successful completion of the process.
8. Click the Push button to distribute the configuration bundle to all the indexers.
9. Click the Push Changes button to push the changes.
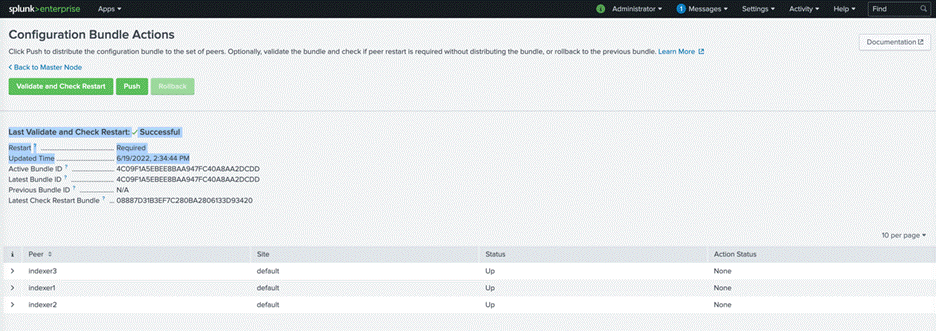
10. After the validation is complete and the changes have been successfully pushed to the indexers, note the Health Status icon on the status bar at the top to make sure that it is now green.
Configure the master to forward all its data to the indexer layer
As a best practice, you should forward all master node internal data to the indexer (peer node) layer. This step has several advantages. It enables diagnostics for the master node if it goes down. The data leading up to the failure is accumulated on the indexers, where a search head can later access it.
The preferred approach is to forward the data directly to the indexers, without indexing separately on the master. You do this by configuring the master as a forwarder. These are the main steps:
1. Make sure that all necessary indexes exist on the indexers. This is normally the case, unless you have created custom indexes on the master node. Because _audit and _internal exist on indexers as well as the master, you do not need to create separate versions of those indexes to hold the corresponding master data.
2. Configure the master node as a forwarder. Create an outputs.conf file on the master node that configures it for load-balanced forwarding across the set of peer nodes.
The indexing function on the master must also be turned off, so that the master does not retain the data locally as well as forward it to the peers.
3. In the cluster master node admin1, create the outputs.conf file in the master node in the $SPLUNK_HOME/etc/system/local directory. Create an outputs.conf file with the following content:
#Turn off indexing on the master
[indexAndForward]
index = false
[tcpout]
defaultGroup = search_peers
forwardedindex.filter.disable = true
indexAndForward = false
[tcpout:search_peers]
server=indexer1:9997,indexer2:9997,indexer3:9997 autoLB = true
4. Restart Splunk. Then check the status of the Splunk process and the health status of the cluster:
$SPLUNK_HOME/bin/splunk restart
$SPLUNK_HOME/bin/splunk status
5. Check the status of Splunk Enterprise on the cluster master.
6. Check the cluster health status:
![]()
Configure search head clustering
A search head cluster is a group of Splunk Enterprise search heads that serves as a central resource for searching. The members of a search head cluster are essentially interchangeable. You can run the same searches, view the same dashboards, and access the same search results from any member of the cluster.
Refer the following link for more information: https://docs.splunk.com/Documentation/Splunk/8.2.6/DistSearch/SHCconfigurationoverview.
Add search heads to the cluster master node
A Splunk Enterprise instance can be configured as a search head using the indexer clustering feature.
1. Log in to one of the search heads as user admin.
2. Navigate to Settings > Indexer Clustering.
3. Click Enable Indexer Clustering.
4. In the Enable Clustering dialog box, click Search head node. Then click Next.
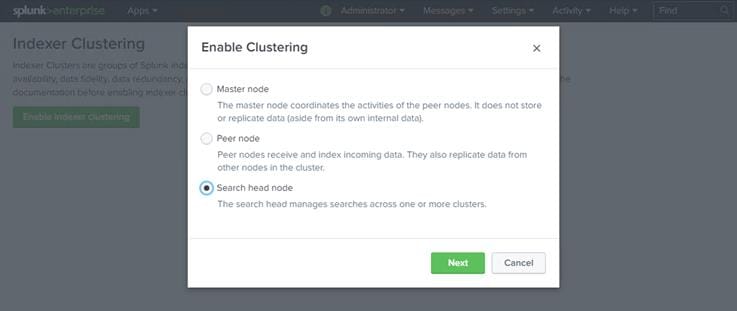
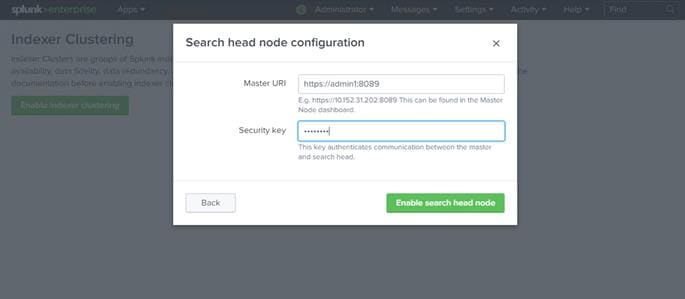
5. Enter the host name of the master node, including the master port number (default: 8089), in the format https://<hostname_or_IP> (for example, https://admin1:8089).
6. Enter the same security key that was used while configuring the master node (here, Ciscoucs).
7. Click Enable Search head node.
8. Click Restart Now to restart Splunk Enterprise.
9. Log back in to searchhead1 and navigate to Settings > Indexer Clustering to view the configuration reflected. The screen should show the information for the cluster master: here, admin1.
10. Repeat the preceding steps to configure all three servers with host names searchhead1, searchhead2, and searchhead3 as search heads.
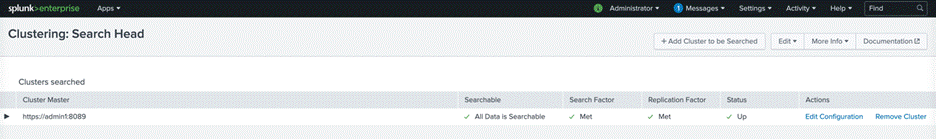
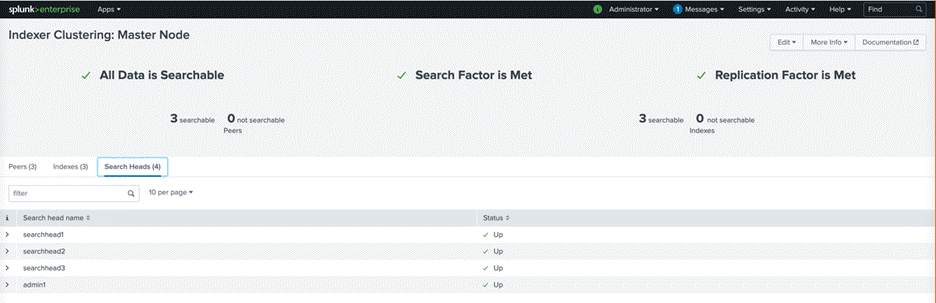
11. Verify the search head cluster members in the master node by navigating to Settings > Indexer Clustering and clicking the Search Heads tab:
Configure the security key on the deployer and search head cluster members
A search head cluster requires a separate Splunk Enterprise instance to function as a deployer. The deployer is a Splunk Enterprise instance that is used to distribute applications and certain other configuration updates to search head cluster members. The set of updates that the deployer distributes is called the configuration bundle.
The deployer distributes the configuration bundle in response to the Splunk administrator’s command, according to the deployer push mode selected. The deployer also distributes the bundle when a member joins or rejoins the cluster.
The deployer authenticates all communications with the cluster members using a security key. In this document, the string Ciscoucs is used as the secret key.
The following configuration needs to be applied on the search head deployer (here, admin3) and the search head cluster members (here, searchhead1, searchhead2, and searchhead3).
Note: Do not locate deployer functions on a search head cluster member. The deployer instance must be separate from any cluster member, because it is used to manage the configurations of the cluster members.
1. Log in to the servers searchhead1, searchhead2, searchhead3, and admin3 and edit $SPLUNK_HOME/etc/system/local/server.conf to add the following lines:
[shclustering]
pass4SymmKey = Ciscoucs
Note: The string Ciscoucs is used as the secret key. Replace this string with your own secret key.
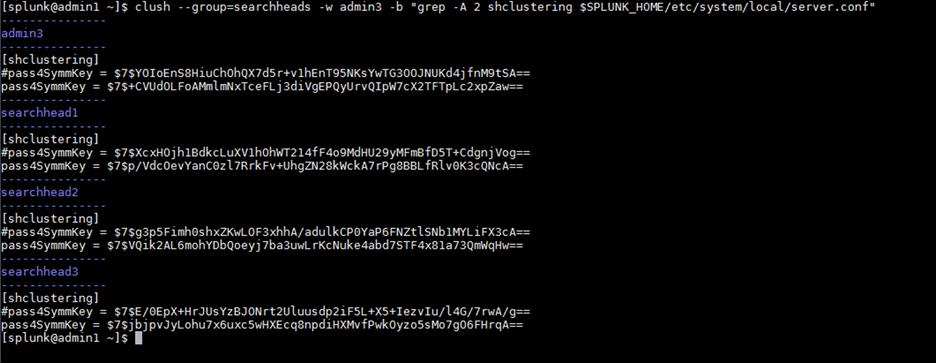
2. From admin1, run the following command on admin1 to verify that the newly added configuration is identical on all four splunk instances:
clush --group=searchheads -w admin3 -b "grep -A 2 shclustering
3. From admin1, run the following command to restart the Splunk Enterprise instances of admin3, searchhead1, searchhead2, and searchhead3:
clush --group=searchheads -w admin3 $SPLUNK_HOME/bin/splunk restart
Note: After a successful restart, pass4SymmKey will have been replaced by an encrypted string.
5. On admin3 (the deployer), edit the $SPLUNK_HOME/etc/system/local/server.conf file to add the search head cluster label (shclustering) to the configuration:
[shclustering]
shcluster_label = SHCluster1
6. Restart the Splunk instance on admin3 (deployer).
Enable the search head cluster and deployer and configure search head cluster members
The search head hosts (searchhead1, searchhead2, and searchhead3) can be added to the search head cluster labeled SHCluster1.
The following steps show how to configure each search head into a search head cluster labeled SHCluster1. This cluster’s assigned deployer would be the Splunk Enterprise instance on the host admin3.
1. Log in to the server admin1 as user splunk.
2. Use the following commands to configure the search heads as part of search head cluster labeled SHCluster1. Set the mgmt._uri for each search head and conf_deploy_fetch_rul to admin3 (the deployer).
Note: The server admin3 functions as the search head deployer.
3. As the user, use the command ssh searchhead1 to log in to the server searchhead1 and run the following commands:
$SPLUNK_HOME/bin/splunk init shcluster-config -auth admin:cisco123 -mgmt_uri https://searchhead1:8089 -replication_port 18081 -replication_factor 2 -conf_deploy_fetch_url https://admin3:8089 -secret cisco123 -shcluster_label SHCluster1
![]()
4. As the user, use the command ssh searchhead2 to log in to the server searchhead2 and run the following commands:
$SPLUNK_HOME/bin/splunk init shcluster-config -auth admin:cisco123 -mgmt_uri https://searchhead2:8089 -replication_port 18081 -replication_factor 2 -conf_deploy_fetch_url https://admin3:8089 -secret cisco123 -shcluster_label SHCluster1
5. As the user, use the command ssh searchhead3 to log in to the server searchhead1 and run the following commands:
$SPLUNK_HOME/bin/splunk init shcluster-config -auth admin:cisco123 -mgmt_uri https://searchhead3:8089 -replication_port 18081 -replication_factor 2 -conf_deploy_fetch_url https://admin3:8089 -secret cisco123 -shcluster_label SHCluster1
6. From admin1, restart all the Splunk Enterprise search head instances using the following command:
clush --group=searchheads $SPLUNK_HOME/bin/splunk restart
A search head cluster consists of a group of search heads that share configurations, job scheduling, and search artifacts. The search heads are known as the cluster members.
One cluster member has the role of captain, which means that it coordinates job scheduling and replication activities among all the members. It also serves as a search head like any other member, running search jobs, serving results, and so on. Over time, the role of captain can shift among the cluster members.
For more information, refer to https://docs.splunk.com/Documentation/Splunk/8.2.6/DistSearch/Transfercaptain.
A search head cluster uses a dynamic captain. This means that the member serving as captain can change over the life of the cluster. Any member has the ability to function as captain. When necessary, the cluster holds an election, which can result in a new member taking over the role of captain.
The procedure described in this section helps bootstrap the election process.
1. Log in to any search head as user splunk. In the example here, searchhead2 is used for the bootstrap.
2. Start the search head captain election bootstrap process by entering the following command as the splunk user:
$SPLUNK_HOME/bin/splunk bootstrap shcluster-captain -servers_list "https://searchhead1:8089,https://searchhead2:8089,https://searchhead3:8089" -auth admin:cisco123
Note: The search head captain election process can be started from any search head cluster member.
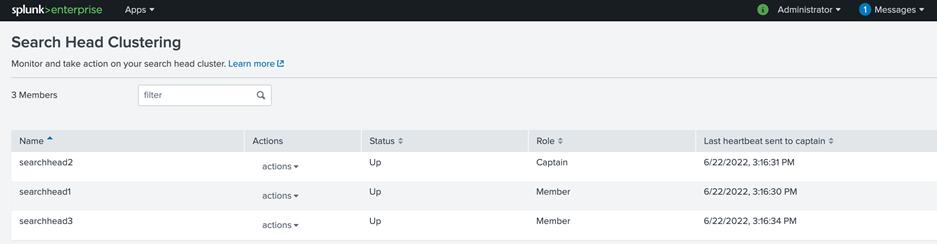
3. Log in to the web user interface of the searchhead3 Splunk Enterprise instance and navigate to Settings > Search Head Clustering. Note the three search heads in the cluster with searchhead2 as captain:
Configure search heads to forward their data to the indexer layer
As a best practice, you should forward all search head internal data to the search peer (indexer) layer. This practice has several advantages. It enables diagnostics for the search head if it goes down. The data leading up to the failure is accumulated on the indexers, where another search head can later access it. In addition, by forwarding the results of summary index searches to the indexer level, all search heads have access to them. Otherwise, the results are available only to the search head that generates them.
The recommended approach is to forward the data directly to the indexers, without indexing separately on the search head. This approach can be achieved by configuring the search head as a forwarder by creating an outputs.conf file on the search head. This configuration enables the search head to perform load-balanced forwarding across the set of search peers (indexers).
1. Using SSH, log in to the search head deployer (here, admin3) as the splunk user. Navigate to $SPLUNK_HOME/etc/shcluster/apps.
2. Create the directories outputs and outputs/local.
3. Navigate to the newly created local directory.
4. Within the $SPLUNK_HOME/etc/shcluster/apps/outputs/local/ directory, create the file outputs.conf with the following content:
cd $SPLUNK_HOME/etc/shcluster/apps
mkdir –p ./outputs/local
5. Copy and paste the following contents:
vi outputs.conf
# Turn off indexing on the searchhead
[indexAndForward]
index = false
[tcpout]
defaultGroup = search_peers
forwardedindex.filter.disable = true
indexAndForward = false
[tcpout:search_peers]
server=indexer1:9997,indexer2:9997,indexer3:9997
autoLB = true
6. Log in to one of the members of the search head cluster to verify the status of the cluster and to identify the search head cluster captain.
Note: It is important to push the configuration bundle to the search head cluster captain.
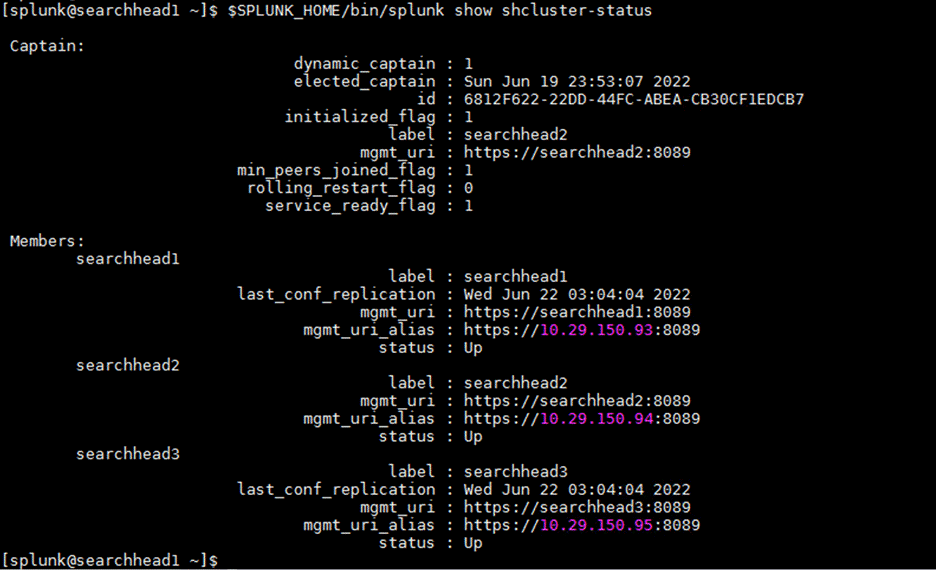
7. Run the following commands to distribute the configuration bundle to all the search head cluster members. Note the use of the search head cluster captain’s URL in the target field.
$SPLUNK_HOME/bin/splunk apply shcluster-bundle -target https://searchhead2:8089 -auth admin:cisco123
8. Acknowledge the warning. A pop-up message will notify you that the bundle has been pushed successfully.

Troubleshooting tip: If a bundle distribution fails with the following error, perform the steps that follow:
Error while deploying apps to first member, aborting apps deployment to all members: Error while fetching apps baseline on target=https://<searchhead captain host>:8089: Non-200/201 status_code=401; {"messages":[{"type":"WARN","text":"call not properly authenticated"}]}
◦ Replace pass4SymKey in server.conf on the deployer and the search head cluster members with a clear-text security key.
◦ Restart splunkd on the deployer and search head cluster members.
◦ Retry the apply shcluster-bundle command.
9. Verify the successful distribution of the configuration bundle by using the following command. The contents of the outputs.conf file on the search heads should be the same as that provided in the deployer’s $SPLUNK_HOME/etc/shcluster/apps/outputs/local/outputs.conf file.
clush --group=searchheads -b cat $SPLUNK_HOME/etc/apps/outputs/default/outputs.conf
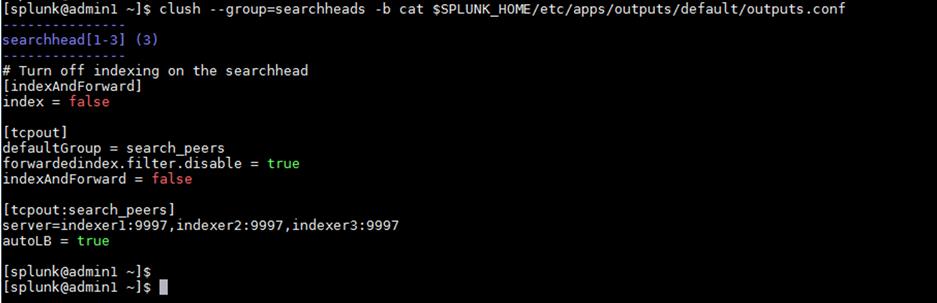
Configure search head load balancing
As described earlier in the introductory note about search head clustering, it is helpful to use a load balancer to take advantage of the search head cluster.
1. Designate a common URL for use throughout the enterprise (for example, https://splunk.domain.com).
2. Use the common URL to balance traffic among all three search heads and their respective ports (for example, https://searchhead1:8000, https://searchhead2:8000, and https://searchhead3:8000).
Note: Explicit instructions for configuring the designated load balancer will differ by vendor, but the functions and load-balancing directions are the same.
Integrate the search head cluster with the indexer cluster
For the search heads of the search head cluster to be able to search across all the indexer clusters, the search head cluster must be integrated with the indexer cluster.
To integrate a search head cluster with an indexer cluster, each member of the search head cluster must be configured as a search head on the indexer cluster. After you do this, the search heads get their list of search peers from the master node of the indexer cluster.
1. Use SSH to log in to admin1 as the user splunk.
2. From admin1, use SSH to log in to the members of the search head cluster, searchhead1, searchhead2, and searchhead3, one at a time.
3. Enter the following command on each search head:
$SPLUNK_HOME/bin/splunk edit cluster-config -mode searchhead -master_uri https://admin1:8089 -secret Ciscoucs

4. Restart the Splunk instance:
$SPLUNK_HOME/bin/splunk restart
5. Repeat this process on all the three members of the search head cluster.
The search heads now run their searches against the peer nodes in the indexer cluster.
Configure the Splunk monitoring console
The monitoring console is a Splunk Enterprise instance that functions as a search head. It runs searches across other Splunk Enterprise instances to gather information from those instances and provide detailed performance information about the deployment.
This section describes the procedure for configuring the distributed management console for this deployment. It is installed on one of the admin server: here, admin2.
For the monitoring console to gather information, all Splunk Enterprise instances except clustered indexers must be its search peers. Indexer cluster master admin1 will represent all the clustered indexers.
In this deployment, the following instances need to be added as the search peers for the monitoring console (admin2):
● admin1: Indexer cluster master
● admin3: License master and deployer
● admin2: Monitoring console
● Search heads
Prepare the Splunk monitoring console on a search head instance
For the Splunk monitoring console to function effectively, all its internal logs must be forwarded to the indexer tier.
The recommended approach is to forward the data directly to the indexers, without indexing separately on the search head. You accomplish this by configuring the search head as a forwarder by creating an outputs.conf file on the search head that configures the search head for load-balanced forwarding across the set of search peers (indexers).
1. Use SSH to log in to the node admin2 (the server with the Splunk Enterprise instance that will become the monitoring console) and navigate to $SPLUNK_HOME/etc/system/local.
2. Create a new text file called outputs.conf with the following contents:
cd $SPLUNK_HOME/etc/system/local
vi outputs.conf
# Turn off indexing on the search head
[indexAndForward]
index = false
[tcpout]
defaultGroup = search_peers
forwardedindex.filter.disable = true
indexAndForward = false
[tcpout:search_peers]
server=indexer1:9997,indexer2:9997,indexer3:9997
autoLB = true
3. Restart the Splunk instance:
$SPLUNK_HOME/bin/splunk restart
Enable the Splunk monitoring console
Now enable the monitoring console.
1. Navigate to the Splunk web user interface on admin2 (http://admin2:8000/)
2. Choose Settings > Monitoring Console.
3. In the Monitoring Console application, choose Settings > General Setup.
4. Select the distributed mode.
5. Click Continue to see the details of the Splunk instance on admin2.
6. In the Action column, click the Edit option and select Edit Server Roles. Select the Search Head and KV-store roles and uncheck all other roles.
7. Click Save.
8. Click Apply Changes to save the configuration.
Add the search peers of the monitoring console
Add the indexer cluster master, here, admin1, to the monitoring console as described here.
1. Navigate to the monitoring console interface using the Splunk web user interface on admin2 (http://admin2:8000/).
2. Select Settings and, under Distributed Environment, select a distributed search.
3. Click Add New and enter the details of the indexer cluster master (admin1) as shown in Table 6. The screen will reflect the details.
Table 6. Indexer cluster master details
| Peer URI |
|
| Remote username |
admin |
| Remote password |
cisco123 |
| Confirm password |
cisco123 |
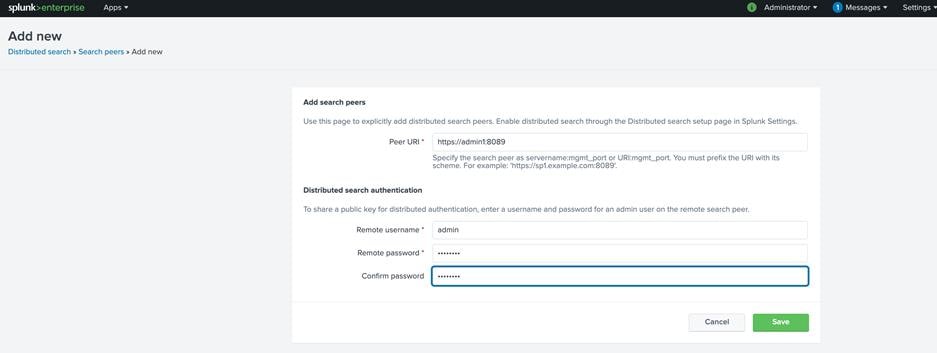
4. Click Save.
5. Add the searchheads (searchhead1, searchhead2, and searchhead3) and admin server admin3 as search peers. The resulting screen should look like the one shown here:
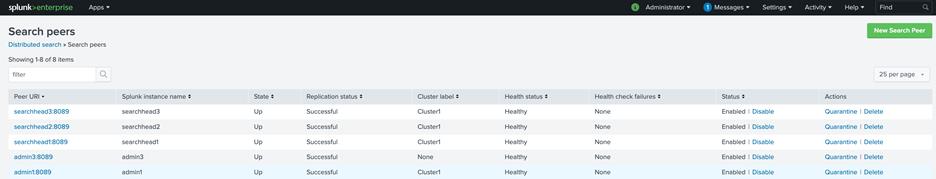
You also need to add the monitoring console admin2 as a search head in the indexer cluster master: here, admin1.
6. Choose Settings > Indexer Clustering.
7. Click Indexer Clustering.
8. In the Enable Clustering dialog box, select Search Head Node.
9. For the master URI, enter https://admin1:8089, and enter for the security key to communicate with the cluster master: here, Ciscoucs.
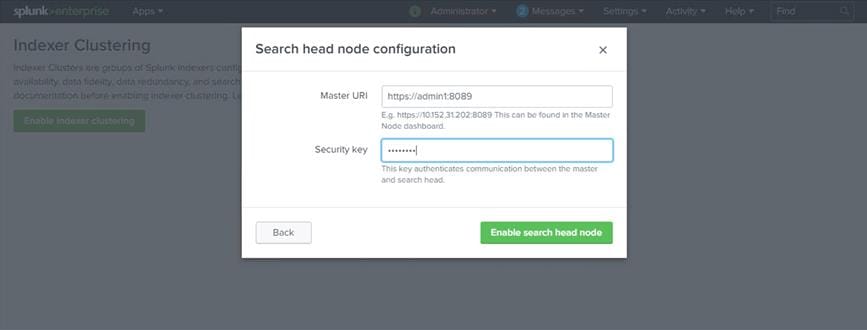
10. Click Enable Search Head Node.
11. Click Restart Now to restart the Splunk instance.
Edit the server roles in the monitoring console general setup
The Monitoring console uses the search heads specified in the list of search peers to determine the status and the cluster topology, so make sure that the server roles are reflected correctly in the monitoring console.
1. From the Splunk Enterprise monitoring console instance, choose Settings > General Setup.
2. Make sure that the server roles of the cluster master (admin1) do not show Search Head checked. The only role that should be checked is Cluster Master.
3. Verify that the search head cluster and indexer cluster labels are correctly identified in the general setup.
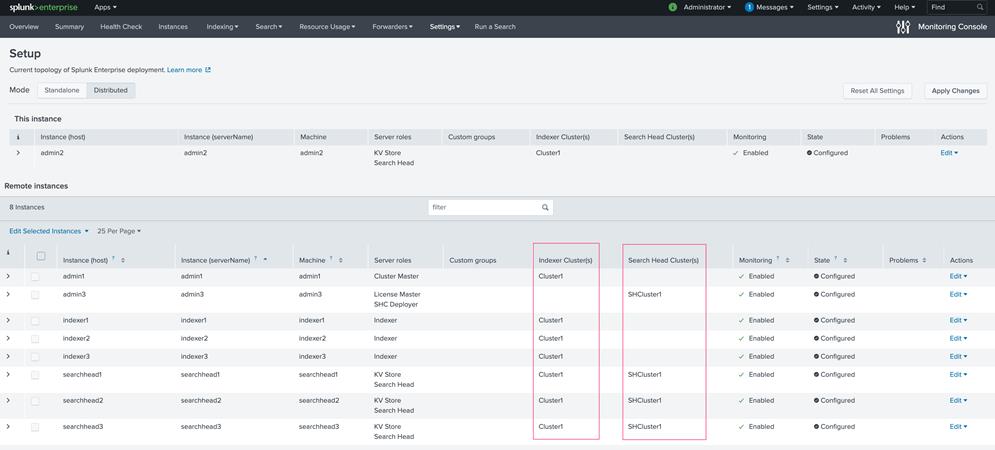
4. If you made any changes, click Apply Changes to save them.
5. Ignore the warning about the Splunk Enterprise instance admin3 having the SHC deployer and license master configured together. The server admin3 is powerful enough to handle these roles.
6. Click Save and choose Overview to view the fully configured monitoring console.
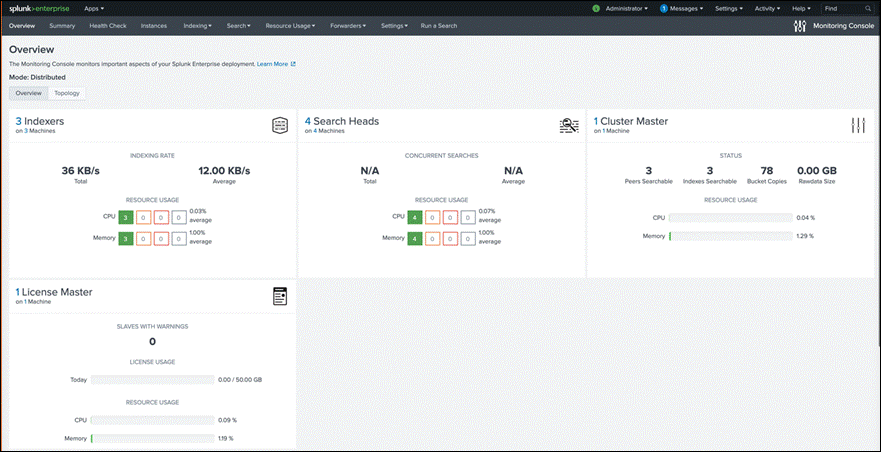
Configure the deployment server
You can configure the server admin2 to function as the deployment server and push a sample Splunk application from the deployment server to a universal forwarder on a test server.
Any Splunk instance can act as a deployment server that assists in maintaining and deploying applications. In particular, the deployment server acts as a central manager for universal forwarders deployed throughout the enterprise.
Any configuration to be pushed to remote instances will be hosted in $SPLUNK_HOME/etc/deployment-apps/.
The following section presents the steps to install a universal forwarder on a machine separate from the servers that make up the Splunk Enterprise platform described in this document. The only requirement for this machine is that it must be reachable through the same network to which the Indexers are connected.
After the machine is connected to the network with connectivity to the Cisco UCS platform, follow the steps presented here.
Note: The deployment server is installed by default when Splunk Enterprise is deployed. In this document, the admin2 server will function as the designated deployment server.
Install a universal forwarder on a test server
First, install a universal forwarder on a test server.
1. Download the Splunk universal forwarder from http://www.splunk.com/download/universalforwarder
2. Install the package as detailed in the documentation for the appropriate operating system of the universal forwarder host.
Register the universal forwarder with the deployment server
Next, register the universal forward with the deployment server.
1. From the command line, access the system hosting the universal forwarder.
2. Navigate to the $SPLUNK_HOME/etc/system/local directory.
3. Create and edit the deploymentclient.conf file with the following content:
clientName = the name or identifier of the host system
targetUri = the hostname/IP and port of the Deployment Server (For example, admin2:8089)
4. As the user splunk, restart the universal forwarder:
$SPLUNK_HOME/bin/splunk restart
Configure an application within the deployment server
Now configure an application within the deployment server.
1. In a browser, navigate to the Splunk instance’s server admin3 web interface (here, https://admin3:8000/).
2. Choose Settings > Distributed Environment > Forwarder Management.
3. Notice the record of the universal forwarder communicating with the deployment server (this step may take up to five minutes due to the polling cycle).
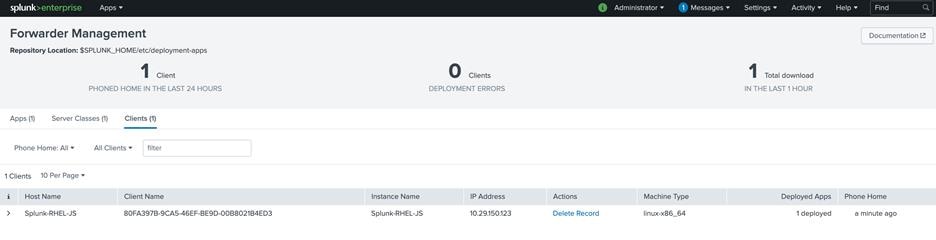
4. Using the command line, navigate to the deployment server, admin3.
5. Navigate to $SPLUNK_HOME/etc/deployment-apps/.
6. Create the directory appTest.
7. Within appTest, create the directory local.
8. Create the file app.conf and include the following contents:
[tcpout]
defaultGroup = search_peers
[tcpout:search_peers]
autoLB = true
forceTimebasedAutoLB = true
server=indexer1:9997,indexer2:9997,indexer3:9997
9. As the splunk user, run the command to reload the deployment server, admin3:
$SPLUNK_HOME/bin/splunk reload deploy-server -auth admin:cisco123
10. Navigate to the web user interface on admin3 (http://admin3:8000) and navigate to Settings > Forwarder Management. Click Apps.
11. No applications have been deployed. Click Server Class.
12. Click Create One and name it TestForwarder.
13. Click Save to create the server class.
14. Click Add Apps.
15. Select the application appTest in the Unselected Apps pane. The application appTest will move to the Selected Apps pane.
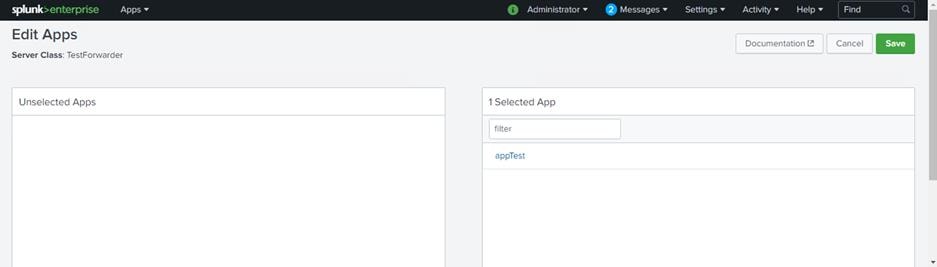
16. Click Save.
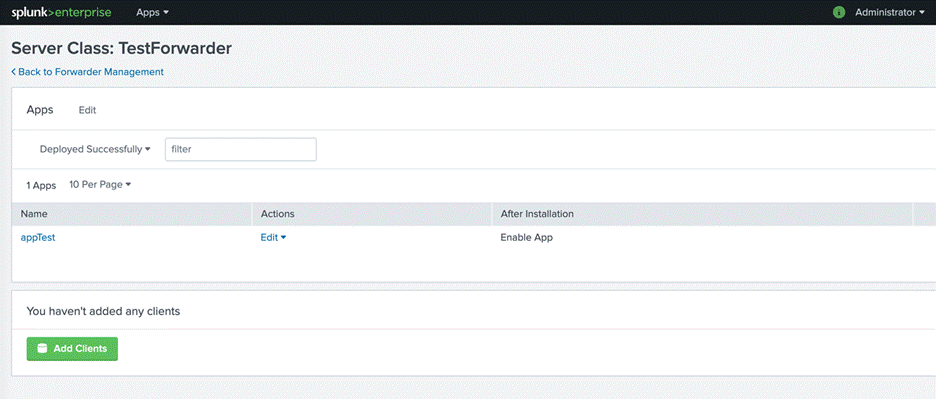
17. Click Add Clients.
18. In the Edit Clients screen, add the client name of the forwarder to the whitelist. In this instance, the client name of the forwarder used is forwarder1.
19. Click Save.
20. Go back to the Forwarder Management screen (choose Settings > Distributed Environment > Forwarder Management). Note the message stating that the application has been deployed successfully.
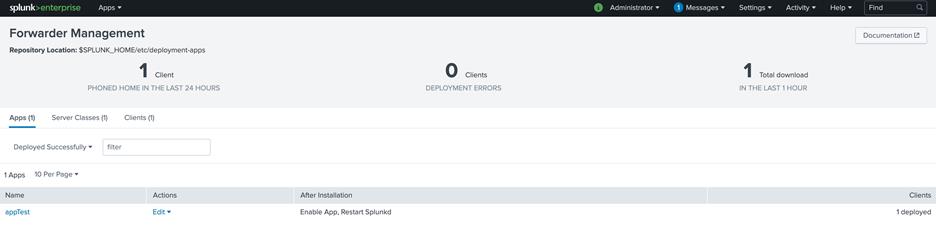
Note: Verify the successful application distribution in the forwarder: here, server1.
21. In the forwarder, server1, use SSH to log in and navigate to $SPLUNK_HOME/etc/apps. List the directory to view the newly deployed application.
Machine data offers a trove of insights, leading to organizational success and efficiency—but mining that data can be complicated without the right data analytics platform. Splunk Enterprise enables customers to derive real-time insights from this data, and the Cisco Intersight platform and the agility, consistency, and resiliency of Cisco UCS servers address the complexities of hardware resource management and the need for rapid deployment and operationalization. Splunk Enterprise with Cisco Intersight and Cisco UCS servers helps organizations more quickly build and maintain a next-generation digital data center that can provide smarter business outcomes.
Integrating the Cisco Intersight platform for Splunk Enterprise provides global visibility of infrastructure health and status along with advanced management and support capabilities. The Cisco Intersight platform delivers a convenient SaaS solution with the capability to connect from anywhere and manage infrastructure through a browser or mobile app while allowing customers to stay ahead of problems and accelerate trouble resolution through advanced support capabilities.
For additional information, see the following resources:
● Cisco Intersight platform: https://intersight.com/help/saas/home
● Splunk: https://docs.splunk.com/Documentation/Splunk/8.2.6/Installation/Whatsinthismanual
● Cisco UCS servers: https://www.cisco.com/site/us/en/products/computing/servers-unified-computing-systems/index.html
● M6 Performance guide: https://www.cisco.com/c/en/us/products/collateral/servers-unified-computing/ucs-b-series-blade-servers/performance-tuning-guide-ucs-m6-servers.pdf
● Cisco UCS C220 M6 specifications: https://www.cisco.com/c/dam/en/us/products/collateral/servers-unified-computing/ucs-c-series-rack-servers/c220m6-sff-specsheet.pdf
● Cisco UCS C240 M6 specifications: https://www.cisco.com/c/dam/en/us/products/collateral/servers-unified-computing/ucs-c-series-rack-servers/c240m6-sff-specsheet.pdf