Cisco UCS C245 M6 Rack Server Disk I/O Characterization
Available Languages
Bias-Free Language
The documentation set for this product strives to use bias-free language. For the purposes of this documentation set, bias-free is defined as language that does not imply discrimination based on age, disability, gender, racial identity, ethnic identity, sexual orientation, socioeconomic status, and intersectionality. Exceptions may be present in the documentation due to language that is hardcoded in the user interfaces of the product software, language used based on RFP documentation, or language that is used by a referenced third-party product. Learn more about how Cisco is using Inclusive Language.
The Cisco UCS® C225 M6 and C245 M6 Rack Server is well-suited for a wide range of storage and I/O-intensive applications such as big data analytics, databases, collaboration, virtualization, and server consolidation. These servers use third-generation (3rd Gen) AMD EPYC CPUs for the most cores per socket. With PCI Express (PCIe) 4.0 for peripherals and 3200-MHz DDR4 memory, these servers provide significant performance and efficiency gains that will improve your application performance.
You can deploy the Cisco UCS C-Series Rack Servers as standalone servers or as part of the Cisco Unified Computing System™ (Cisco UCS) with the Cisco Intersight™ infrastructure service cloud-based management platform. These computing innovations help reduce your total cost of ownership (TCO) and increase business agility.
These improvements deliver significant performance and efficiency gains for your applications. The Cisco UCS C245 M6 also delivers outstanding expandability.
This document outlines the I/O performance characteristics of the Cisco UCS C225 M6 and C245 M6 Rack Server with SAS/SATA SFF SSDs and NVMe SSDs. For Cisco UCS C245 M6 Rack Server, performance for SAS/SATA SSDs is measured using the Cisco® 12 Gbps SAS modular RAID controller with a 4 GB cache module and the Cisco 12 Gbps SAS host bus adapter (HBA). Performance comparisons of solid-state disks (SSDs) with RAID and HBA controllers are presented. The goal of this document is to help customers make well-informed decisions in choosing the right internal disk types and configuring the right controller options to meet their individual I/O workload needs.
Performance data was obtained using the flexible I/O (FIO) measurement tool, with analysis based on the number of I/O operations per second (IOPS) for random I/O workloads and megabytes-per-second (MBps) throughput for sequential I/O workloads. From this analysis, specific recommendations are made for storage configuration parameters.
Many combinations of drive types and RAID levels are possible. For these characterization tests, performance evaluations were limited to small-form-factor (SFF) SSDs with RAID 0, 5, and 10 virtual drives and JBOD configurations.
The widespread adoption of virtualization and data center consolidation technologies has profoundly affected the efficiency of the data center. Virtualization brings new challenges for storage technology, requiring the multiplexing of distinct I/O workloads across a single I/O “pipe.” From a storage perspective, this approach results in a sharp increase in random IOPS. For spinning media disks, random I/O operations are the most difficult to handle, requiring costly seek operations and rotations between microsecond transfers. Not only do the hard disks add a security factor, they also constitute the critical performance components in the server environment. Therefore, it is important to bundle the performance of these components through intelligent technology so that they do not cause a system bottleneck and so that they compensate for any failure of an individual component. RAID technology offers a solution by arranging several hard disks in an array so that any disk failure can be accommodated.
According to conventional wisdom, data center I/O workloads are either random (many concurrent accesses to relatively small blocks of data) or sequential (a modest number of large sequential data transfers). Historically, random access has been associated with transactional workloads, which are the most common type of workload for an enterprise. Currently, data centers are dominated by random and sequential workloads resulting from scale-out architecture requirements in the data center.
Modern technologies such as virtualization, cloud computing, and data consolidation pose new challenges for the data center and require enhanced I/O requests. These enhanced requests lead to increased I/O performance requirements. They also require that data centers fully use available resources so that they can support the newest requirements of the data center and reduce the performance gap observed industrywide.
The following are the major factors leading to an I/O crisis:
● Increasing CPU use and I/O operations: Multicore processors with virtualized server and desktop architectures increase processor use, thereby increasing the I/O demand per server. In a virtualized data center, it is the I/O performance that limits the server consolidation ratio, not the CPU or memory.
● Randomization: Virtualization has the effect of multiplexing multiple logical workloads across a single physical I/O path. The greater the degree of virtualization achieved, the more random the physical I/O requests.
Cisco UCS C225 M6 server models
The Cisco UCS C225 M6 Rack Server is a part of the Cisco UCS portfolio.
Overview
The Cisco UCS® C225 M6 SFF Rack Server extends the capabilities of the Cisco Unified Computing System™ portfolio in a 1-Rack-Unit (RU) form factor with the addition of AMD CPUs as well as 16 DIMM slots per CPU for 3200-MHz DDR4 DIMMs with individual DIMM capacity points up to 128 GB. The maximum memory capacity for two CPUs is 4 TB (for 32 x 128 GB DDR4 DIMMs).
The C225 M6 SFF server has the following characteristics:
Front drives
● Option 1: Up to 10 SAS/SATA drives (up to 4 of the drives can be NVMe)
● Option 2: Up to 10 NVME drives (All drives are NVMe.)
Rear PCIe risers
● One to three half-height PCIe risers, or
● One to two full-height PCIe risers
The server provides an internal slot for one of the following:
● Cisco 12G RAID controller with cache backup to control SAS/SATA drives, or
● Cisco 12G SAS passthrough HBA to control SAS/SATA drives
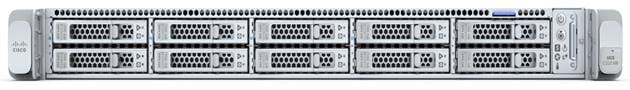
Front view
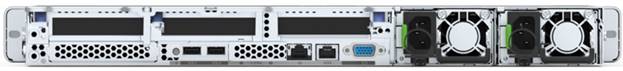
Rear view
Cisco UCS C225 M6 server
Specifications sheet for the C225 M6 is available at https://www.cisco.com/c/dam/en/us/products/collateral/servers-unified-computing/ucs-c-series-rack-servers/c225-m6-sff-specsheet.pdf.
Cisco UCS C245 M6 server models
The Cisco UCS C245 M6 Rack Server is a part of the Cisco UCS portfolio.
Overview
The Cisco UCS C245 M6 SFF server (Figure 1) extends the capabilities of the Cisco UCS portfolio in a two-rack-unit (2RU) form factor with the addition of the 3rd Gen AMD EPYC CPUs and 16 dual-inline-memory-module (DIMM) slots per CPU for 3200-MHz double-data-rate 4 (DDR4) DIMMs with DIMM capacity points of up to 256 GB. The maximum memory capacity for 2 CPUs is 8 TB (for 32 x 256 GB DDR4 DIMMs).
The C245 M6 SFF server has the following characteristics:
● Up to 24 front SFF SAS/SATA hard-disk drives (HDDs) or SSDs (optionally up to four of the drives can be NVMe)
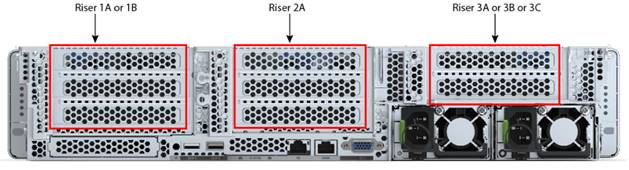
● I/O-centric option that provides up to eight PCIe slots using three rear risers
● Storage-centric option that provides three rear risers with a total of up to four NVMe SFF drives and three PCIe slots
The server provides internal slots for either of the following:
● One Cisco 12 Gbps SAS RAID controller with 4 GB cache backup to control SAS/SATA drives
● Up to two Cisco 12 Gbps SAS HBAs to control SAS/SATA drives
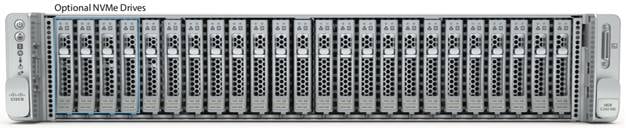
Cisco UCS C245 M6 Rack Server: Front view
A specifications sheet for the C245 M6 is available at https://www.cisco.com/c/dam/en/us/products/collateral/servers-unified-computing/ucs-c-series-rack-servers/c245m6-sff-specsheet.pdf.
SAS/SATA SSD + NVMe IO Performance:
● Cisco UCS C245 M6SX
◦ RAID 0, 5 and 10 with 24-disk configuration for SFF SSDs
◦ JBOD 24-disk configuration with dual HBAs
◦ Combination of 20 RAID 0 SAS and SATA SSDs plus 4 NVMe SSDs
◦ 20 JBOD SAS and SATA SSDs plus 4 NVMe SSDs
◦ 8 NVMe SSDs
We are not including the Disk IO Performance with SAS/SATA SSDs for C225 M6S server due to design/disk/storage adapter similarities to that of C245 M6SX server.
All NVMe IO Performance:
● Cisco UCS C225 M6N
◦ 10 NVMe SSDs
SSDs and NVMe drives used
The tests discussed in this document were based on the following SSD types:
● 960 GB enterprise value 12 Gbps SAS SSD
● 960 GB enterprise value 6 Gbps SATA SSD
● 1.6 TB NVMe high-performance medium-endurance NVMe SSD
● 6.4 TB NVMe high-performance medium-endurance NVMe SSD
Performance
When considering price, you must differentiate between enterprise performance SSDs and enterprise value SSDs. The differences between the two in performance, cost, reliability, and targeted applications are significant. Although it can be appealing to integrate SSDs with NAND flash technology in an enterprise storage solution to improve performance, the cost of doing so on a large scale may be prohibitive.
Virtual disk options
You can configure the following controller options with virtual disks to accelerate write and read performance and provide data integrity:
● RAID level
● Strip (block) size
● Access policy
● Disk cache policy
● I/O cache policy
● Read policy
● Write policy
RAID levels
Table 1 summarizes the supported RAID levels and their characteristics.
Table 1. RAID levels and characteristics
| RAID level |
Characteristics |
Parity |
Redundancy |
| RAID 0 |
Striping of 2 or more disks to achieve optimal performance |
No |
No |
| RAID 1 |
Data mirroring on 2 disks for redundancy with slight performance improvement |
No |
Yes |
| RAID 5 |
Data striping with distributed parity for improved fault tolerance |
Yes |
Yes |
| RAID 6 |
Data striping with dual parity with dual fault tolerance |
Yes |
Yes |
| RAID 10 |
Data mirroring and striping for redundancy and performance improvement |
No |
Yes |
| RAID 50 |
Block striping with distributed parity for high fault tolerance |
Yes |
Yes |
| RAID 60 |
Block striping with dual parity for performance improvement |
Yes |
Yes |
To avoid poor write performance, full initialization is always recommended when creating a RAID 5 or RAID 6 virtual drive. Depending on the virtual disk size, the full initialization process can take a long time based on the drive capacity. Fast initialization is not recommended for RAID 5 and RAID 6 virtual disks.
Stripe size specifies the length of the data segments that the controller writes across multiple drives, not including parity drives. You can configure stripe size as 64, 128, 256, or 512 KB or 1 MB. The default stripe size is 64 KB. The performance characterization tests discussed in this document used a stripe size of 64 KB. With random I/O workloads, no significant difference in I/O performance was observed by varying the stripe size. With sequential I/O workloads, performance gains are possible with a stripe size of 256 KB or larger; however, a stripe size of 64 KB was used for all the random and sequential workloads in the tests.
Strip (block) size versus stripe size
A virtual disk consists of two or more physical drives that are configured together through a RAID controller to appear as a single logical drive. To improve overall performance, RAID controllers break data into discrete chunks called strips that are distributed one after the other across the physical drives in a virtual disk. A stripe is the collection of one set of strips across the physical drives in a virtual disk.
You can set access policy as follows:
● RW: Read and write access is permitted.
● Read Only: Read access is permitted, but write access is denied.
● Blocked: No access is permitted.
You can set disk cache policy as follows:
● Disabled: The disk cache is disabled. The drive sends a data transfer completion signal to the controller when the disk media has actually received all the data in a transaction. This process helps ensure data integrity if a power failure occurs.
● Enabled: The disk cache is enabled. The drive sends a data transfer completion signal to the controller when the drive cache has received all the data in a transaction. However, the data has not actually been transferred to the disk media, so data may be permanently lost if a power failure occurs. Although disk caching can accelerate I/O performance, it is not recommended for enterprise deployments.
You can set I/O cache policy as follows:
● Direct: All read data is transferred directly to host memory, bypassing the RAID controller cache. Any read-ahead data is cached. All write data is transferred directly from host memory, bypassing the RAID controller cache if write-through cache mode is set. The direct policy is recommended for all configurations.
You can set the read policy as follows:
● No read ahead (normal read): Only the requested data is read, and the controller does not read any data ahead.
● Always read ahead: The controller reads sequentially ahead of requested data and stores the additional data in cache memory, anticipating that the data will be needed soon.
You can set the write policy as follows:
● Write through: Data is written directly to the disks. The controller sends a data transfer completion signal to the host when the drive subsystem has received all the data in a transaction.
● Write back: Data is first written to the controller cache memory, and then the acknowledgment is sent to the host. Data is written to the disks when the commit operation occurs at the controller cache. The controller sends a data transfer completion signal to the host when the controller cache has received all the data in a transaction.
● Write back with battery backup unit (BBU): Battery backup is used to provide data integrity protection if a power failure occurs. Battery backup is always recommended for enterprise deployments.
This section provides an overview of the specific access patterns used in the performance tests.
Table 2 lists the workload types tested.
Table 2. Workload types
| Workload type |
RAID type |
Access pattern type |
Read:write (%) |
| Online transaction processing (OLTP) |
5 |
Random |
70:30 |
| Decision-support system (DSS), business intelligence, and video on demand (VoD) |
5 |
Sequential |
100:0 |
| Database logging |
10 |
Sequential |
0:100 |
| High-performance computing (HPC) |
5 |
Random and sequential |
50:50 |
| Digital video surveillance |
10 |
Sequential |
10:90 |
| Big data: Hadoop |
0 |
Sequential |
90:10 |
| Apache Cassandra |
0 |
Sequential |
60:40 |
| Virtual desktop infrastructure (VDI): Boot process |
5 |
Random |
80:20 |
| VDI: Steady state |
5 |
Random |
20:80 |
Tables 3 and 4 list the I/O mix ratios chosen for the sequential access and random access patterns, respectively.
Table 3. I/O mix ratio for sequential access pattern
| I/O mode |
I/O mix ratio (read:write) |
|
| Sequential |
100:0 |
0:100 |
| RAID 0 and 10 |
RAID 0 and 10 |
|
| JBOD* |
JBOD* |
|
*JBOD is configured using HBA.
Table 4. I/O mix ratio for random access pattern
| I/O mode |
I/O mix ratio (read:write) |
|||
| Random |
100:0 |
0:100 |
70:30 |
50:50 |
| RAID 0 |
RAID 0 |
RAID 0 and 5 |
RAID 0 and 5 |
|
| JBOD* |
JBOD* |
JBOD* |
JBOD* |
|
*JBOD is configured using HBA.
Tables 5 and 6 show the recommended virtual drive configuration for SSDs and HDDs, respectively.
Table 5. Recommended virtual drive configuration for SSDs
| Access pattern |
RAID level |
Strip size |
Disk cache policy |
I/O cache policy |
Read policy |
Write policy |
| Random I/O |
RAID 0 |
64 KB |
Unchanged |
Direct |
No read ahead |
Write through |
| Random I/O |
RAID 5 |
64 KB |
Unchanged |
Direct |
No read ahead |
Write through |
| Sequential I/O |
RAID 0 |
64 KB |
Unchanged |
Direct |
No read ahead |
Write through |
| Sequential I/O |
RAID 10 |
64 KB |
Unchanged |
Direct |
No read ahead |
Write through |
Note: Disk cache policy is set as Unchanged because it cannot be modified for virtual drives created using SSD.
Table 6. Recommended virtual drive configuration for HDDs
| Access pattern |
RAID level |
Strip size |
Disk cache policy |
I/O cache policy |
Read policy |
Write policy |
| Random I/O |
RAID 0 |
256 KB |
Disabled |
Direct |
Always read ahead |
Write back good BBU |
| Random I/O |
RAID 5 |
256 KB |
Disabled |
Direct |
Always read ahead |
Write back good BBU |
| Sequential I/O |
RAID 0 |
256 KB |
Disabled |
Direct |
Always read ahead |
Write back good BBU |
| Sequential I/O |
RAID 10 |
256 KB |
Disabled |
Direct |
Always read ahead |
Write back good BBU |
The test configuration was as follows for SAS and SATA SSD with UCS C245 M6SX server:
● Twenty-four RAID 0 virtual drives were created with 24 disks for the SFF SSDs.
● Three RAID 5 virtual drives were created with 8 disks in each virtual drive.
● Six RAID 10 virtual drives were created with 4 disks in each virtual drive.
● The RAID configuration was tested with the Cisco M6 12 Gbps SAS RAID controller with SuperCap and a 4 GB cache module with 24 disks for the SFF SSDs.
● The JBOD configuration was tested with the Cisco 12 Gbps SAS HBA that supports up to 16 drives. The server is configured with dual HBAs, and 12 disks are configured on each HBA (24 disks on two adapters).
● Four 1.6 TB NVMe SSDs were configured on front NVMe slots that have x4 PCIe lanes and are directly managed by CPU and 20 slots were configured with SAS/SATA SSD
● Random workload tests were performed using 4 and 8 KB block sizes for both SAS/SATA and NVMe SSDs.
● Sequential workload tests were performed using 256 KB and 1 MB block sizes for both SAS/SATA and NVMe SSDs.
The test configuration was as follows for NVMe SSDs with UCS C225 M6N and C245 M6SX servers:
● C225 M6N NVMe SKU, all front ten slots were configured with 6.4 TB NVMe SSDs
● C245 M6SX server with 8 NVMe drives, front four slots and rear four slots were populated with 6.4 TB NVMe SSDs
● Random workload tests were performed using 4 and 8 KB block sizes for NVMe SSDs
● Sequential workload tests were performed using 256 KB and 1 MB block sizes for NVMe SSDs
Table 7 lists the recommended FIO settings
Table 7. Recommended FIO settings
| Name |
Value |
| FIO version |
Fio-3.19 |
| File name |
Device name on which FIO tests should run |
| Direct |
For direct I/O, page cache is bypassed. |
| Type of test |
Random I/O or sequential I/O, read, write, or mix of read:write |
| Block size |
I/O block size: 4, 8, or 256 KB or 1 MB |
| I/O engine |
FIO engine: libaio |
| I/O depth |
Number of outstanding I/O instances |
| Number of jobs |
Number of parallel threads to be run |
| Run time |
Test run time |
| Name |
Name for the test |
| Ramp-up time |
Ramp-up time before the test starts |
| Time based |
To limit the run time of the test |
Note: The SSDs were tested with various combinations of outstanding I/O operations and numbers of jobs to get the best performance within an acceptable response time.
Performance data was obtained using the FIO measurement tool on Red Hat Enterprise Linux (RHEL), with analysis based on the IOPS rate for random I/O workloads and MBps throughput for sequential I/O workloads. From this analysis, specific recommendations can be made for storage configuration parameters.
The I/O performance test results capture the maximum IOPS and bandwidth achieved with the SAS/SATA SSDs and NVMe SSDs within the acceptable response time (latency) of 2 milliseconds (ms).
The RAID adapter (UCSC-RAID-M6SD) used in this testing uses Broadcom SAS3916 RAID-on-chip (ROC) with Cub Expander internally. The performance specifications for this SAS3916 ROC is 3 million IOPS for random I/O when used with SAS SSDs. Refer to the Broadcom SAS3916 ROC product brief (https://docs.broadcom.com/doc/12397937) for more information.
Results showed that, for random I/O (read) performance with SAS drives, a rate of more than 3 million IOPS was achieved with 16 SAS drives populated on the server. However, given that the C245 M6SX server allows 24 disks populated in the server, the additional disks augment only extra storage capacity while achieving maximum performance, as captured in this document (see Figure 2 later in this document).
Similarly, for random I/O (read) performance with SATA drives, a rate of 1.46 million IOPS was achieved with 24 SATA drives, a fully populated disk scenario. This result aligns with the IOPS expectation of the storage adapter design for the SATA interface (refer to Figure 8 later in this document).
For sequential I/O workloads (both with SAS and SATA drives), results showed that an adapter maximum of 14,000 MBps was achieved with 14 drives in the case of SAS and 12,800 MBps with 24 drives in the case of SATA, as captured in this document (refer to Figure 2 for SAS and Figure 8 for SATA).
Note: These conclusions are not applicable for SAS HBAs (UCSC-SAS-M6T) because the C245 M6SX is configured with two HBAs and hence overall server performance is calculated using the total number of drives multiplied by the expected single-drive performance.
SAS SSD (960 GB enterprise value 12 Gbps SAS SSD) performance for 24 disk configuration
This section presents the performance results for the SAS SSD configuration with UCS C245 M6SX server.
SAS SSD RAID 0 performance
Figure 2 shows the performance of the SSDs under test for a RAID 0 configuration with 100 percent random read:write operations and 70:30 percent random read:write access patterns. The graph shows the comparative performance values achieved for enterprise value SAS SSD drives to help customers understand the performance. The graph shows that the 960 GB enterprise value SAS drive provides performance of more than 3 million IOPS with latency of 0.3 ms for random read operations, performance of 1.78 million IOPS with latency of 0.2 ms for random write operations, and performance of 3.2 million IOPS with latency of 0.4 ms for 70:30 percent random read:write operations with a 4 KB block size. The result shows the maximum performance achievable from the C245 M6 RAID adapter. Latency is the time taken to complete a single I/O request from the viewpoint of the application.
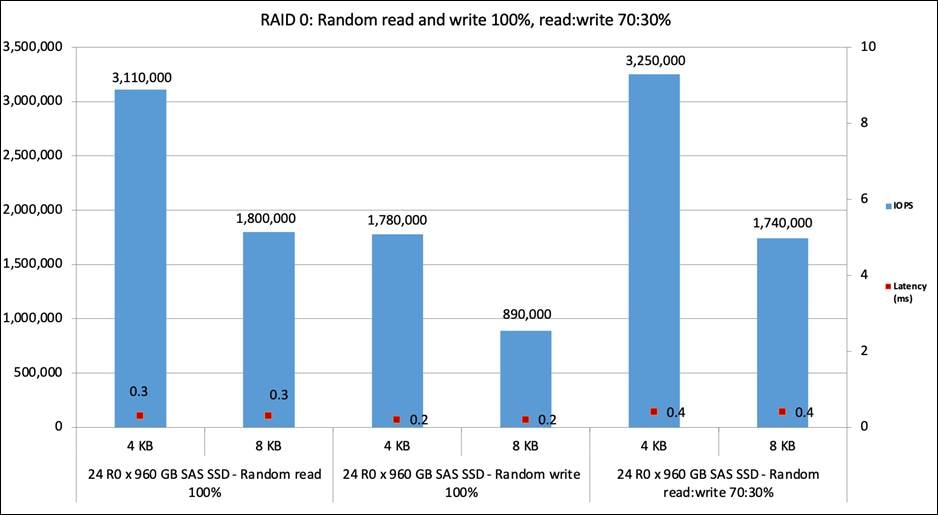
Random read and write 100 percent, random read:write 70:30 percent
Figure 3 shows the performance of the SSDs under test for the RAID 0 configuration with a 100 percent sequential read:write access pattern. The graph shows that the 960 GB enterprise value SAS SSD drive provides performance of close to 15,000 MBps for sequential read operations and more than 14,000 MBps for sequential write operations, with 256 KB and 1 MB block sizes with latency of 2 ms.

Sequential read and write 100 percent
SAS SSD RAID 5 performance
Figure 4 shows the performance of the SSDs under test for the RAID 5 configuration with a 70:30 and 50:50 percent random read:write access pattern. The graph shows the comparative performance values achieved for enterprise value SAS SSD drives to help customers understand the performance for the RAID 5 configuration. The graph shows that the 960 GB enterprise value SAS drive provides performance of close to 800,000 IOPS with latency of 0.6 ms for 70:30 percent random read:write operations and around 480,000 IOPS with latency of 0.6 ms for 50:50 percent random read:write operations with a 4 KB block size.
Each RAID 5 virtual drive was carved out using 8 disks, and a total of 3 virtual drives were created using 24 disks. The performance data shown in the graph is cumulative data collected by running tests on all 3 virtual drives in parallel.
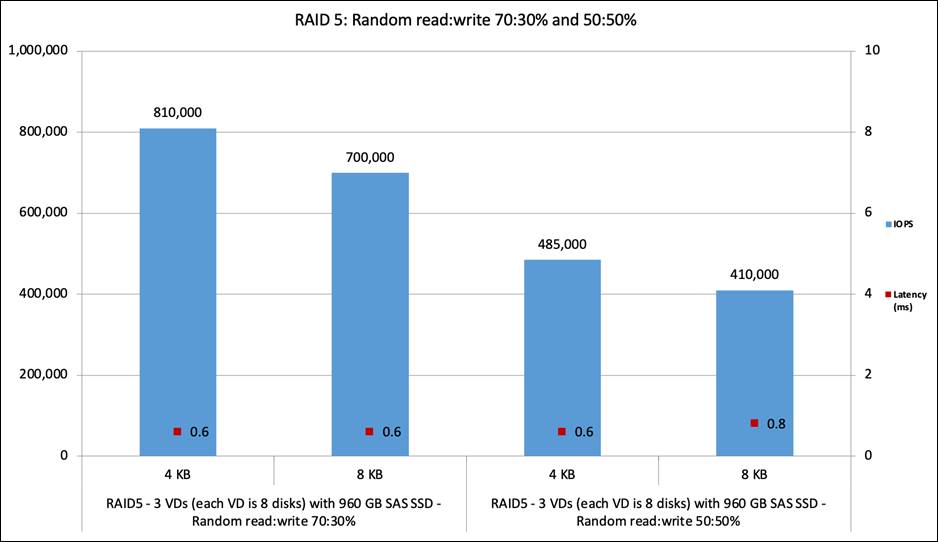
Random read:write 70:30 percent and 50:50 percent
SAS SSD RAID 10 performance
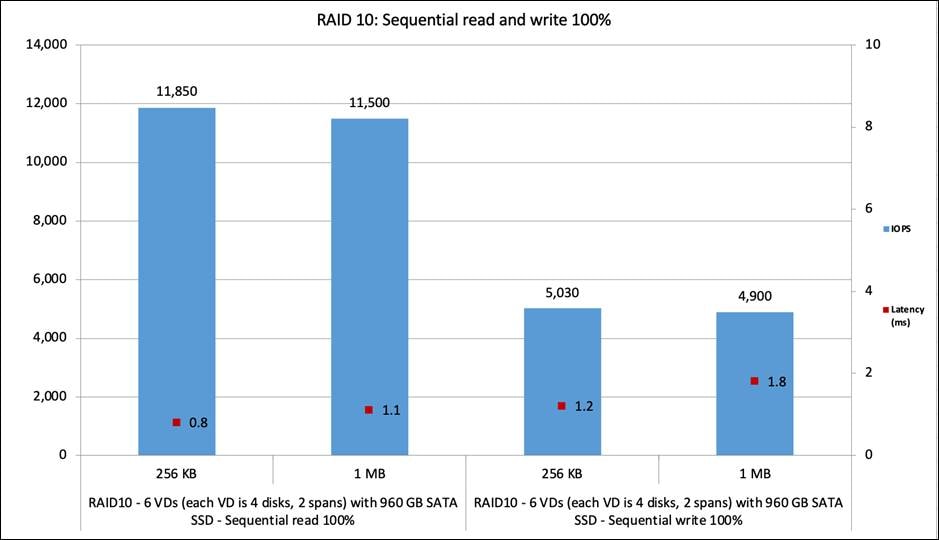
Figure 5 shows the performance of the SSDs under test for the RAID 10 configuration with a 100 percent sequential read:write access pattern. The graph shows the comparative performance values achieved for enterprise value SAS SSD drives to help customers understand the performance for the RAID 10 configuration. The graph shows that the 960 GB enterprise value SAS drive provides performance of close to 15,000 MBps with latency of 0.4 ms for sequential read operations and close to 7,000 MBps with latency of 0.9 ms for sequential write operations with a 256 KB block size.
Each RAID 10 virtual drive was carved out using 4 disks with 2 spans of 2 disks each, and a total of 6 virtual drives were created using 24 disks. The performance data shown in the graph is cumulative data collected by running tests on all 6 virtual drives in parallel.
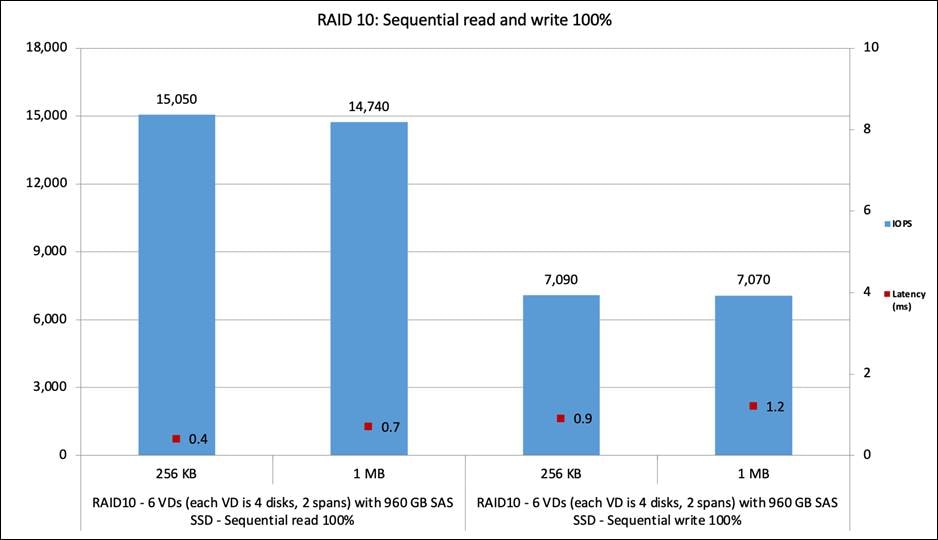
Sequential read and write 100 percent
SAS SSD HBA performance
The C245 M6SX server supports dual 12 Gbps SAS HBAs. Each adapter manages 12 disks on a 24 disk system. This configuration helps scale performance from individual adapters based on the performance specifications of the drives. This dual-adapter configuration is for performance, not for any fault tolerance between adapters.
Figure 6 shows the performance of the SSDs under test for the JBOD configuration with the HBA for the 100 percent random read:write and 70:30 percent random read:write access patterns. The graph shows that the 960 GB enterprise value SAS drive provides performance of close to 5.1 million IOPS with latency of 0.2 ms for random read operations, 1.78 million IOPS with latency of 0.4 ms for random write operations, and 4.6 million IOPS with latency of 0.6 ms for 70:30 percent random read:write operations with a 4 KB block size.
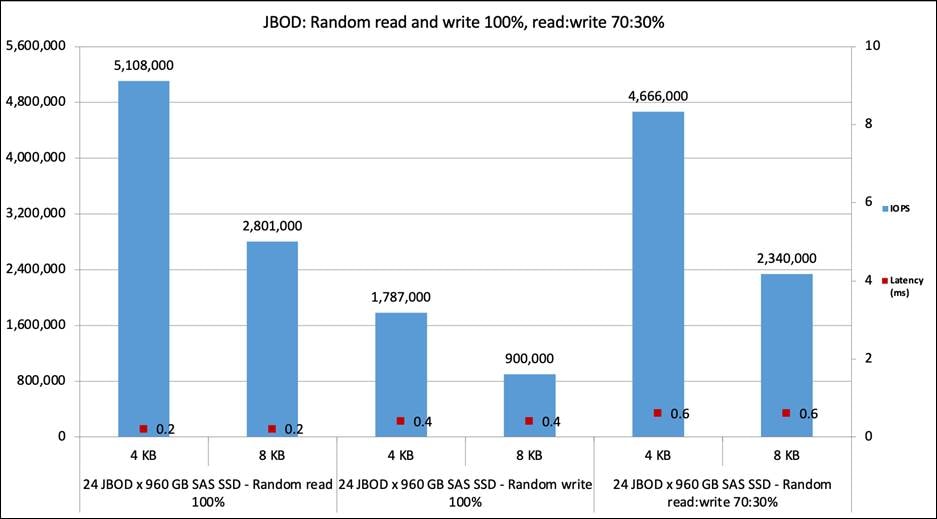
Random read and write 100 percent and random read:write 70:30 percent
Figure 7 shows the performance of the SSDs under test for the JBOD configuration with a 100 percent sequential read:write access pattern. The graph shows that the 960 GB enterprise value SAS SSD drive provides performance of more than 26,000 MBps for sequential read:write operations with 256 KB and 1 MB block sizes with latency of 1.2 ms.
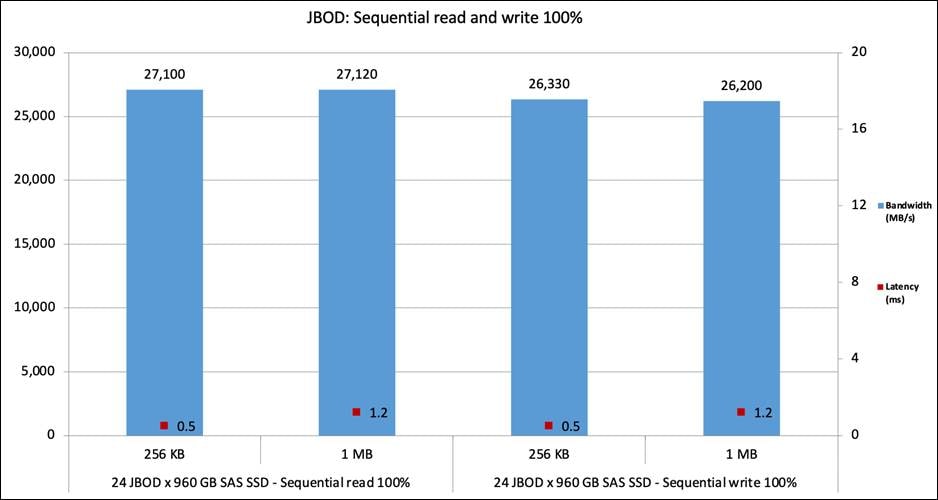
Sequential read and write 100 percent
SATA SSD (960 GB enterprise value 6 Gbps SATA SSD) performance for 24 disk configuration
This section presents the performance results for the SATA SSD configuration with UCS C245 M6SX server
SATA SSD RAID 0 performance
Figure 8 shows the performance of the SSDs under test for the RAID 0 configuration with 100 percent random read:write and 70:30 percent random read:write access patterns. The graph shows the comparative performance values achieved for enterprise value SATA SSD drives to help customers understand the performance for the RAID 0 configuration. The graph shows that the 960 GB enterprise value SATA drive provides performance of 1.46 million IOPS with latency of 0.5 ms for random read operations, close to 700,000 IOPS with latency of 0.4 ms for random write operations, and close to 1.4 million IOPS with latency of 0.5 ms for 70:30 percent random read:write operations with a 4 KB block size. Latency is the time taken to complete a single I/O request from the viewpoint of the application.
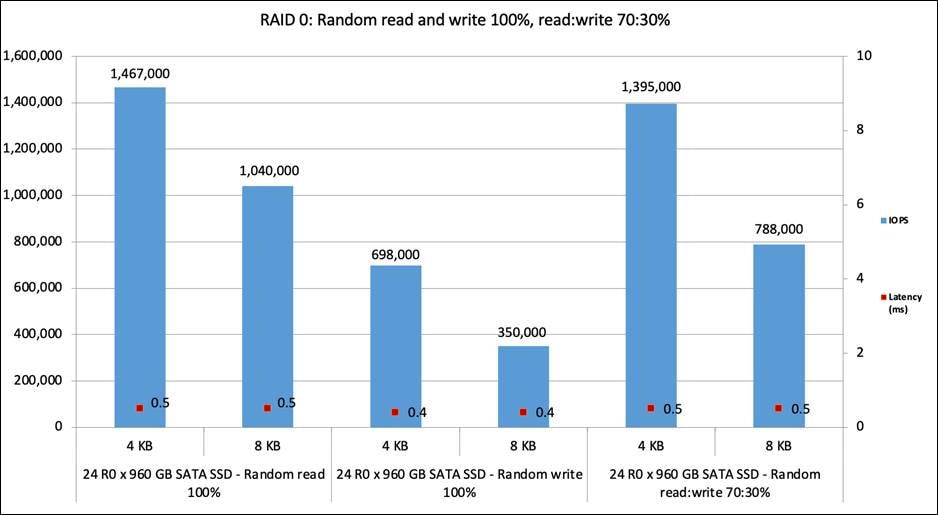
Random read and write 100 percent, random read:write 70:30 percent
Figure 9 shows the performance of the SSDs under test for the RAID 0 configuration with a 100 percent sequential read:write access pattern. The graph shows that the 960 GB enterprise value SATA SSD drive provides performance of more than 12,000 MBps for sequential read operations and more than 10,000 MBps for sequential write operations with latency of 2 ms for 256 KB and 1 MB block sizes.
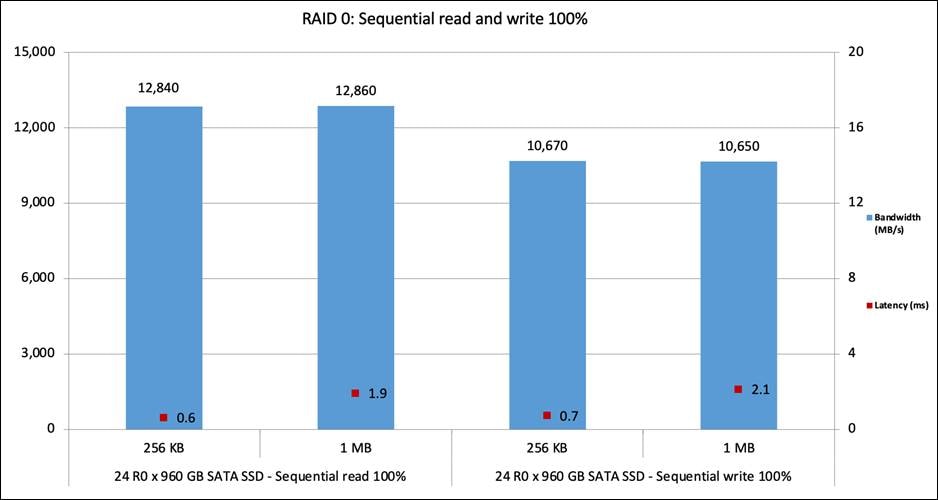
Sequential read and write 100 percent
SATA SSD RAID 5 performance
Figure 10 shows the performance of the SSDs under test for the RAID 5 configuration with 70:30 and 50:50 percent random read:write access patterns. The graph shows the comparative performance values achieved for enterprise value SATA SSD drives to help customers understand the performance for the RAID 5 configuration. The graph shows that the 960 GB SATA drive provides performance of close to 700,000 IOPS with latency of 0.8 ms for 70:30 percent random read:write operations and 480,000 IOPS with latency of 0.8 ms for 50:50 percent random read:write operations with a 4 KB block size.
Each RAID virtual drive was carved out using 8 disks, and a total of 3 virtual drives were created using 24 disks. The performance data shown in the graph is cumulative data collected by running tests on all 3 virtual drives in parallel.
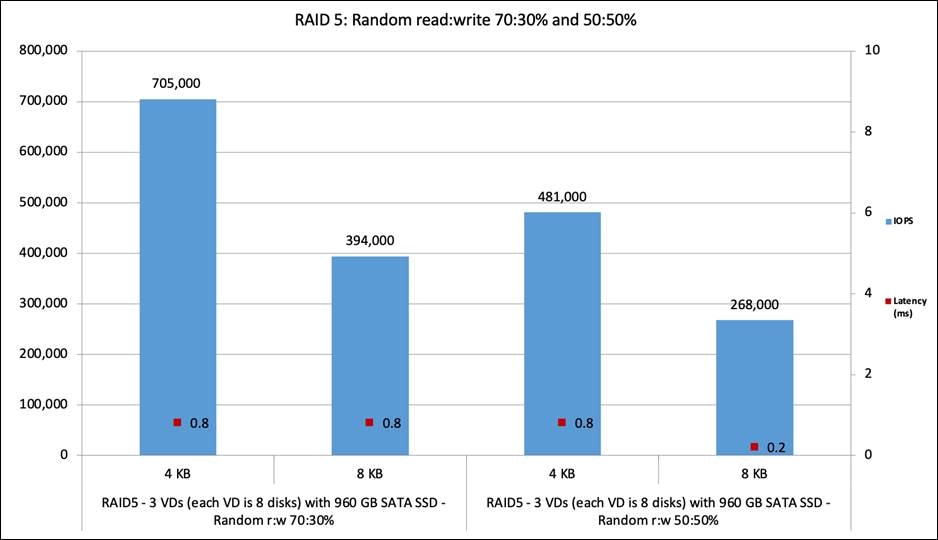
Random read:write 70:30 percent and 50:50 percent
SATA SSD RAID 10 performance
Figure 11 shows the performance of the SSDs under test for the RAID 10 configuration with a 100 percent sequential read and write access pattern. The graph shows the comparative performance values achieved for enterprise value SATA SSD drives to help customers understand the performance for the RAID 10 configuration. The graph shows that the 960 GB SATA drive provides performance of more than 11,0000 MBps for sequential read operations and around 5,000 MBps for sequential write operations with latency of 2 ms for 256 KB and 1 MB block sizes.
Each RAID 10 virtual drive was carved out using 4 disks with 2 spans of 2 disks each, and a total of 6 virtual drives were created using 24 disks. The performance data shown in the graph is cumulative data by running tests on all 6 virtual drives in parallel.
Sequential read and write 100 percent
SATA SSD HBA performance
The C245 M6SX server supports dual 12 Gbps SAS HBAs. Each adapter manages 12 disks on a 24 disk system. This configuration helps in scaling the performance from individual adapters, based on the performance specifications of the drives. This dual-adapter configuration is for performance, not for any fault tolerance between adapters.
Figure 12 shows the performance of the SSDs under test for the JBOD configuration with 100 percent random read and write and 70:30 percent random read:write access patterns. The graph shows that the 960 GB enterprise value SATA drive provides performance of more than 1.86 million IOPS with latency of 0.5 ms for random read operations, close to 700,000 IOPS with latency of 0.4 ms for random write operations, and 1.56 million IOPS with latency of 0.6 ms for 70:30 percent random read:write operations with a 4 KB block size. Latency is the time taken to complete a single I/O request from the viewpoint of the application.
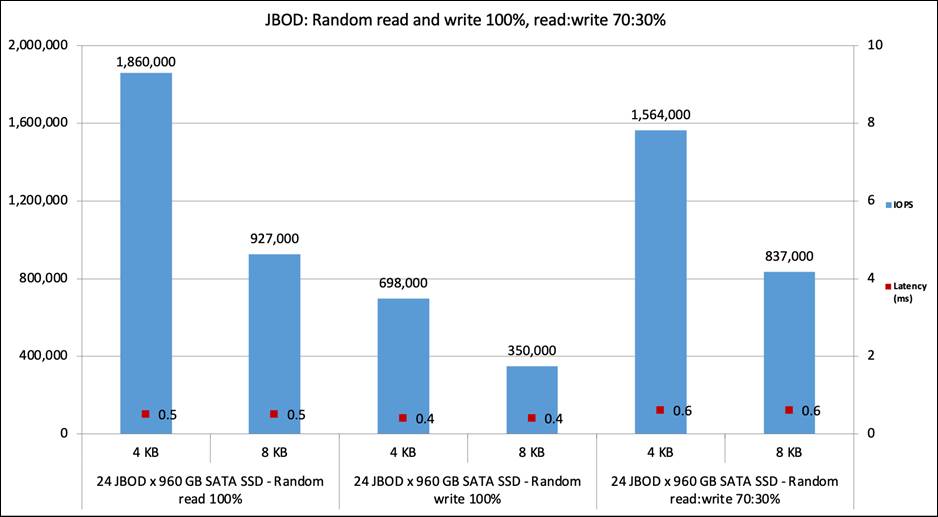
Random read and write 100 percent and random read:write 70:30 percent
Figure 13 shows the performance of the SSDs under test for the JBOD configuration with a 100 percent sequential read:write access pattern. The graph shows that the 960 GB enterprise value SATA SSD drive provides performance of more than 13,000 MBps for sequential read operations and more than 12,000 MBps for sequential write operations with latency of 2 ms for 256 KB and 1 MB block sizes.
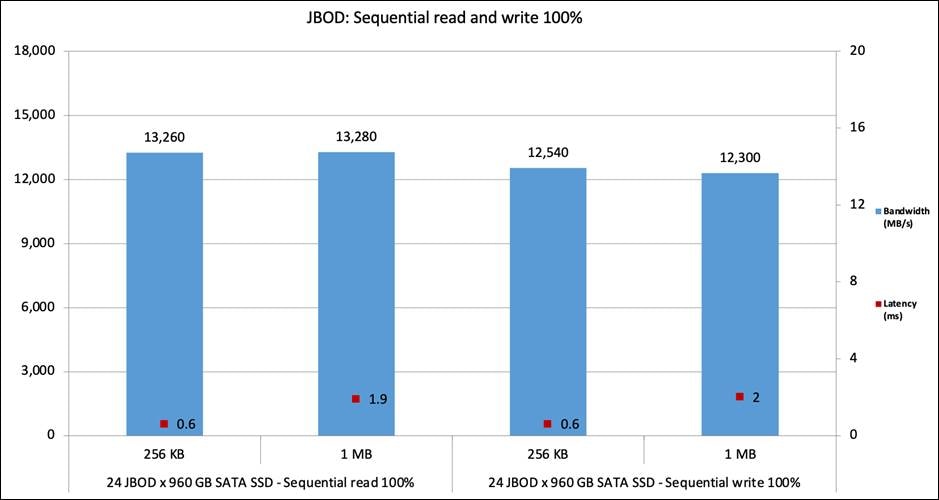
Sequential read and write 100 percent
NVMe and SSD combined performance results
The C245 M6SX server supports up to 8 NVMe SSDs: 4 drives in the first four slots and 4 drives in the rear slots. These NVMe drives are CPU-managed Gen 4 PCIe with x4 lanes. This section shows the performance achieved on the C245 M6SX server with a combination of 4 NVMe SSDs and 24 SAS or 24 SATA SSDs managed by either the RAID adapter or HBA configuration. This information provides insight into the potential overall server performance using a combination of NVMe and SSD drives. The combined performance can be even higher if all four slots are configured with high-performing NVMe SSDs. The configuration with 8 NVMe drives populated is expected to increase overall performance further (this configuration is not within this scope of this document).
For the performance data in the following section of this document, only NVMe SSDs populated on the front four slots are considered with UCS C245 M6SX server.
NVMe and SAS SSD combined performance with RAID
Figure 14 shows the performance of the 4 NVMe SSDs (1.6 TB Intel P5600 NVMe high-performance medium-endurance drives) on the first four front slots and 20 SAS SSDs (960 GB enterprise value 12 Gbps SAS SSDs) on the remaining slots under test for a 100 percent random read access pattern. The graph shows the performance values achieved with a combination of NVMe and SAS SSD drives to help customers understand the performance trade-off when choosing this configuration. SAS SSDs are configured as single-drive RAID 0 volumes (20 R0 volumes). The graph shows that the NVMe SSD provides performance of more than 1.6 million IOPS with latency of 0.5 ms, and the R0 SAS SSD provides performance of 3.1 million IOPS with latency of 0.3 ms for random read operations with a 4 KB block size. Tests on the NVMe and SAS SSDs were run in parallel.
Random read 100 percent
Figure 15 shows the performance of the 4 NVMe SSDs on the first four slots and 20 SAS SSDs on the remaining slots under test for a 100 percent random write access pattern. The graph shows that the 1.6 TB NVMe SSD provides performance of 540,000 IOPS with latency of 0.5 ms, and the R0 SAS SSD provides performance of 1.5 million IOPS with latency of 0.5 ms for random write operations with a 4 KB block size. Tests on the NVMe and SAS SSDs were run in parallel.

Random write 100 percent
Figure 16 shows the performance of the 4 NVMe SSDs on the first four slots and 20 SAS SSDs on the remaining slots under test for a 70:30 percent random read:write access pattern. The graph shows that the NVMe SSD provides performance of 950,000 IOPS with latency of 0.4 ms, and the R0 SAS SSD provides performance of 3.1 million IOPS with latency of 0.5 ms for 70:30 percent random read:write operations with a 4 KB block size. Tests on the NVMe and SAS SSDs were run in parallel.
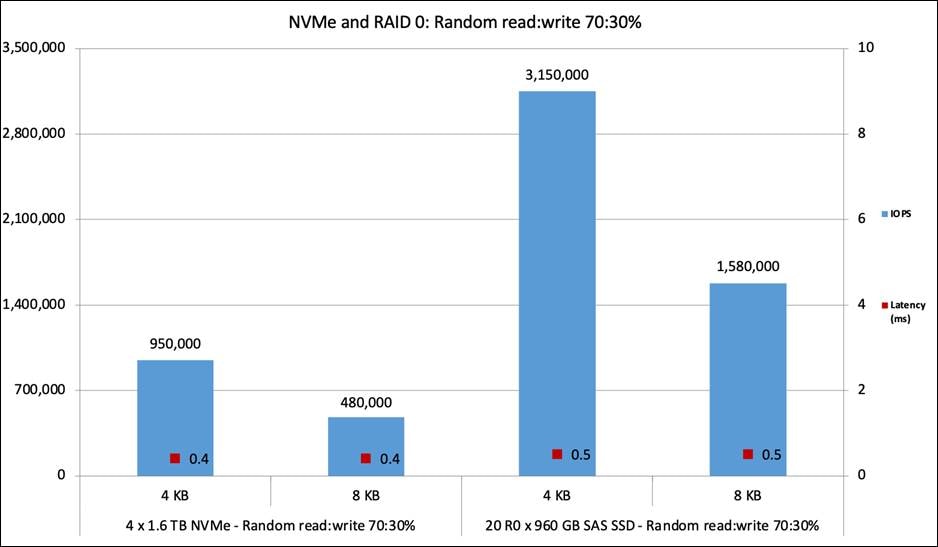
Random read:write 70:30 percent
Figure 17 shows the performance of the 4 NVMe SSDs on the first four slots and 20 SAS SSDs on the remaining slots under test for a 100 percent sequential read access pattern. The graph shows that the NVMe SSD provides performance of more than 14,500 MBps with latency of 0.5 ms, and the R0 SAS SSD provides performance of 14,700 MBps with latency of 0.5 ms for sequential read operations with a 256 KB block size. Tests on the NVMe and SAS SSDs were run in parallel.
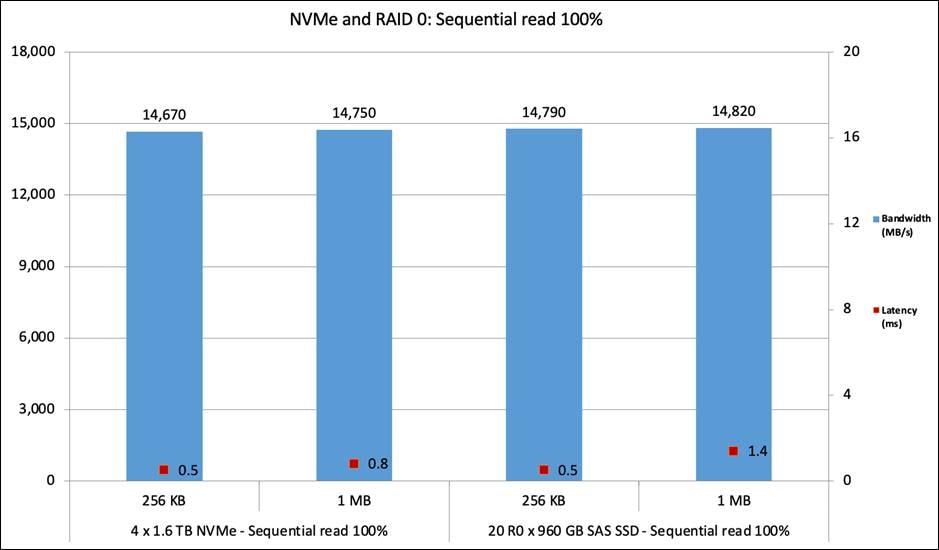
Sequential read 100 percent
Figure 18 shows the performance of the 4 NVMe SSDs on the first four slots and 20 SAS SSDs on the remaining slots under test for a 100 percent sequential write access pattern. The graph shows that the NVMe SSD provides performance of 7,500 MBps with latency of 0.5 ms, and the R0 SAS SSD provides performance of more than 14,000 MBps with latency of 0.4 ms for sequential write operations with a 256 KB block size. Tests on the NVMe and SAS SSDs were run in parallel.
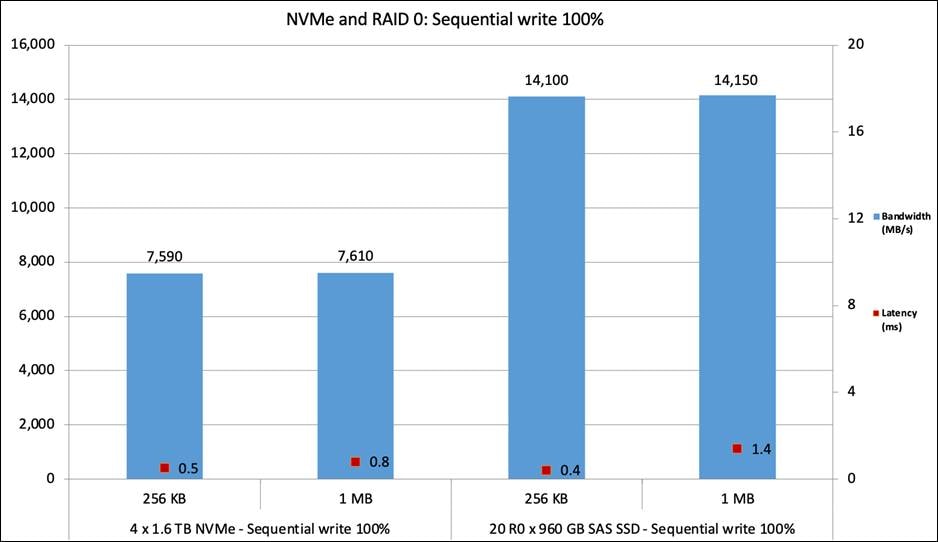
Sequential write 100 percent
NVMe and SAS SSD combined performance with HBA
Figure 19 shows the performance of the 4 NVMe SSDs on the first four slots and 20 SAS SSDs on the remaining slots under test for a 100 percent random read access pattern. The graph shows the performance values achieved with a combination of NVMe and SAS SSDs to help customers understand the performance trade-off when choosing this configuration. SAS SSDs are configured as JBOD managed by an HBA. The graph shows that the 1.6 TB NVMe SSD provides performance of more than 1.6 million IOPS with latency of 0.5 ms, and the JBOD SAS SSD provides performance of 4.2 million IOPS with latency of 0.3 ms for random read operations with a 4 KB block size. Tests on the NVMe and SAS SSDs were run in parallel. SAS SSDs are managed by dual HBAs.
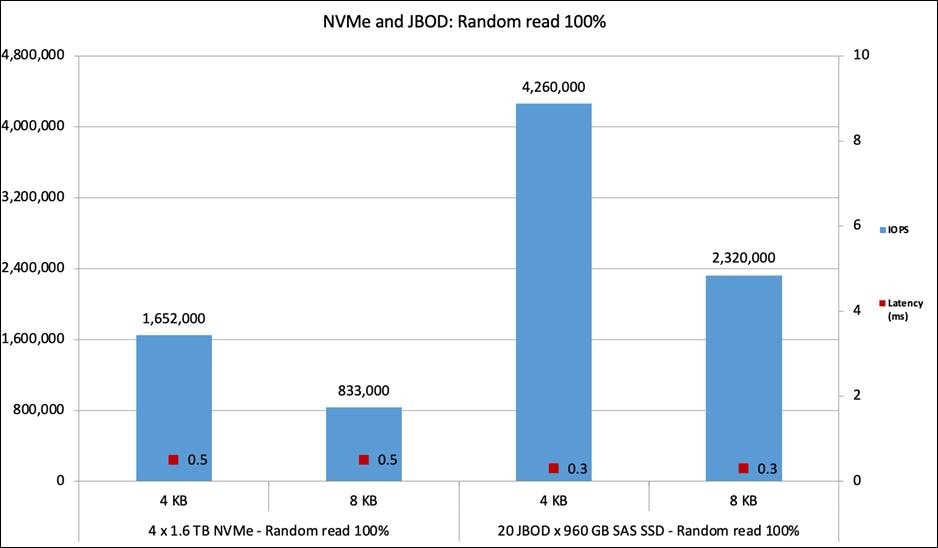
Random read 100 percent
Figure 20 shows the performance of the 4 NVMe SSDs on the first four slots and 20 SAS SSDs on the remaining slots under test for a 100 percent random write access pattern. The graph shows that the 1.6 TB NVMe SSD provides performance of 560,000 IOPS with latency of 0.5 ms, and the JBOD SAS SSD provides performance of 1.47 million IOPS with latency of 0.3 ms for random write operations with a 4 KB block size. Tests on the NVMe and SAS SSDs were run in parallel.
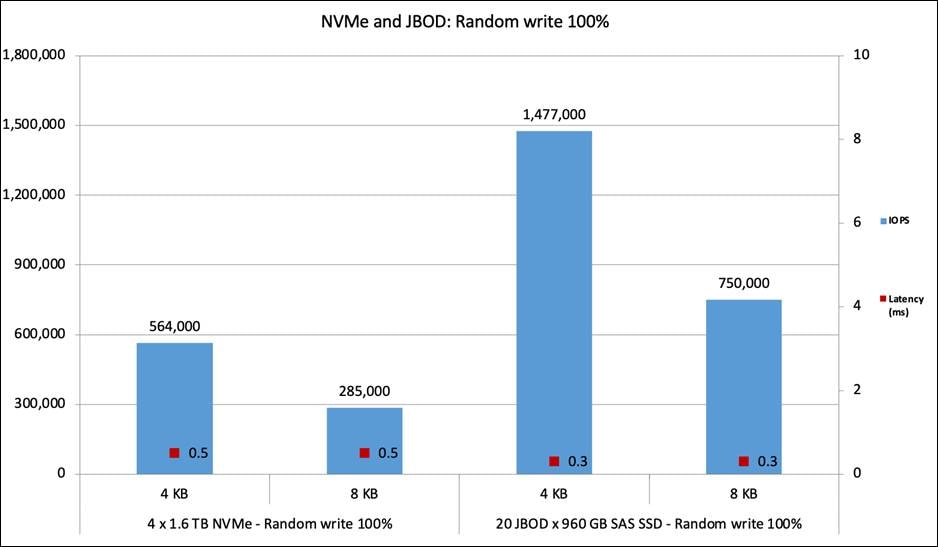
Random write 100 percent
Figure 21 shows the performance of the 4 NVMe SSDs on the first four slots and 20 SAS SSDs on the remaining slots under test for a 70:30 percent random read:write access pattern. The graph shows that the NVMe SSD provides performance of 940,000 IOPS with latency of 0.4 ms, and the JBOD SAS SSD provides performance of 3.8 million IOPS with latency of 0.5 ms for 70:30 percent random read:write operations with a 4 KB block size. Tests on the NVMe and SAS SSDs were run in parallel.
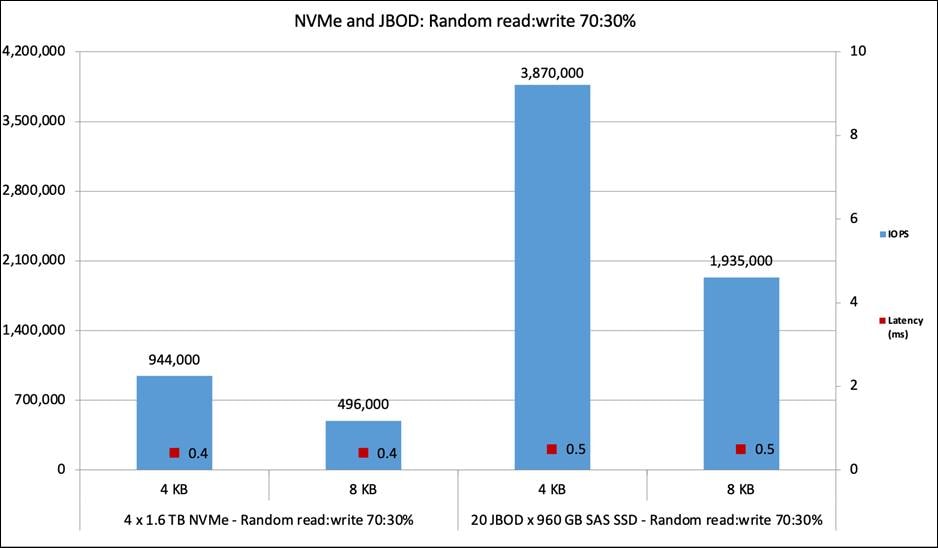
Random read:write 70:30 percent
Figure 22 shows the performance of the 4 NVMe SSDs on the first four slots and 20 SAS SSDs on the remaining slots under test for a 100 percent sequential read access pattern. The graph shows that the NVMe SSD provides performance of 14,500 MBps with latency of 0.5 ms, and the JBOD SAS SSD provides performance of 22,000 MBps with latency of 0.5 ms for sequential read operations with a 256 KB block size. The same performance is observed for the 1 MB block size with a little greater latency. Tests on the NVMe and SAS SSDs were run in parallel.
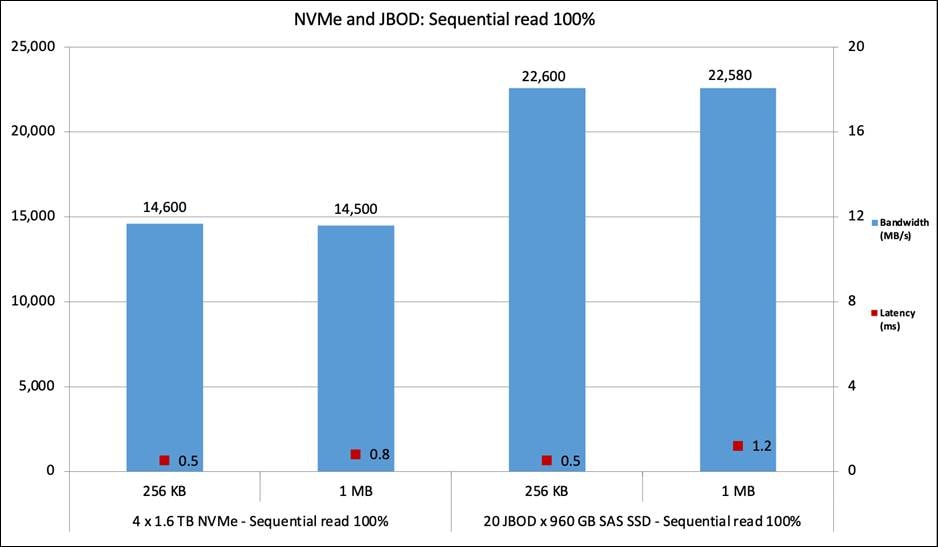
Sequential read 100 percent
Figure 23 shows the performance of the 4 NVMe SSDs on the first four slots and 20 SAS SSDs on the remaining slots under test for a 100 percent sequential write access pattern. The graph shows that the NVMe SSD provides performance of 7,500 MBps with latency of 0.5 ms, and the JBOD SAS SSD provides performance of 21,000 MBps with latency of 0.5 ms for sequential write operations with a 256 KB block size. The same performance is observed for the 1 MB block size with a little greater latency. Tests on the NVMe and SAS SSDs were run in parallel.
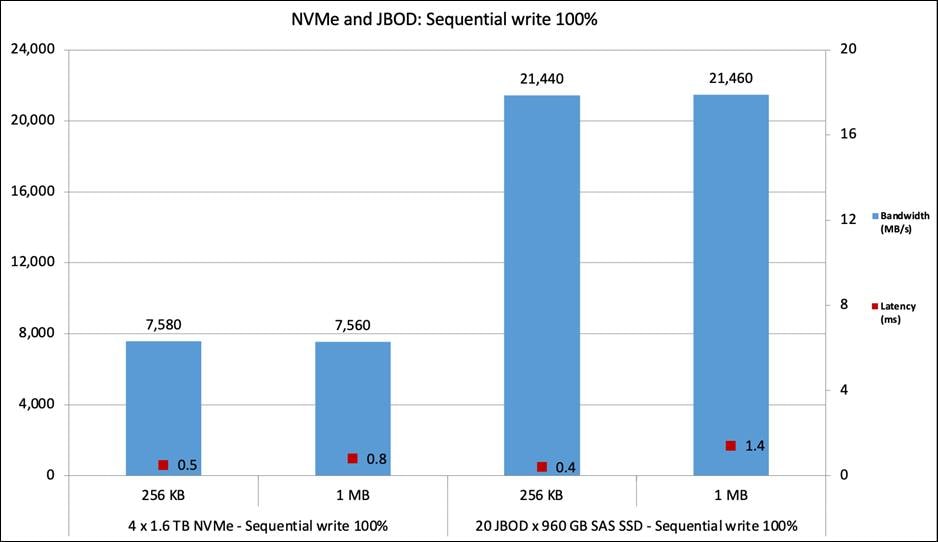
Sequential write 100 percent
NVMe and SATA SSD combined performance with RAID
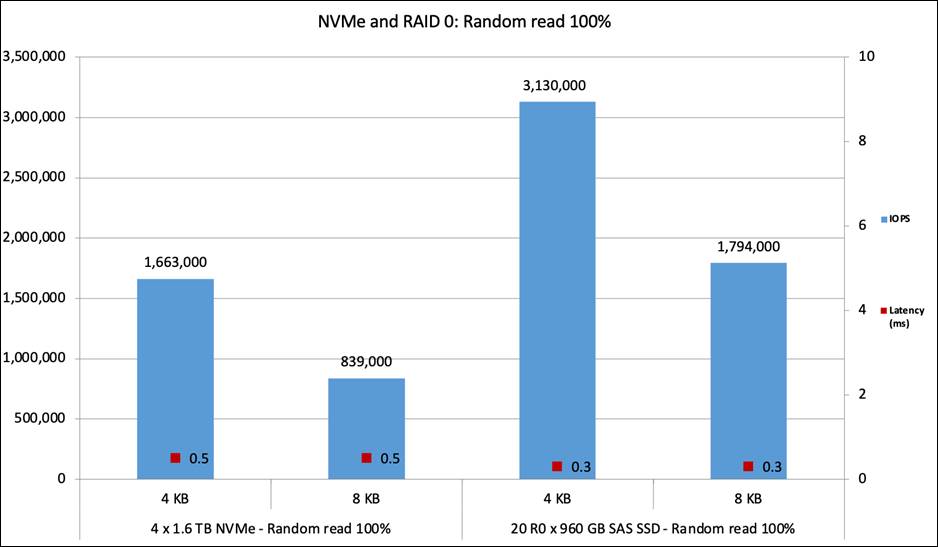
Figure 24 shows the performance of the 4 NVMe SSDs on the first four slots and 20 SATA SSDs on the remaining slots under test for a 100 percent random read access pattern. SATA SSDs are configured as single-drive RAID 0 volumes (24 R0 volumes). The graph shows that the 1.6 TB NVMe SSD provides performance of more than 1.6 million IOPS with latency of 0.4 ms, and the R0 SATA SSD provides performance of 1.35 million IOPS with latency of 0.4 ms for random read operations with a 4 KB block size. Tests on the NVMe and SATA SSDs were run in parallel.
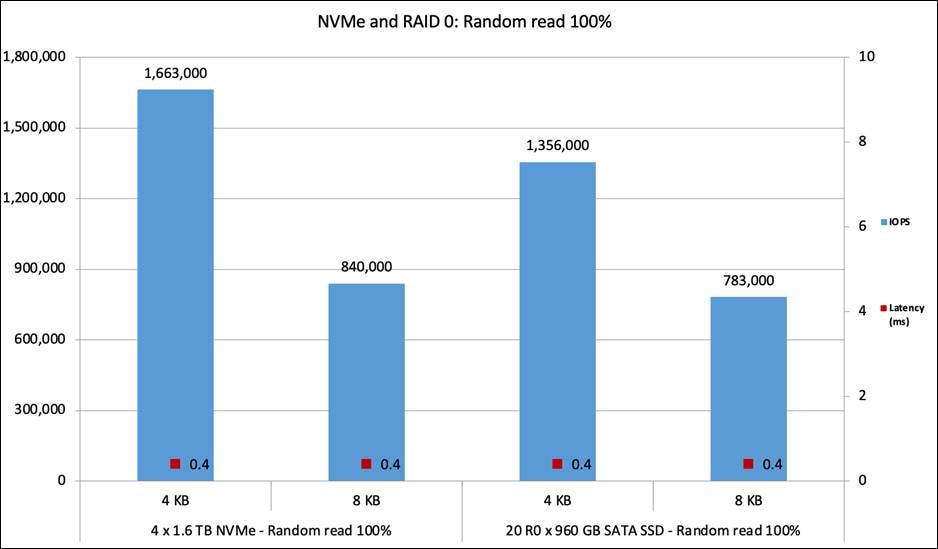
Random read 100 percent
Figure 25 shows the performance of the 4 NVMe SSDs on the first four slots and 20 SATA SSDs on the remaining slots under test for a 100 percent random write access pattern. The graph shows that the 1.6 TB NVMe SSD provides performance of 540,000 IOPS with latency of 0.5 ms, and the R0 SATA SSD provides performance of close to 590,000 IOPS with latency of 0.5 ms for random write operations with a 4 KB block size. Tests on the NVMe and SATA SSDs were run in parallel.
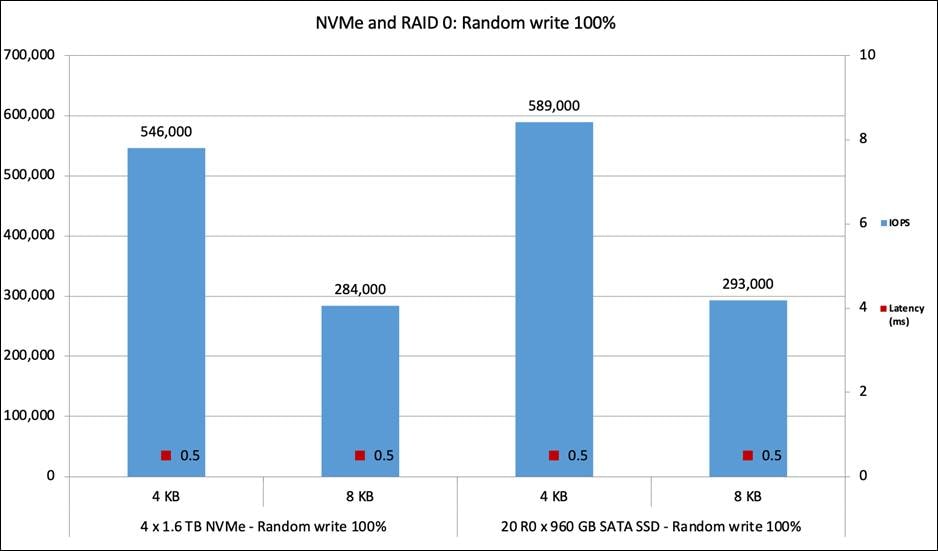
Random write 100 percent
Figure 26 shows the performance of the 4 NVMe SSDs on the first four slots and 20 SATA SSDs on the remaining slots under test for a 70:30 percent random read:write access pattern. The graph shows that the NVMe SSD provides performance of 950,000 IOPS with latency of 0.4 ms, and the R0 SATA SSD provides performance of 1.2 million IOPS with latency of 0.5 ms for 70:30 percent random read:write operations with a 4 KB block size. Tests on the NVMe and SATA SSDs were run in parallel.
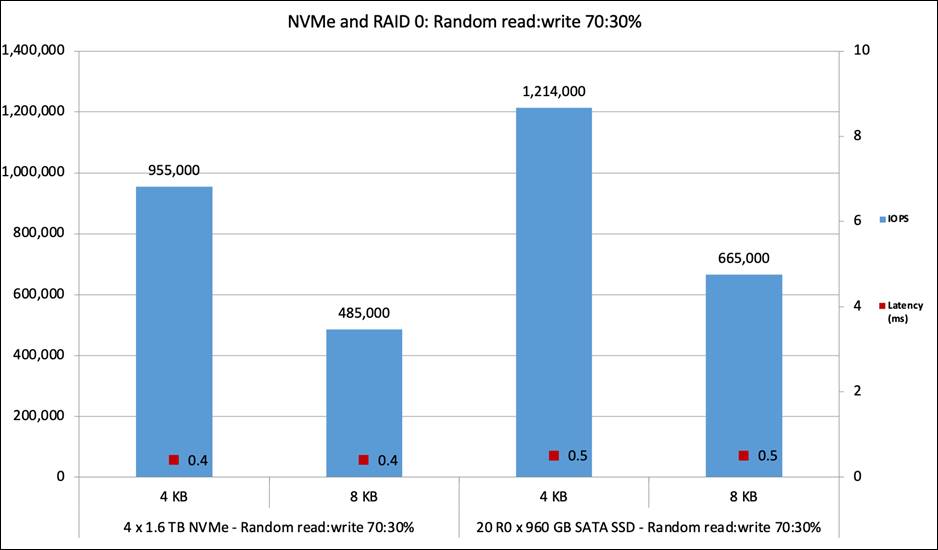
Random read:write 70:30 percent
Figure 27 shows the performance of the 4 NVMe SSDs on the first four slots and 20 SATA SSDs on the remaining slots under test for a 100 percent sequential read access pattern. The graph shows that the NVMe SSD provides performance of 14,800 MBps with latency of 0.7 ms, and the R0 SATA SSD provides performance of close to 10,800 MBps with latency of 0.6 ms for sequential read operations with a 256 KB block size. Tests on the NVMe and SATA SSDs were run in parallel.
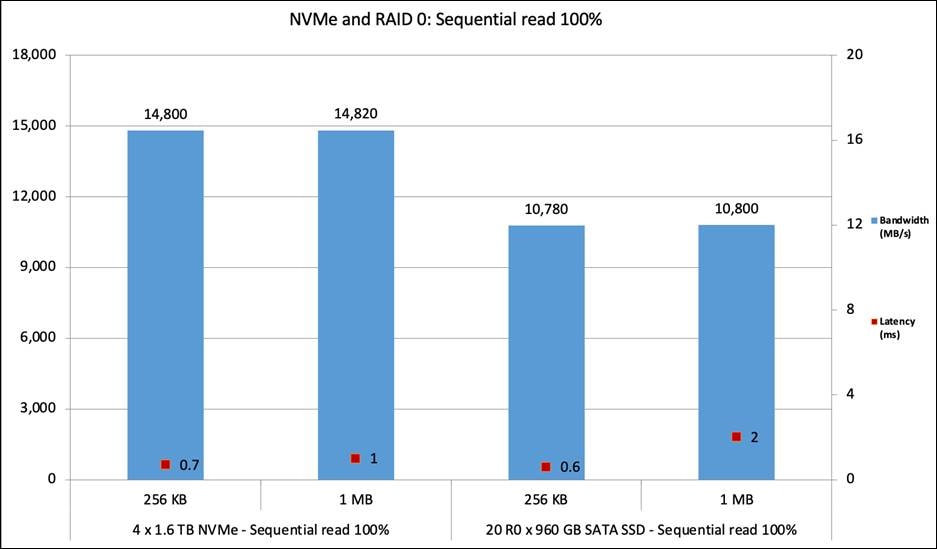
Sequential read 100 percent
Figure 28 shows the performance of the 4 NVMe SSDs on the first four slots and 20 SATA SSDs on the remaining slots under test for a 100 percent sequential write access pattern. The graph shows that the NVMe SSD provides performance of 7,600 MBps with latency of 0.2 ms, and the R0 SATA SSD provides performance of 8,800 MBps with latency of 0.7 ms for sequential write operations with a 256 KB block size. Tests on the NVMe and SATA SSDs were run in parallel.
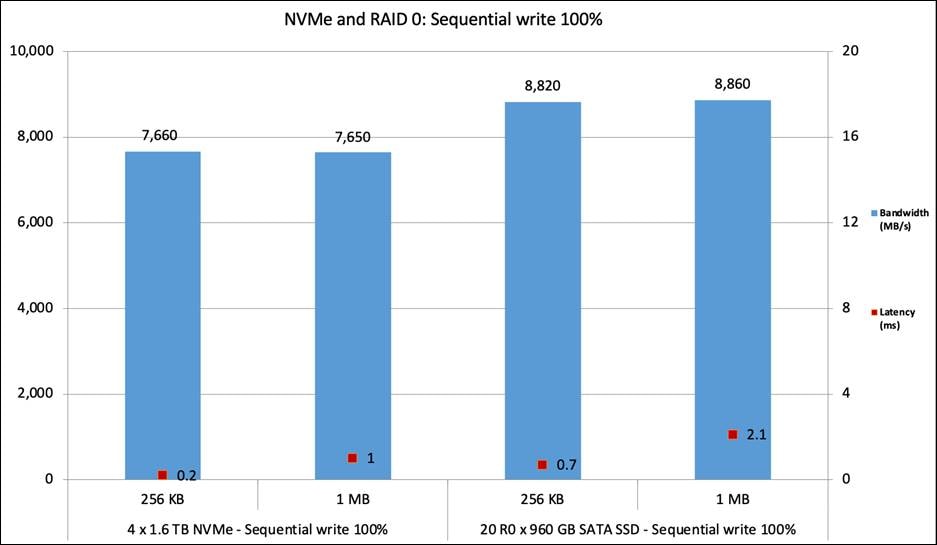
Sequential write 100 percent
NVMe and SATA SSD combined performance with HBA
Figure 29 shows the performance of the 4 NVMe SSDs on the first four slots and 20 SATA SSDs on the remaining slots under test for a 100 percent random read access pattern. SATA SSDs are configured as JBOD managed by an HBA. The graph shows that the 1.6 TB NVMe SSD provides performance of more than 1.6 million IOPS with latency of 0.5 ms, and the JBOD SATA SSD provides performance of 1.55 million IOPS with latency of 0.4 ms for random read operations with a 4 KB block size. Tests on the NVMe and SATA SSDs were run in parallel. SATA SSDs are managed by dual HBAs.
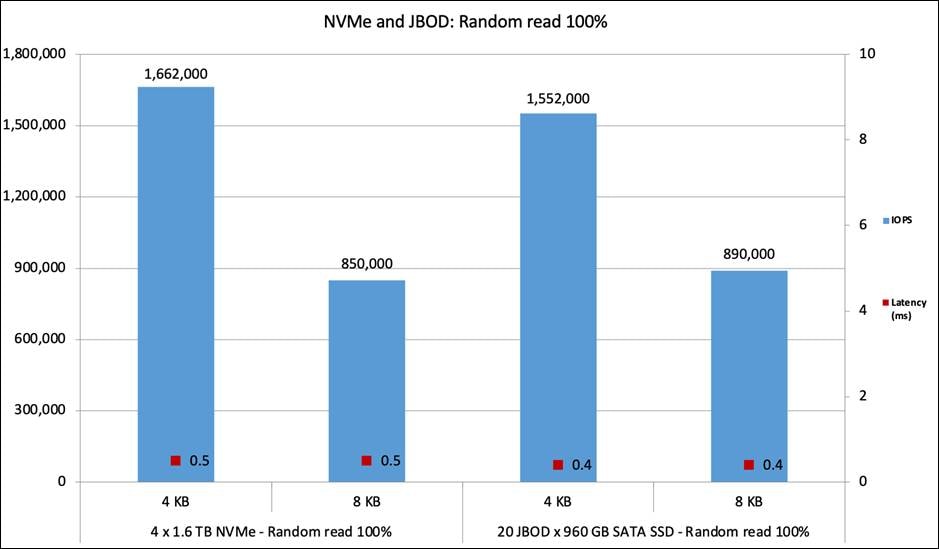
Random read 100 percent
Figure 30 shows the performance of the 4 NVMe SSDs on the first four slots and 20 SATA SSDs on the remaining slots under test for a 100 percent random write access pattern. The graph shows that the 1.6 TB NVMe SSD provides performance of 570,000 IOPS with latency of 0.5 ms, and the JBOD SATA SSD provides performance of 580,000 IOPS with latency of 0.5 ms for random write operations with a 4 KB block size. Tests on the NVMe and SATA SSDs were run in parallel.
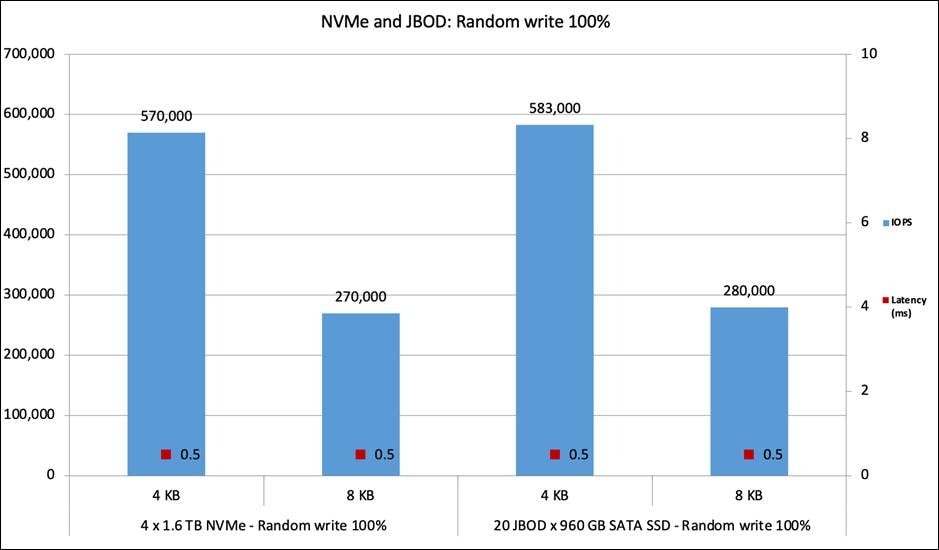
Random write 100 percent
Figure 31 shows the performance of the 4 NVMe SSDs on the first four slots and 20 SATA SSDs on the remaining slots under test for a 70:30 percent random read:write access pattern. The graph shows that the NVMe SSD provides performance of 940,000 IOPS with latency of 0.4 ms, and the JBOD SATA SSD provides performance of 1.3 million IOPS with latency of 0.6 ms for 70:30 percent random read:write operations with a 4 KB block size. Tests on the NVMe and SATA SSDs were run in parallel.
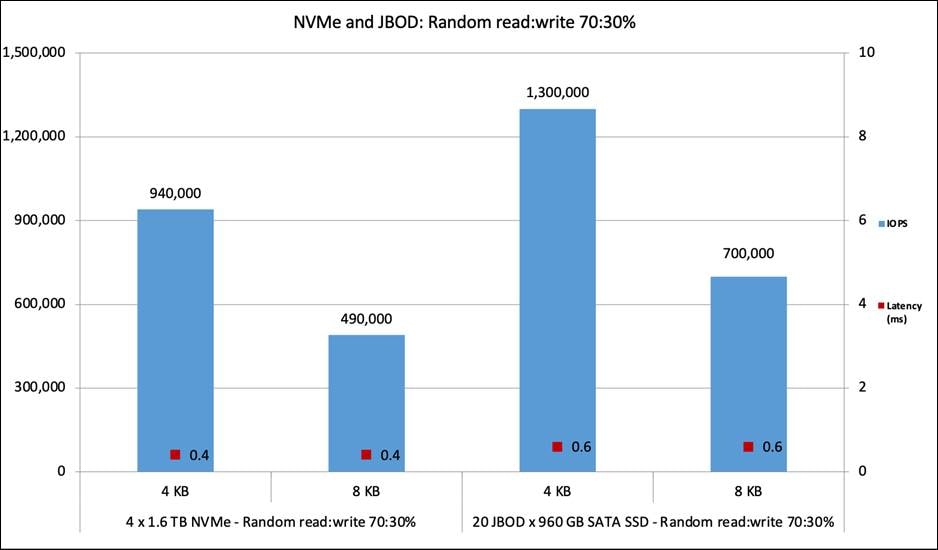
Random read:write 70:30 percent
Figure 32 shows the performance of the 4 NVMe SSDs on the first four slots and 20 SATA SSDs on the remaining slots under test for a 100 percent sequential read access pattern. The graph shows that the NVMe SSD provides performance of 14,700 MBps with latency of 0.5 ms, and the JBOD SATA SSD provides performance of 10,700 MBps with latency of 0.5 ms for sequential read operations with a 256 KB block size. Tests on the NVMe and SATA SSDs were run in parallel.
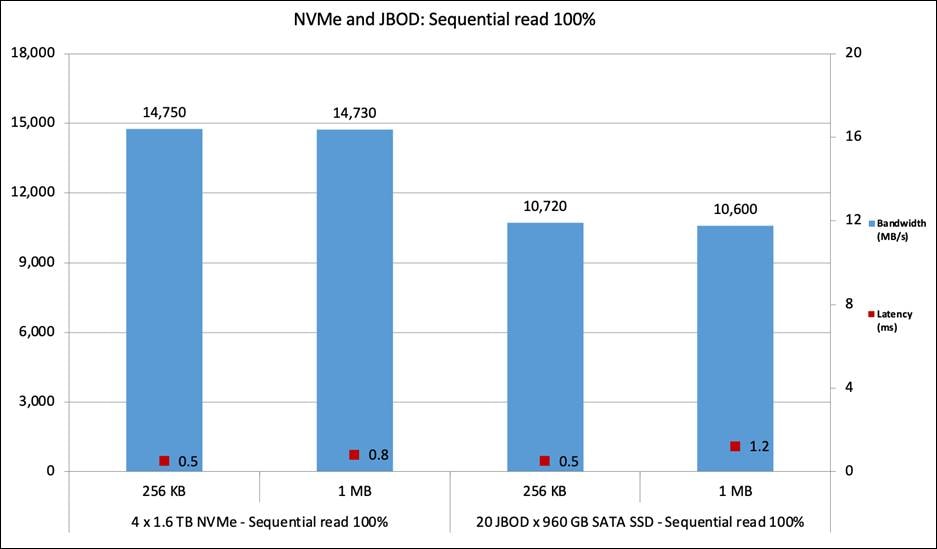
Sequential read 100 percent
Figure 33 shows the performance of the 4 NVMe SSDs on the first four slots and 20 SATA SSDs on the remaining slots under test for a 100 percent sequential write access pattern. The graph shows that the NVMe SSD provides performance of 7,500 MBps with latency of 0.5 ms, and the JBOD SATA SSD provides performance of 9,500 MBps with latency of 0.5 ms for sequential write operations with a 256 KB block size. Tests on the NVMe and SATA SSDs were run in parallel.
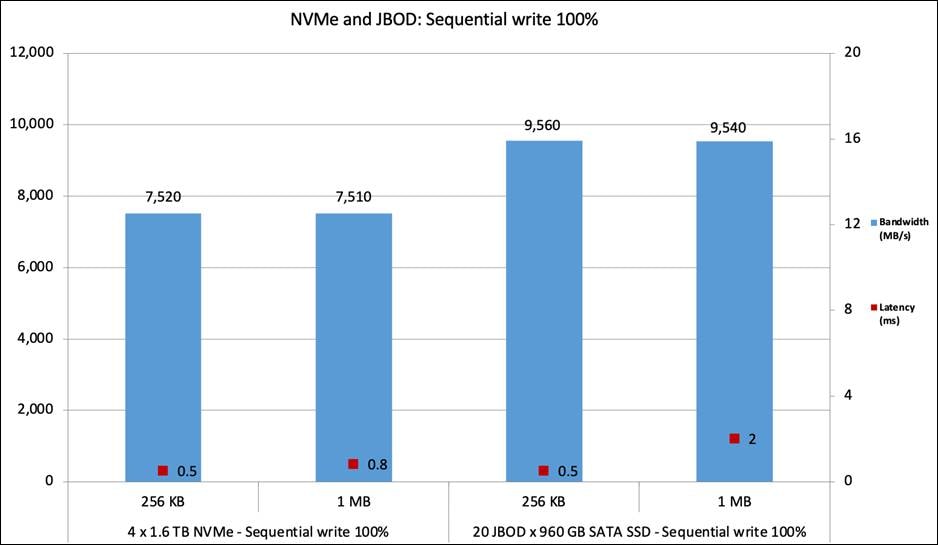
Sequential write 100 percent
The I/O performance test results capture the maximum read IOPS rate and bandwidth achieved with the NVMe SSDs within the best possible response time (latency) and is measured in micro-seconds (ms).
C225 M6N server allows single CPU configuration (in addition to two CPU configurations) and all NVMe drives are managed by the CPU1. High performing NVMe drives might not give the maximum performance (proportional to the drive specifications) in C225 M6N server, given x2 PCIe lanes allotted for each drive (this is done to permit single CPU configurations). In the case of C245 M6SX (which allows only dual CPU configuration), each NVMe drive gets x4 PCIe lanes and are managed by both CPUs and it supports four NVMe drives on front and four drives at rear slots.
Also, one needs to keep in mind that NVMe drives are connected to the CPU and hence high IO operations can consume significant CPU usage unlike the regular SSDs which are typically managed by storage adapters (RAID / HBA cards).
These factors need to be considered while planning for performance expectations from NVMe drives.
NVMe performance on C225 M6N with ten-disk configuration
Figure 35 shows the performance of the 10 NVMe SSDs (6.4 TB Intel P5600 NVMe high-performance medium endurance) on front slots for a 100-percent random read and random write, 70:30 percent random read:write access pattern on C225 M6N server. The graph shows that the 6.4 TB NVMe drive provides performance of 7.9M IOPS with latency of 240 microseconds for random read, performance of 2.6M IOPS with latency of 150 microseconds for random write, and performance of 5.2M IOPS with latency of 250 microseconds for random read:write 70:30 percent with a 4 KB block size.
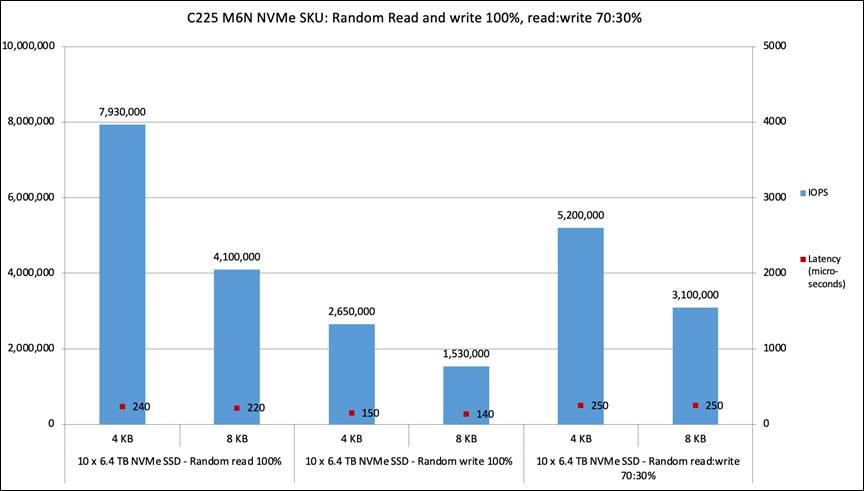
Random read and write 100%; read:write 70:30%
Figure 36 shows the performance of the ten NVMe SSDs for a 100-percent sequential read and sequential write access pattern. The graph shows that the 6.4 TB high performance medium endurance NVMe drive provides performance of 34,000 MBps with latency of 750 microseconds for sequential read and 34,000 MBps with latency of 200 microseconds for sequential write with a 256 KB block size. Performance is almost similar for 1 MB block size with a slight increase in latency.
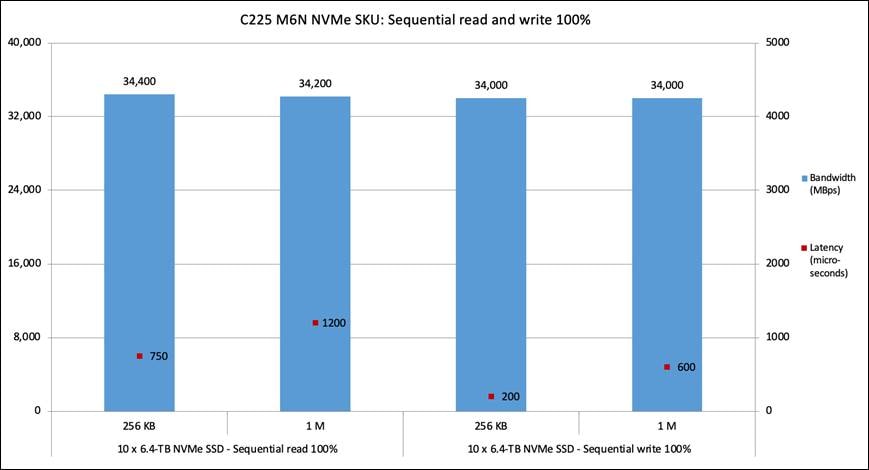
Sequential read and write 100%
Figure 37 shows the performance of the 8 NVMe SSDs (6.4 TB Intel P5600 NVMe high-performance medium endurance), four drives on front slots and four on rear slots for a 100-percent random read and random write, 70:30 percent random read:write access pattern. The graph shows that eight of 6.4 TB NVMe drive provides performance of 7.9 million IOPS with latency of 240 microseconds for random read, performance of 2.1 million IOPS with latency of 210 microseconds for random write, and performance of 4.2 million IOPS with latency of 280 microseconds for random read:write 70:30 percent with a 4 KB block size.
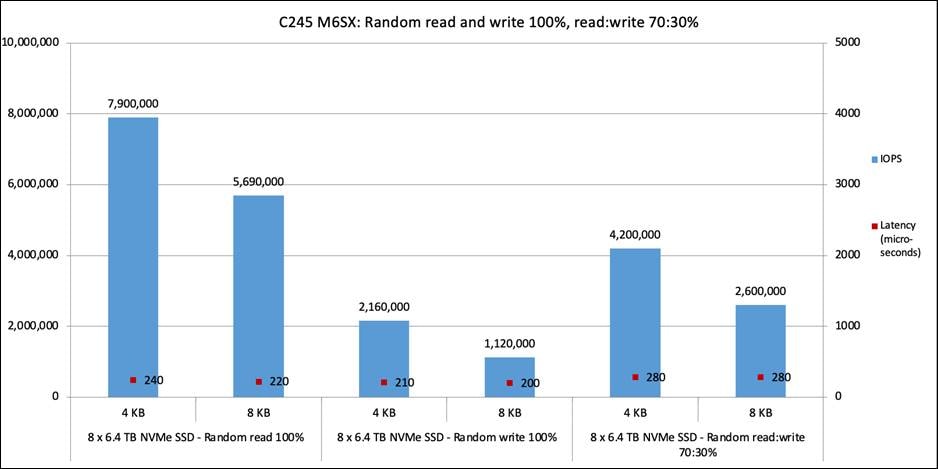
Random read and write 100%; read:write 70:30%
Figure 38 shows the performance of the eight NVMe SSDs for a 100-percent sequential read and sequential write access pattern. The graph shows that the 6.4 TB high performance medium endurance NVMe drive provides performance of 56,000 MBps with latency of 710 microseconds for sequential read and 34,000 MBps with latency of 270 microseconds for sequential write with a 256 KB block size. Performance is almost similar for 1 MB block size.
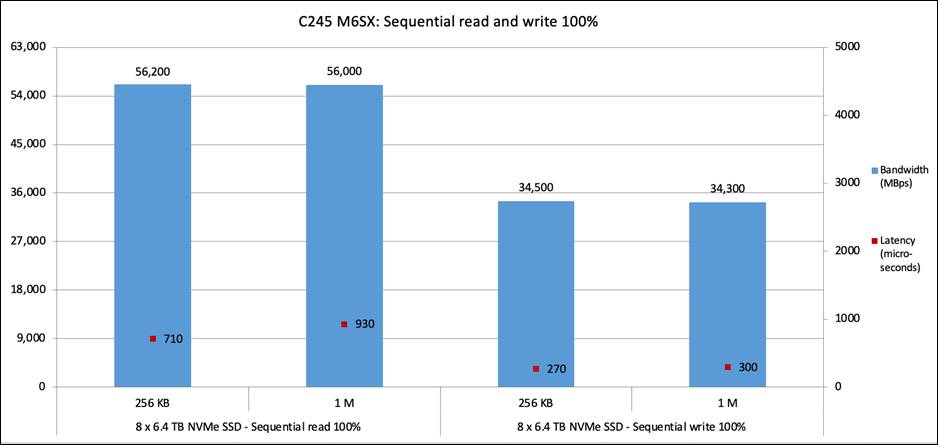
Sequential read and write 100%
Note: C245 M6SX server has additional 20 slots in the front panel which can accommodate SAS/SATA SFF SSD drives (managed by storage adapter) and overall server performance will be sum of 20 SAS/SATA SSD drives performance and 8 NVMe SSD drives performance.
For additional information, refer to the following resources:
For information about BIOS tunings for different workloads, refer to the BIOS tuning guide, at https://www.cisco.com/c/en/us/products/collateral/servers-unified-computing/ucs-c-series-rack-servers/performance-tuning-wp.html
For information about the FIO tool, refer to https://fio.readthedocs.io/en/latest/fio_doc.html.
Table 8 lists the details of the server under test.
Table 8. Server properties
| Name |
Value |
|
| Product names |
Cisco UCS C225 M6N, C245 M6SX |
|
| CPUs |
CPU: Two 2.80-GHz AMD EPYC 7543 32-core processors |
|
| Number of cores |
32 |
|
| Number of threads |
64 |
|
| Total memory |
256 GB |
|
| Memory DIMMs (16) |
16 GB x 16 DIMMs |
|
| Memory speed |
3200 MHz |
|
| Virtual interface card (VIC) adapter |
Cisco UCS VIC 1467 10 and 25 Gbps modular LAN on motherboard (mLOM) |
|
| RAID controllers |
● Cisco M6 12 Gbps SAS RAID controller with 4 GB flash-backed write cache (FBWC; UCSC-RAID-M6SD)
● Cisco 12 Gbps SAS HBA (UCSC-SAS-M6T)
|
|
| SFF SSDs |
● 960 GB 2.5-inch enterprise value 12 Gbps SAS SSD (UCS-SD960GK1X-EV)
● 960 GB 2.5-inch enterprise value 6 Gbps SATA SSD (UCS-SD960G61X-EV)
|
|
| SFF NVMe SSDs |
● 1.6 TB 2.5-inch Intel P5600 NVMe high-performance medium-endurance (UCSC-NVMEI4-I1600)
(1.6 TB drive specifications)
● 6.4 TB 2.5-inch Intel P5600 NVMe high-performance medium-endurance (UCSC-NVMEI4-I6400)
(6.4 TB drive specification)
|
|
Table 9 lists the server BIOS settings applied for disk I/O testing.
Table 9. Server BIOS settings
| Name |
Value |
| BIOS version |
Release 4.2.2b |
| Cisco Integrated Management Controller (IMC) version |
Release 4.2(2a) |
| NUMA Nodes per Socket |
NPS4 |
| IOMMU |
Auto |
| SMT Mode |
Enabled |
| Global C-State Control |
Auto (enabled) |
| Efficiency Mode Enable |
Auto |
| DF C-States |
Auto |
| SVM Mode |
Enabled |
| IOMMU |
Auto |
| Fixed SOC P-State |
P0 |
| Cisco xGMI Max Speed |
Enabled |
| SMEE |
Auto |
| APBDIS |
1 |
| Fixed SOC P-State |
P0 |
| Core Performance Boost |
Auto (Enabled) |
| Determinism Slider |
Power |
Note: The rest of the BIOS settings are platform default values. Refer to the BIOS tuning guide for workload-specific tunings.