-
Cisco CallManager Serviceability System Guide, Release 4.0(1)
-
Preface
-
Introduction
-
Performance Objects and Counters
-
Cisco CallManager Services
-
Tools Overview
-
Service Activation
-
Control Center
-
Alarms
-
Trace
-
Real-Time Monitoring Tool
-
Quality Report Tool
-
Serviceability Reports Archive
-
Microsoft Performance
-
Bulk Trace Analysis
-
CDR Analysis and Reporting
-
Remote Serviceability Overview
-
Cisco Secure Telnet
-
Show Command Line Interface
-
Simple Network Management Protocol
-
CiscoWorks2000
-
Path Analysis
-
System Log Management
-
Cisco Discovery Protocol Support
-
Cisco CallManager Performance Counters, RTMT, and CISCO-CCM-MIB
-
Trace Examples
-
Performance Objects and Counters
-
Index
-
 Feedback
Table Of Contents
Trace Collection Configuration Checklist
Trace Analysis Configuration Checklist
Q931 Translator Configuration Checklist
TroubleShooting Trace Setting Configuration Checklist
Where to Find More Information
Trace
This chapter provides information on the Cisco CallManager Serviceability Trace tool and contains the following topics:
•
TroubleShooting Trace Setting
•
•
•
•
•
•
Understanding Trace
Cisco CallManager Serviceability provides a web-based trace tool to assist the system administrator and support personnel in troubleshooting Cisco CallManager problems.
Refer to the following sections for more information on the main trace functions:
•
The Trace and Alarm tools work together. You configure trace and alarm settings for Cisco CallManager services. A Cisco TAC engineer receives the results. You can direct alarms to the Win2000 event viewer, CiscoWorks2000 Syslog, SDI or SDL trace log files, or to all destinations. You can base traces for Cisco CallManager services on debug levels, specific trace fields, and Cisco CallManager devices such as phones or gateways. You can perform a trace on the alarms that are sent to the SDI or SDL trace log files.
Trace Configuration
You configure trace parameters for Cisco CallManager services that are available on any Cisco CallManager server in the cluster. The following configurable services for trace exist:
•
•
•
•
•
•
•
•
•
•
•
•
•
•
•
Use the Trace Configuration tool to specify the parameters that you want to trace for troubleshooting Cisco CallManager problems. The Trace Configuration window provides two types of settings: trace filter and trace output.
Specify the following trace parameters:
•
•
•
•
•
If the service is a call-processing application such as Cisco CallManager or Cisco CTIManager, you can configure a trace on devices such as phones and gateways; for example, you can narrow the trace to all enabled phones with a directory number beginning with 555.
Note
Trace Collection Tool
Use the Trace Collection Tool, a client-side plugin, to collect and zip various Cisco CallManager service traces and/or other Cisco CallManager log files in the form of a single/multiple zip file(s). The traces and/or log files collected include:
•
•
–
–
–
–
–
–
–
–
•
–
–
–
–
–
–
–
–
–
Note
You can download the Trace Collection Tool from the Install Plugins page in Cisco CallManager Administration and Cisco CallManager Serviceability Administration and follow the installation prompts. Refer to "Trace Collection Configuration," in the Cisco CallManager Serviceability Administration Guide.
Launching the trace collection tool results in the display of a separate Trace Collection Tool window. If you open the executable file when another instance is open on the same machine, then a messge box displays stating that another instance is already open and only one instance can be running at any point of time on a given machine.
Note
You can choose one of the following options:
•
•
The option to use IP address represents the default selection as long as no Network Address Translation (NAT) is used between the machine where Trace Collection Tool is running and the Cisco CallManager servers, regardless whether they are running on the same subnet.
Trace Analysis
The Trace Analysis tool, a post-processing tool that displays XML files, provides greater trace detail to help narrow system problems. Using the Trace Analysis tool, you can specify an SDI or SDL trace, a device name, or an IP address for a Cisco CallManager service.
Note
Cisco CallManager system administrators and Cisco engineers use Trace Analysis to debug system problems. After the trace is configured and collected, you request a list of SDI or SDL log files. From the list, you can choose a specific log file and request information from that log file such as host address, IP address, trace type, and device name.
An SDL Trace log file contains call-processing information from services such as Cisco CallManager, Cisco CTIManager, and Cisco TFTP. The system traces the signal distribution layer of the call and logs state transitions into a log file.
An SDI Trace log file contains information for all Cisco CallManager services. The system traces system diagnostic interface information from the services and logs run-time events and traces to a log file.
The easy-to-read SDI and SDL log files display in XML format. The format for contents of log files looks like a table with headings, rows, and columns of information.
Q931 Translator
Use Q931 Translator to translate ISDN/Q931 messages in the SDI trace files to IOS message format. Q931 Translator supports text and XML trace files. You can save the translated trace files to any destination on the network.
Using the message translator tool, Cisco Support Engineers translate your incoming debugging information into familiar Cisco IOS-equivalent messages.
The message translator works by filtering incoming data from Cisco CallManager SDI log files, then parsing and translating them into Cisco IOS-equivalent messages. Message translator supports XML and text files.
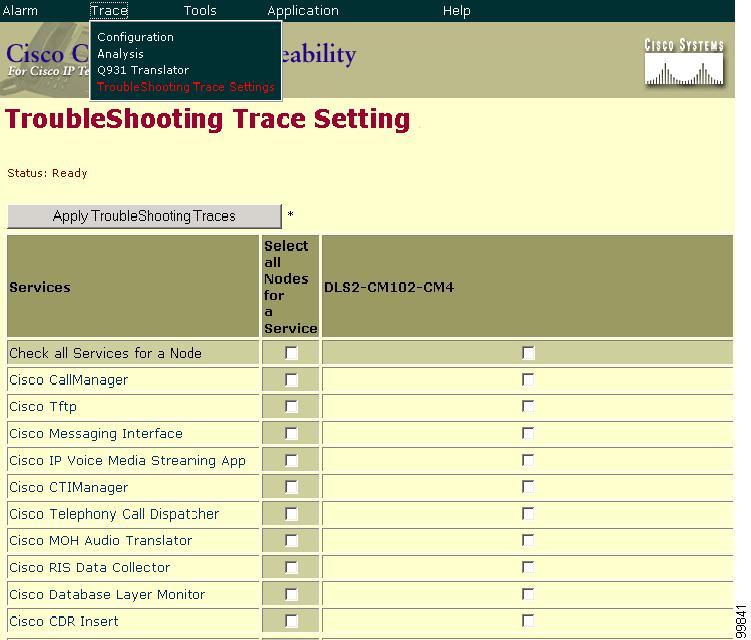
TroubleShooting Trace Setting
The TroubleShooting Trace Setting tool allows you to choose the services in Cisco CallManager for which you want to set predetermined troubleshooting trace settings. Using this tool, you can choose the required services on different Cisco CallManager nodes in the cluster, so the trace settings of the chosen services are changed to reflect the predetermined trace settings. See Figure 8-1.
Figure 8-1 TroubleShooting Trace Setting Window
Note
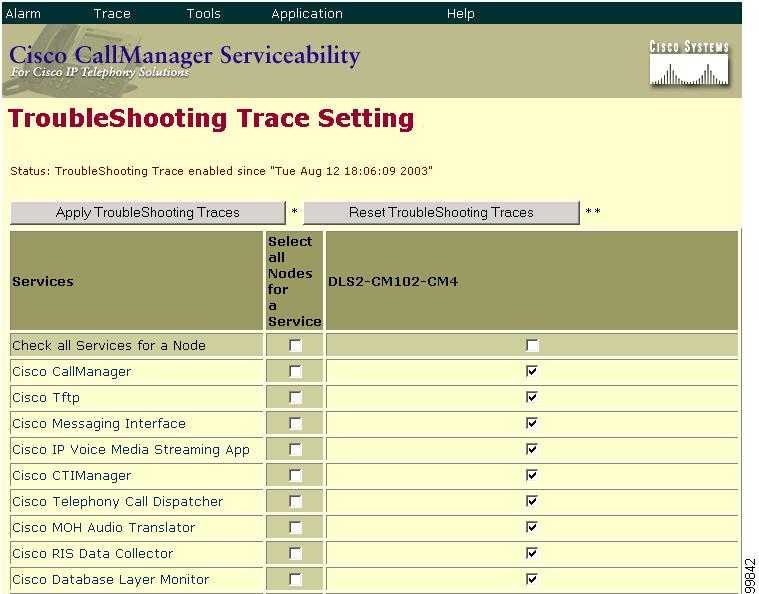
After you apply troubleshooting trace settings to some services, subsequent requests to open the TroubleShooting Trace Setting window display the TroubleShooting Trace Setting page again and shows the services that you have set for troubleshooting. See Figure 8-2.
Figure 8-2 TroubleShooting Trace Setting Window
From this window, you can choose the Reset TroubleShooting Traces button to reset the trace settings to the original settings.
Note
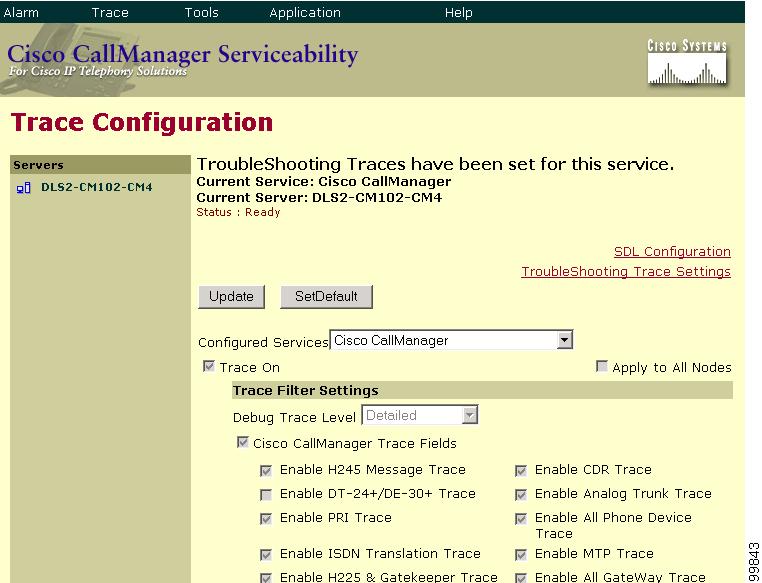
When you apply TroubleShooting Trace Setting to a service, the Serviceability Trace Configuration web page in Serviceability Administration displays as shown in Figure 8-3.
Figure 8-3 Trace Configuration Window with TroubleShooting Traces
On the top of the pane, a message states that TroubleShooting trace has been set for the given service(s). A link to the TroubleShooting Trace Setting web page displays, so you can reset the settings for the service, if necessary.
The traces configuration web page displays all the settings as read-only, except for some parameters of trace output settings; for example, File Name, Maximum No. of Files, Maximum No. of Lines per file, and Maximum No. of Minutes per file. You can modify these parameters even when you have applied troubleshooting trace settings.
Note
Trace Filter Settings
Use the trace filter settings to set the type of trace that you want (Table 8-1). Check the Trace On check box to access the trace filter settings.
Trace Output Settings
Use the trace output settings to specify the output log file and its format (Table 8-2).
Note
Trace Configuration Checklist
Table 8-3 provides an overview of the steps for configuring trace for Cisco CallManager services.
Table 8-3 Trace Configuration Checklist
Step 1
Choose the Cisco CallManager server and service that you want to trace.
Trace Configuration, Cisco CallManager Serviceability Administration Guide
Step 2
Turn trace on by checking the Trace On check box.
Trace Configuration, Cisco CallManager Serviceability Administration Guide
Step 3
Determine whether you want to trace the service on the chosen server or on all servers in the network.
Trace Configuration, Cisco CallManager Serviceability Administration Guide
Step 4
Choose the trace debug level.
Debug Trace Level Settings, Cisco CallManager Serviceability Administration Guide
Step 5
Choose the specific trace fields that you want traced for the service that you chose; for example, enable MTP device trace.
Trace Configuration, Cisco CallManager Serviceability Administration Guide
Step 6
Choose device name based tracing if appropriate (applies to Cisco CallManager and CTIManager only). Choose the devices to be traced.
Configuring Device Name Based Trace Monitoring Trace Parameters, Cisco CallManager Serviceability Administration Guide
Step 7
Choose the log file that receives the trace data. Use the default or specify a filename.
Trace Configuration, Cisco CallManager Serviceability Administration Guide
Step 8
Choose enable XML formatted output if the trace information will be analyzed (only applies to Cisco CallManager, CTIManager, and Cisco TFTP).
Trace Configuration, Cisco CallManager Serviceability Administration Guide
Step 9
View the contents of the trace log when complete. To view specific information about an SDI or SDL trace, collect the parameters (optional).
Viewing Trace Log Files, Cisco CallManager Serviceability Administration Guide
Step 10
Specify criteria for an SDI or SDL trace file and view in XML format (optional).
Specifying Criteria for an SDI Trace Analysis, Cisco CallManager Serviceability Administration Guide
Specifying Criteria for an SDL Trace Analysis, Cisco CallManager Serviceability Administration Guide
Trace Collection Configuration Checklist
Table 8-4 provides an overview of the steps for configuring trace collection.
Table 8-4 Trace Collection Configuration Checklist
Step 1
Install the Trace Collection Tool.
Loading the Trace Collection Tool, Cisco CallManager Serviceability Administration Guide
Step 2
Collect Cisco CallManager traces, applications, and system traces within the Cisco CallManager cluster.
Collecting Traces by Using Trace Collection Tool, Cisco CallManager Serviceability Administration Guide
Trace Analysis Configuration Checklist
Table 8-5 provides an overview of the steps for configuring trace analysis.
Table 8-5 Trace Analysis Configuration Checklist
Step 1
Run the trace for a server and service (only applies to Cisco CallManager, CTIManager, and Cisco TFTP). Check the enable XML trace check box.
Trace Configuration, Cisco CallManager Serviceability Administration Guide
Step 2
Specify the SDI or SDL trace analysis search criteria.
Specifying Criteria for an SDI Trace Analysis, Cisco CallManager Serviceability Administration Guide
Specifying Criteria for an SDL Trace Analysis, Cisco CallManager Serviceability Administration Guide
Q931 Translator Configuration Checklist
Table 8-6 provides an overview of the steps for configuring Q931 translation.
Table 8-6 Q931 Translator Configuration Checklist
Step 1
Choose a server where the Q931 messages reside.
Using the Message Translator, Cisco CallManager Serviceability Administration Guide
Step 2
Choose an XML or text-based file format.
Using the Message Translator, Cisco CallManager Serviceability Administration Guide
Step 3
Search for the file to be translated.
Using the Message Translator, Cisco CallManager Serviceability Administration Guide
Step 4
Save the translated log file.
Using the Message Translator, Cisco CallManager Serviceability Administration Guide
TroubleShooting Trace Setting Configuration Checklist
Table 8-6 provides an overview of the steps for setting and resetting troubleshooting trace setting.
Table 8-7 TroubleShooting Trace Setting Configuration Checklist
Step 1
Choose the services on the Cisco CallManager nodes on which you want to set troubleshooting trace.
Setting TroubleShooting Trace, Cisco CallManager Serviceability Administration Guide
Step 2
Reset the services on the Cisco CallManager nodes so the original settings will get restored.
Resetting TroubleShooting Trace, Cisco CallManager Serviceability Administration Guide
Where to Find More Information
Related Topics
•
•
•
•
•
•
•
Additional Cisco Documentation
•