Downloads |
 Feedback Feedback
|
Table Of Contents
Cisco OER Master Controller Engine GUI
Settings - Change Web Password
Delete Border Router Interface
New Cost Minimization Contract
How to Set up Logging Messages Specific to a Prefix
Cisco OER Master Controller Engine GUI
This chapter provides information about how to use the Cisco OER Master Controller Engine Web-based graphical user interface (GUI).
Access Modes
There are two access modes to the Cisco OER Master Controller Engine:
•
Normal
•
Normal mode uses HTTP basic authentication that sends the password in clear text to the server.
Secure mode uses the Secure Sockets Layer (SSL) for login from a Web browser. Once logged in, the Cisco OER Master Controller Engine GUI shows a series of tabs for various system maintenance, configurations, and reporting functions.
Step 1
Step 2
http://<hostname>:8080/,or http://<ipaddress>:8080/
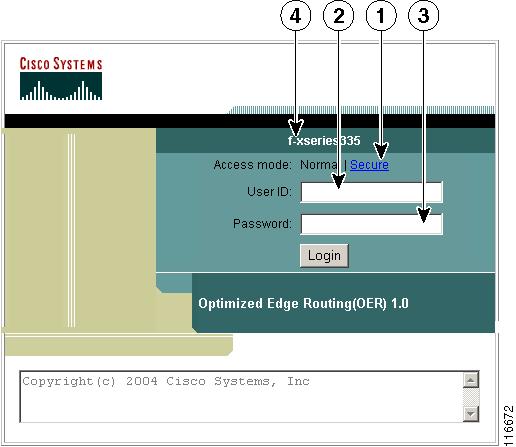
The login page appears (see Figure 2-1).
Figure 2-1 Login Page
1
Secure (https) login option.
3
Password dialog block.
2
User ID dialog block.
4
Appliance hostname.
If you want to use HTTPS, select Secure and continue to login.
Step 3
admin
Step 4
cisco
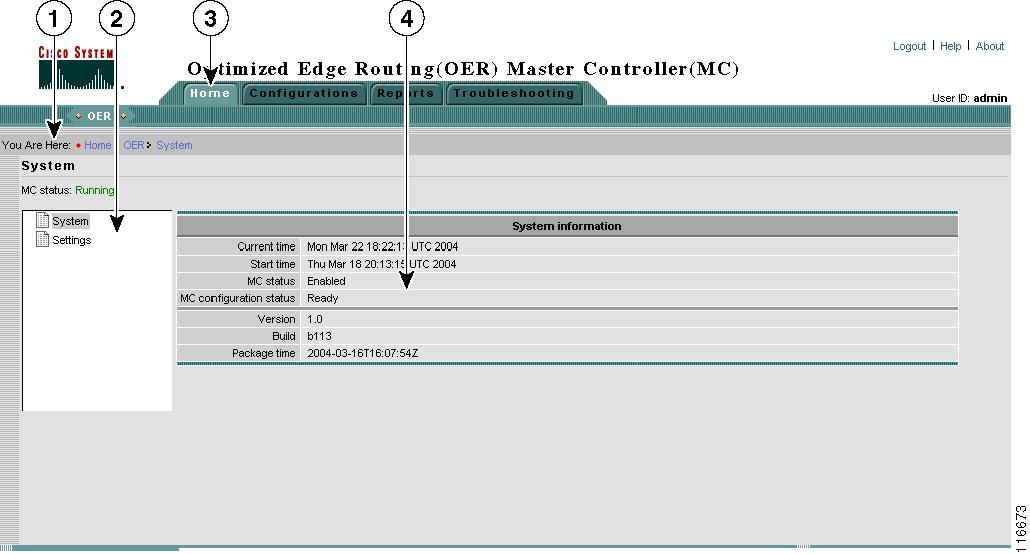
The Optimized Edge Routing (OER) Master Controller (MC) Home page appears (see Figure 2-2).
For security reasons, you should change this password. To do this, skip forward to the "Settings - Change Web Password" section.
Figure 2-2 Home Page
Main Functions
The Cisco OER Master Controller Engine user interface provides four main functions:
Figure 2-3 Main Function Tabs
•
•
•
•
Subfunctions
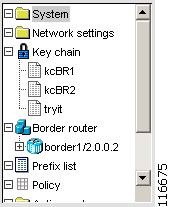
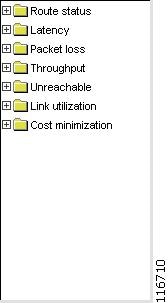
Each main function is further subdivided into subfunctions, which are shown as a tree structure (see Figure 2-4) of the Contents for the Current Context (see callout 1 in Figure 2-2).
Figure 2-4 Contents of Current Context (Subfunctions)
Home
The Home function provides access to system-level information:
•
•
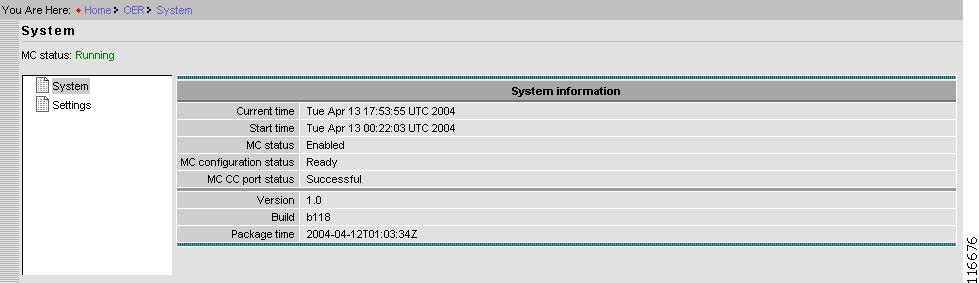
System Status
System status shows the following information:
Figure 2-5 System Status
Current time
UTC.
Start time
Time (UTC) when Cisco OER Master Controller Engine was started.
MC status
Whether the Cisco OER Master Controller Engine is enabled or disabled.
MC configuration status
Whether the Cisco OER Master Controller Engine is ready to operate, or not. The minimum configuration requirements for operation (Ready) are:
•
•
To view the status of border routers go to Configurations > Border Router (see Figure 2-14).
MC CC port status
Communication Controller port number currently configured.
Version
Cisco OER Master Controller Engine software version.
Build
Package build type (Release).
Package time
Time (UTC) when build completed.
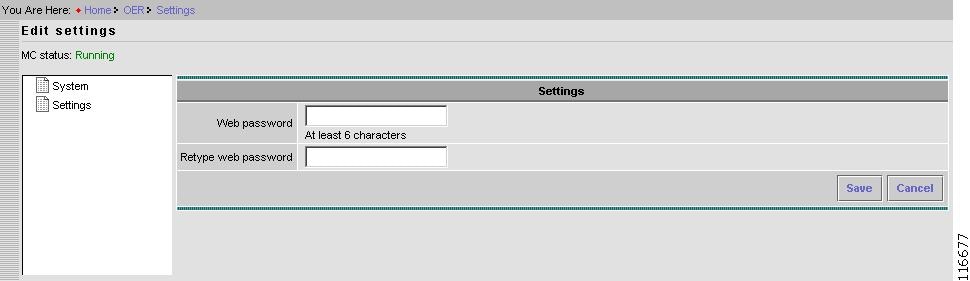
Settings - Change Web Password
The Settings functions allows you to change the Web password to the user interface:
Figure 2-6 Home > Edit Settings > Change Web Password
Step 1
Step 2
Step 3
Step 4
Configurations
The Configurations main function is divided into two levels:
•
•
At the Basic configuration level, the Cisco OER Master Controller Engine does performance and load balancing functions.
The Advanced configuration level allows you to use the Cisco OER Master Controller Engine to configure custom policies for optimization; including cost optimization for tier links.
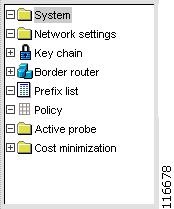
The subfunctions (contents list) of the Configurations main function are shown in Figure 2-7.
Figure 2-7 Configurations Contents List
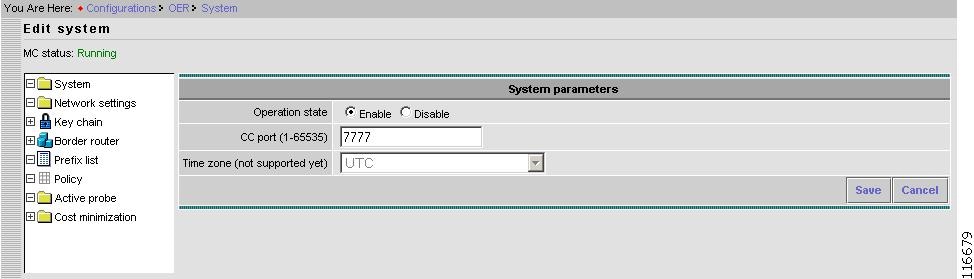
System
The System Configurations subfunction allows you to change the system-level settings shown in Figure 2-8.
Figure 2-8 Configurations > System > Edit Settings
Step 1
In Enable state, the Cisco OER Master Controller Engine functions per policy and other configuration parameters.
In Disable state, the Cisco OER Master Controller Engine stops functioning and allows the configuration to be modified, but does not monitor or control prefixes. The connection between the Cisco OER Master Controller Engine and border routers is disabled.
Step 2
CC is the Cisco OER Master Controller Engine Communication Controller that provides messaging with border routers. The CC port number must be configured on the Cisco OER Master Controller Engine and all border routers (that are participating in Optimized Edge Routing).
The range of port numbers is 1 to 65535.
This port cannot be in use by any other application executing on the Cisco OER Master Controller Engine host.
The order of configuration on the Cisco OER Master Controller Engine and border routers in not critical, but all must use the same port number.
Editing the Time zone field is not supported.
Step 3
Step 4
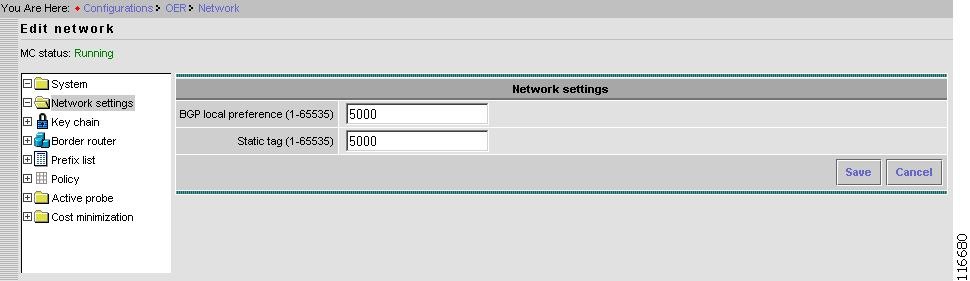
Network Settings
The Network Settings parameters in this subfunction apply globally, not to any individual prefix or exit.
Figure 2-9 Configurations > Network Settings > Edit Network
Step 1
The Cisco OER Master Controller Engine controls a BGP route by setting high local preference. This setting allows you change the local preference used by the Cisco OER Master Controller Engine.
System default value is 5000.
Step 2
This is similar to BGP local preference, but it is used with static routes.
System default value is 5000.
Step 3
Step 4
Key Chain
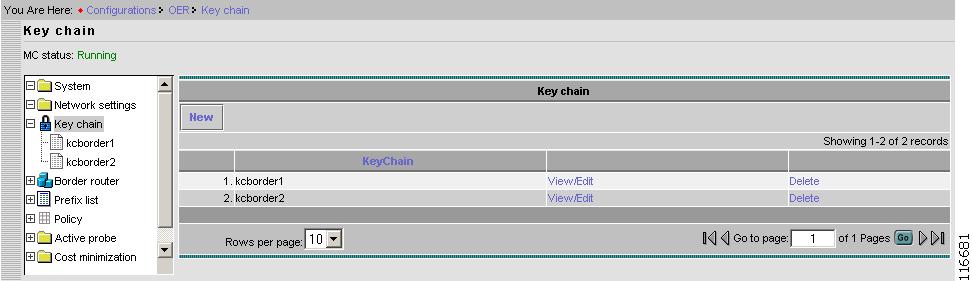
Authentication between the Cisco OER Master Controller Engine and associated border routers is mandatory. Key chains are used for this purpose.
More than one key can be configure per key chain. Key chains configured in this subfunction (see Figure 2-10) are used in border router configurations. The same key chain must also be configured on the associated border router. The border router can be configured through a console port, or in-band port, over the internet. You cannot use the Cisco OER Master Controller Engine to configure the border router.
Figure 2-10 Configurations > Key Chain
KeyChain
Name of a key chain. A key chain must have at least one key.
Keys
Identification number of a key in the key chain.
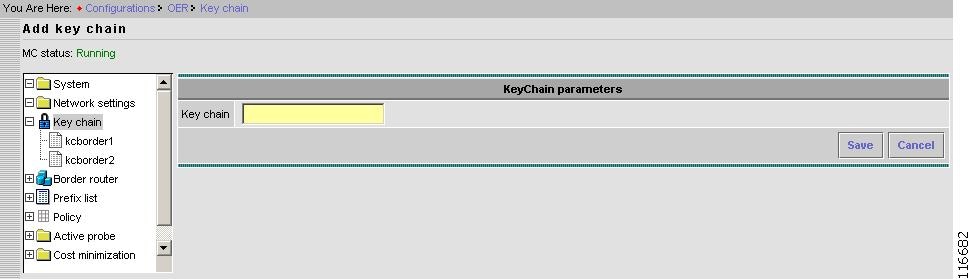
New Key Chain
In the Key Chain window, click New.
Figure 2-11 Configurations > Key Chain > Add Key Chain
Step 1
Step 2
Step 3
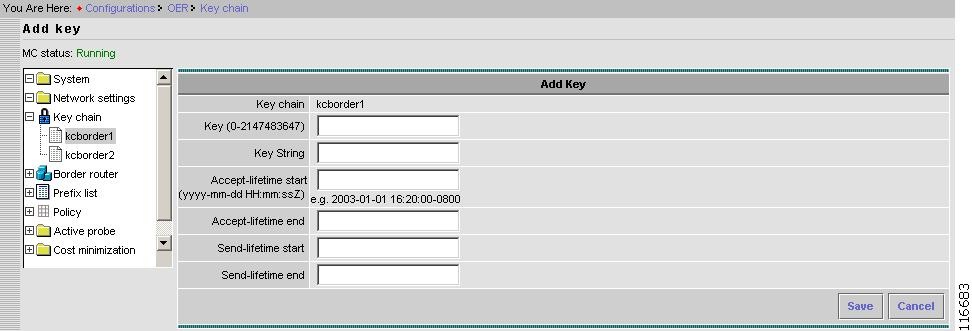
Add Key to Key Chain
Select a key chain, then in that key chain window click, Add new (see Figure 2-12).
Figure 2-12 Configurations > Key Chain > Add Key
Step 1
Step 2
Authentication string for the Key that must be sent and received in the packets to and from border router.
Same string must be configured on the border router.
Note
Step 3
Step 4
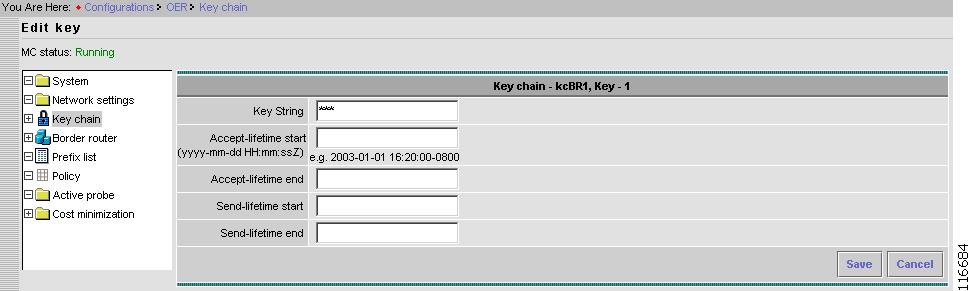
Edit Key Chain
Select a key chain, then in that key chain window click, View/Edit.
Figure 2-13 Configurations > Key Chain > Edit Key
Step 1
This is the authentication string for the Key that must be sent and received in the packets to and from the border router.
Same string must be configured on the border router.
Note
Step 2
Step 3
Border Router
The Border Router subfunction allows you to configure parameters pertaining to border routers.
Figure 2-14 Configurations > Border Router
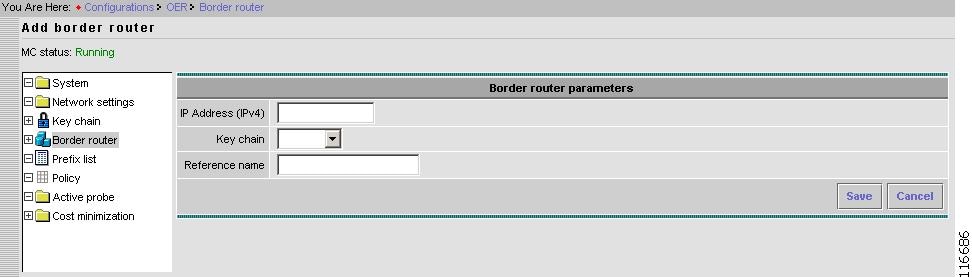
New Border Router
New border router configurations includes configuring the IP address of the border router, key chain used for authentication, and reference name of the border router.
From the Border router page, click New.
Figure 2-15 Configurations > Border Router > Add Border Router
Step 1
IP address of the border router should be the IP address configured on the local interface on the border router. This IP address is used by the border router as a source address to communicate with the Cisco OER Master Controller Engine.
Step 2
Key chain selection is mandatory.
Step 3
The Reference Name is a string used to identify a specific border router. This string is only used to identify a border router in the Report main function, and does not have any other meaning.
Unless this also the DNS name, the Reference Name is not pingable.
Step 4
Step 5
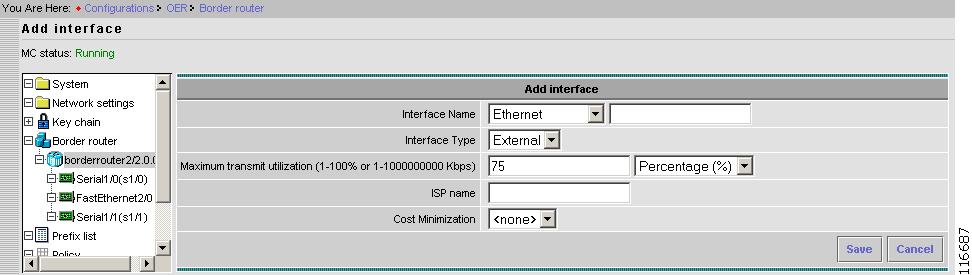
New Interface
To add a new interface, from a selected border router page, click New interface.
Figure 2-16 Configurations > Border Router > Add Interface
Step 1
Interface Name consists of two parts: name string and slot number.
A pull-down menu for name string is provided along with a field for slot number next to it.
Tip
Note
Step 2
There are two types of Interfaces selected from the pull-down menu:
a.
b.
Step 3
This is a threshold for an Exit policy. If the utilization of Exit is more than the configured threshold, then Exit is considered Out of policy and the Cisco OER Master Controller Engine takes an action to reduce it.
The threshold can be specified in terms of absolute bandwidth (kbps) or in terms of percentage of total capacity.
System default value is 75%.
This is only valid for External Interfaces.
Step 4
A string used to identify an ISP, which is only valid for External Interfaces.
This name can be the name of the ISP connected to that interface.
This name is used in the Report main function.
Step 5
The drop-down menu allows you to select a user-configured Cost Minimization.
Cost Minimization types are the billing criteria that are established with each ISP. For more information about Cost Minimization, see "Cost Minimization" section.
Step 6
Step 7
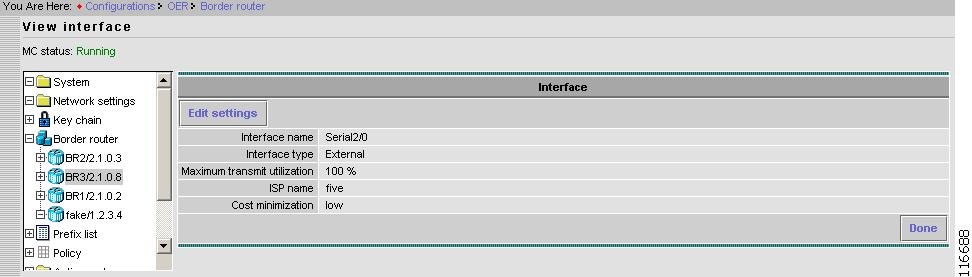
View Border Router Interface
From the selected border router page, select the interface, then click View/Edit.
Figure 2-17 Configurations > Border Router > Interface > View Interface
When finished, click Done.
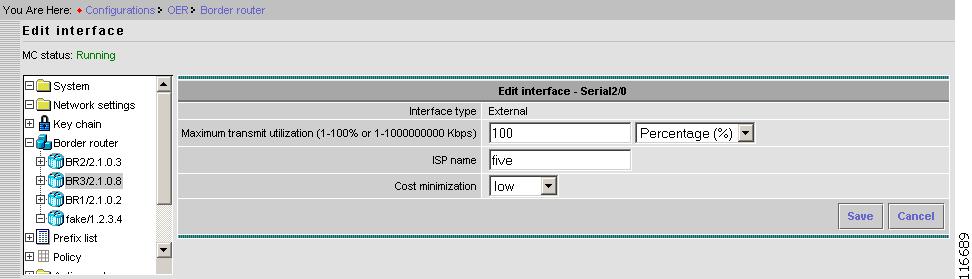
Edit Border Router Interface
To edit the selected border router interface parameters, click Edit Settings.
Figure 2-18 Configurations > Border Router > Interface > Edit Interface
Step 1
This is a threshold for an Exit policy. If the utilization of Exit is more than the configured threshold, then Exit is considered Out of policy and the Cisco OER Master Controller Engine takes an action to reduce it.
The threshold can be specified in terms of absolute bandwidth (kbps) or in terms of percentage of total capacity.
System default value is 75%.
This is only valid for External Interfaces.
Step 2
A string used to identify an ISP, which is only valid for External Interfaces.
This name can be the name of the ISP connected to that interface.
This name is used in the Report main function.
Step 3
The drop-down menu allows you to select a user-configured Cost Minimization type.
Cost Minimization types are the billing criteria that are established with each ISP. For more information about Cost Minimization, see "Cost Minimization" section.
Step 4
Step 5
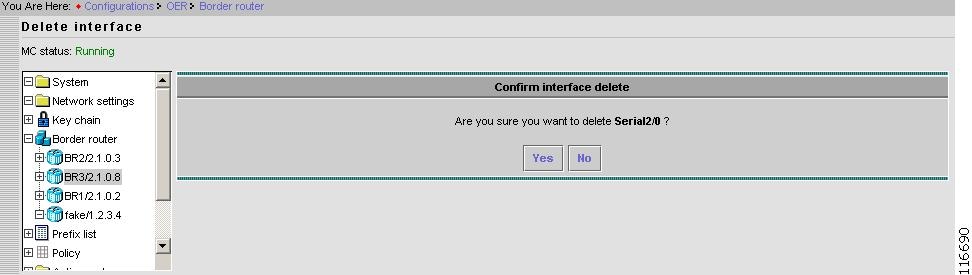
Delete Border Router Interface
From the selected border router page, to delete the selected interface, click Delete.
Figure 2-19 Configurations > Border Router > Interface > Delete Interface
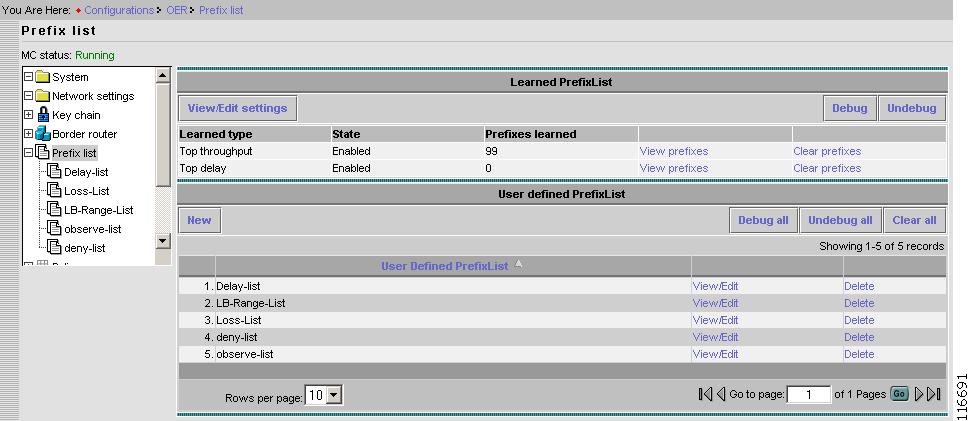
Prefix List
There are two types of prefix lists:
•
•
Prefixes are learned based on the configured settings for learned prefixes and are added or deleted dynamically to the learned prefix lists.
Prefixes in user-defined prefix lists are added or deleted manually.
Figure 2-20 Configurations > Prefix List
Learned Prefix List
There are two types of learned prefix lists:
•
•
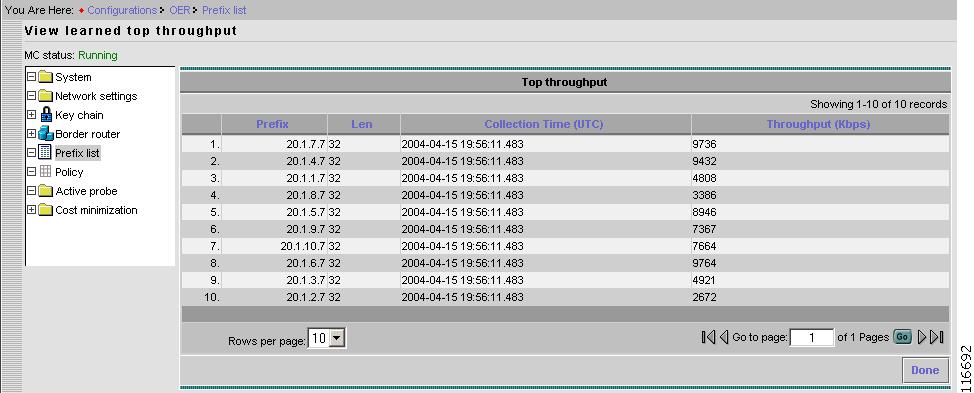
View Top Throughput Prefixes
From the Prefix List page, for Top throughput, click View prefixes.
Figure 2-21 Configurations > Prefix List > View Prefixes for Top Throughput
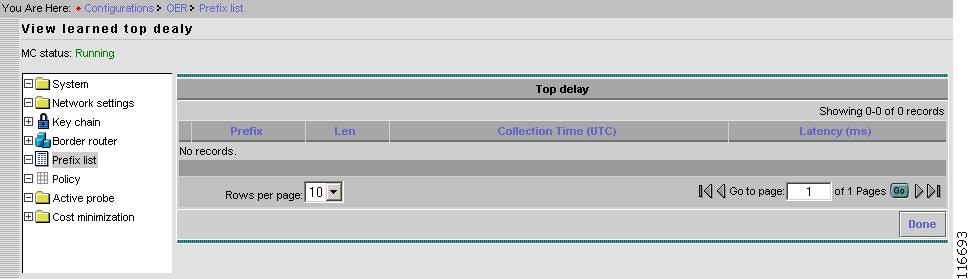
View Top Delay Prefixes
From the Prefix List page, for Top delay, click View prefixes.
Figure 2-22 Configurations > Prefix List > View Prefixes for Top Delay
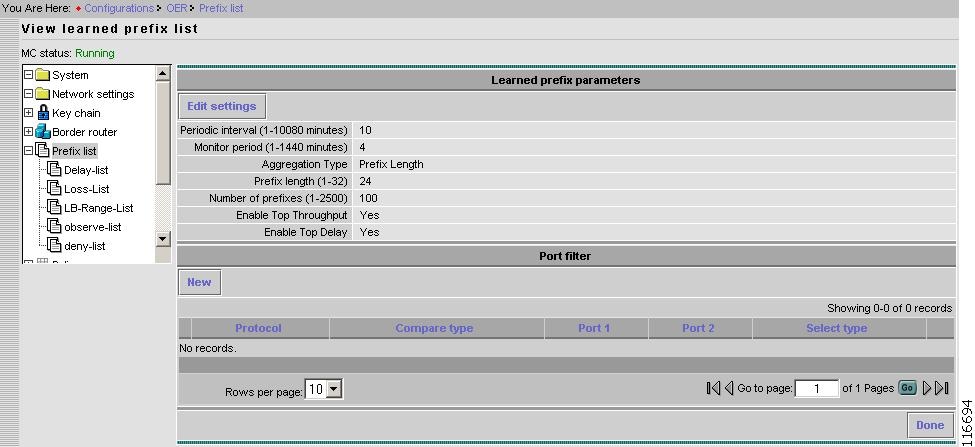
View Learned Prefix List Settings
From the Learned Prefix List page, click View/Edit settings.
Figure 2-23 Configurations > Prefix List > View Learned Prefix List
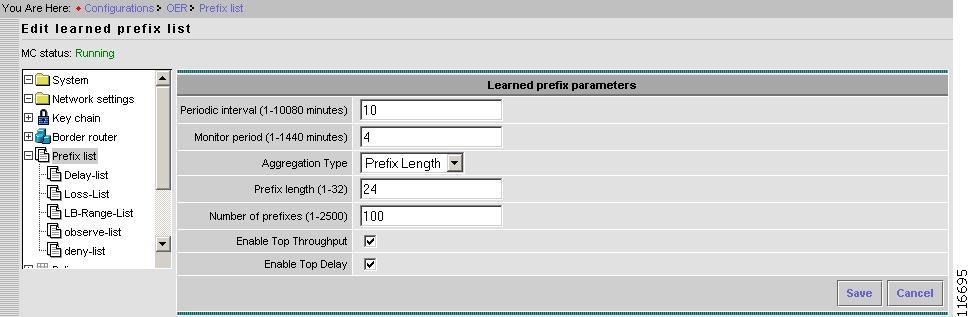
Edit Learned Prefix List Settings
From the Learned prefix parameters page, click Edit settings.
Figure 2-24 Configurations > Prefix List > Edit Learned Prefix List
Step 1
The time interval in minutes between two successive learning sessions.
Step 2
The time period in minutes traffic is monitored to determine top-throughput prefixes and top-delay prefixes.
Step 3
Prefix Length - Prefixes defined by prefix length or prefixes in the RIB with length higher than the prefix length.
Static Routes - Prefixes defined by static routes configured on the border.
BGP - Prefixes defined by prefixes found in BGP routing table on the border.
Step 4
Used only if the Aggregations Type is Prefix Length.
Step 5
The maximum number of top-throughput and top-delay prefixes to be learnt.
Step 6
Check box to Enable or Disable learning prefixes based on Top Throughput.
Step 7
Check box to Enable or Disable learning prefixes based on Top Delay.
Step 8
Step 9
User-defined Prefix List
You can create one or more user-defined prefix lists. The use of prefix lists is to assign user policy to a group of user prefixes.
Prefixes are added or deleted by editing prefix list.
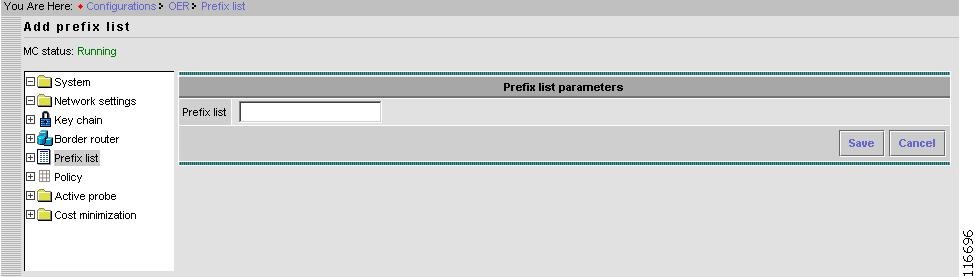
Add User-defined Prefix List
From the Prefix List page, in the User-defined Prefix List pane, click New.
Figure 2-25 Configurations > Prefix List > User-defined > Add Prefix List
Step 1
For example, observe-list.
Step 2
Step 3
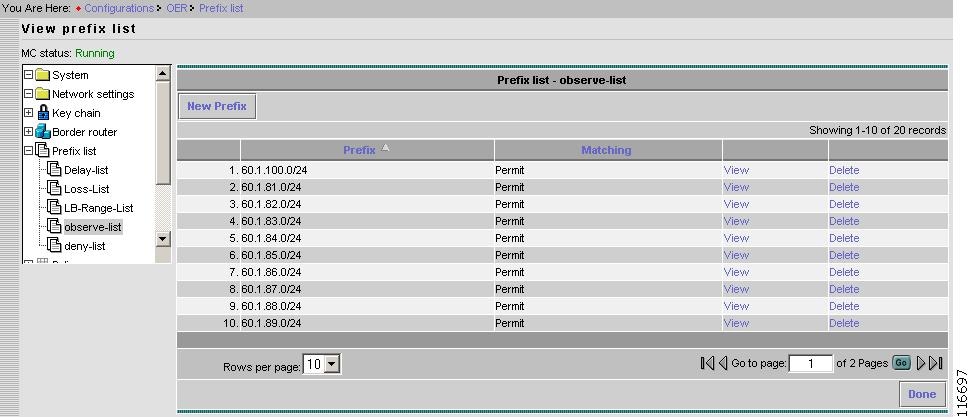
User-defined Prefix List
Select a user-defined prefix list.
Figure 2-26 Configurations > Prefix List > User-defined
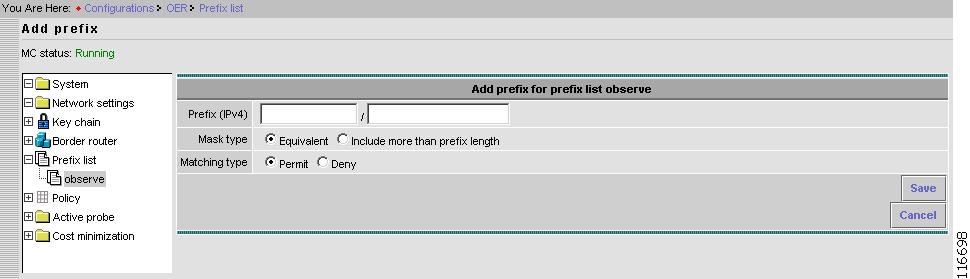
Add New Prefix to a User-defined Prefix List
From the selected User-defined Prefix List page, New prefix.
Figure 2-27 Configurations > Prefix List > User-defined Prefix List > Add Prefix
Step 1
A prefix is comprised of a network address and a mask length.
Only Ipv4 prefix is supported.
Step 2
There are two types of mask:
- Equivalent.
- Include more than prefix length (also referred as non-equivalent).
If the mask type is non-equivalent, then all more specific prefixes that match the prefix are controlled as one prefix. For example: 10.1.0.0/16+ is configured, where + means non-equivalent. If there is a prefix 10.1.1.0/24 then it is controlled in the same way as 10.1.0.0/16 is controlled.
10.1.1.0/24 is called a shadow prefix of 10.1.0.0/16+.
The Cisco OER Master Controller Engine does not support configuring shadow prefixes. In other words, if 10.1.0.0/16+ is configured, then 10.1.1.0/24 cannot be configured because it is already part of 10.1.0.0/16+.
If 10.1.1.0/24 is configured first, then 10.1.0.0/16+ is not allowed. If a learned prefix creates the shadow for a user-configured non-equivalent prefix, then the learned prefix is deleted.
Step 3
There are two matching types:
- Permit
- Deny
If Deny is set, then this prefix is not controlled or monitored by the Cisco OER Master Controller Engine. It also prevents automatic learning of the prefix.
Note
Step 4
Step 5
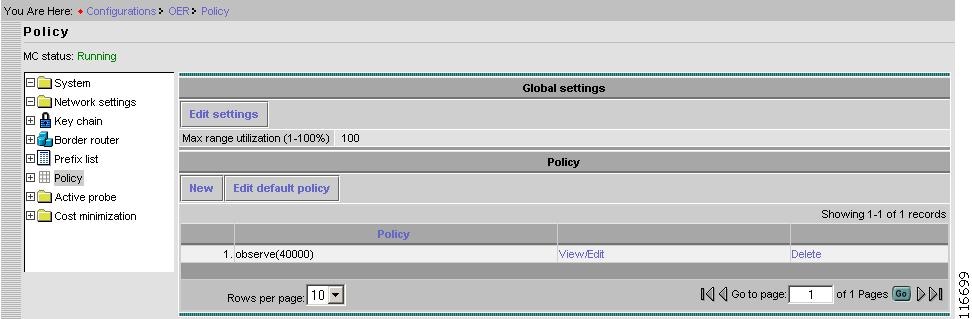
Policy
From the Content list under Configurations, select Policy.
Figure 2-28 Configurations > Policy
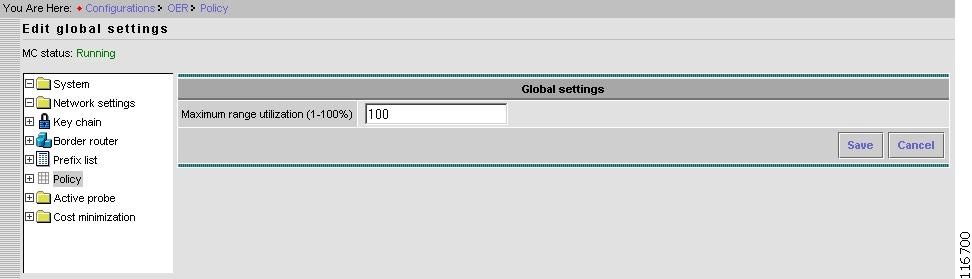
Global Settings
From the Policy page, in the Global settings pane, click Edit settings.
Figure 2-29 Configurations > Policy > Edit Settings
Step 1
This defines the global policy of link utilization. If the difference between any two links is greater than value, then the Cisco OER Master Controller Engine takes an action to reduce the difference.
System default value is 20%.
Step 2
Step 3
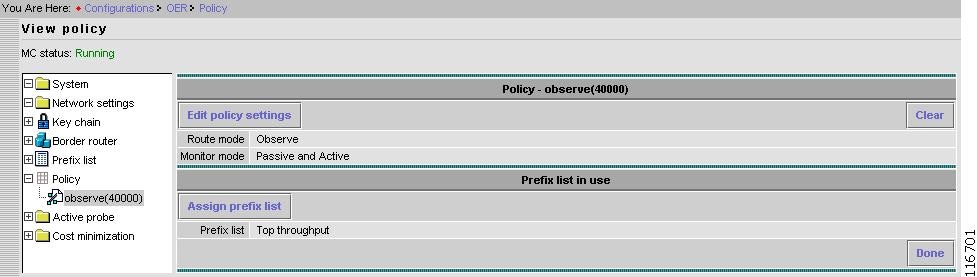
Default Policy Settings
There is a default policy that applies to all learned prefixes. You can configure a custom policy for finer control.
From the Content under Policy, select the default policy.
Figure 2-30 Configurations > Policy > Default
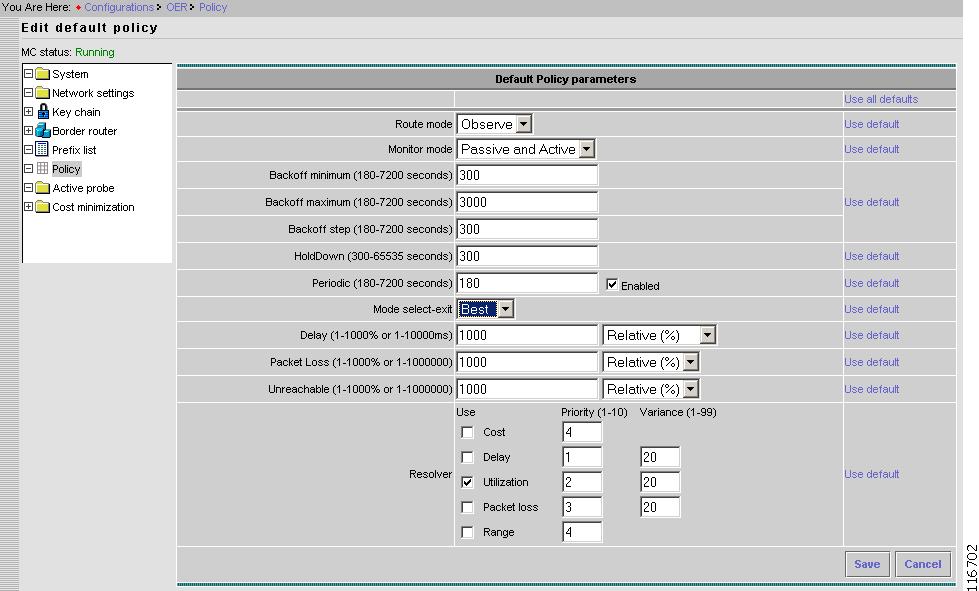
From the Default Policy page, click Edit policy settings.
Figure 2-31 Configurations > Policy > Default > Edit
The window shown in Figure 2-31 allows you to edit the default policy as well as add, delete, or edit a custom user-defined policy.
A user-defined policy can be applied to any one Prefix list including learned prefix list (top-throughput-list or top-delay-list). It cannot be applied to more than one prefix list.
A default policy cannot be manually applied to any prefix list. If two different policies are applied to the same prefix list, then the policy with the lower sequence number takes the precedence.
A default policy is applied to top delay and top throughput list automatically. This cannot be changed. However, you can apply a user-defined policy to the top delay and top throughput lists. Since the sequence number of a user-defined policy is always less than the default policy (seq 0x7fffffff), a user-defined policy overrides the default policy.
A user-defined policy can inherit one or more policy parameters from the Default policy. If a parameter is inherited from the Default policy, then any changes to the values of the parameters for the Default policy are reflected in the user-defined policy. Inheritance is useful for parameters that apply globally.
For example, Holddown time is most likely to apply to all the prefixes subsequently inherited from the Default policy.
To inherit a parameter from the Default policy, check the box to the right of each parameter.
All the fields for the Default policy have system default values when the Cisco OER Master Controller Engine is run for the first time.
A Policy contains following fields:
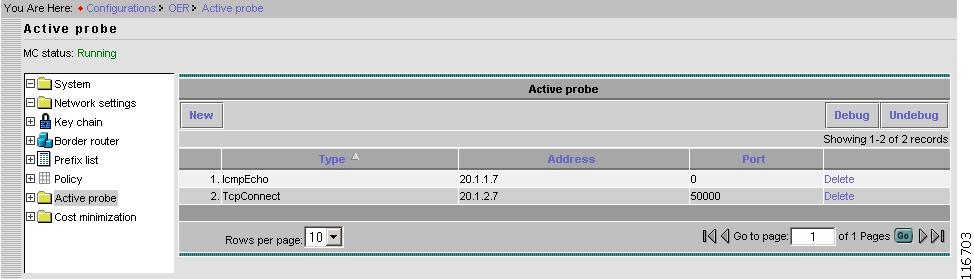
Active Probe
For active measurements, targets are required for user-defined prefixes. This section describes how to configure active probe targets. SAA probes are used to perform active probing from each border router. That is, the border router IP address is the source address and the prefix is the destination address.
Figure 2-32 Configurations > Active Probe
Each target is defined using following parameters:
•
•
•
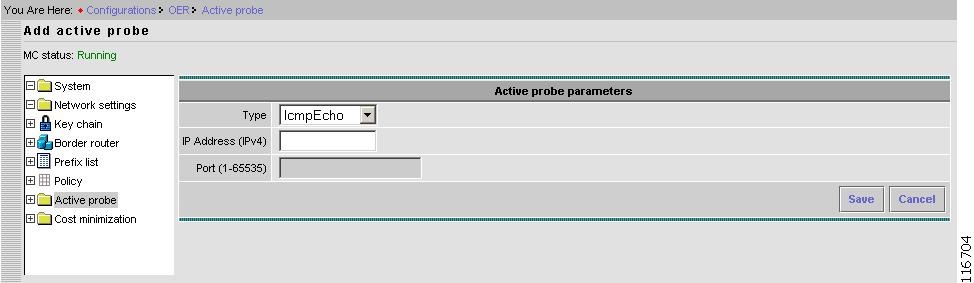
Add Active Probe
From the Active Probe window, click New.
Figure 2-33 Configurations > Active Probe > New
Step 1
There are three types of probes:
- IcmpEcho
- TcpConnect
- UdpEcho
TcpConnect and UdpEcho probes require an SAA responder configured on the target node. SAA is the service assurance agent running on a Cisco device.
Step 2
Only Ipv4 is supported.
Step 3
Port number to use for TcpConnect and UdpEcho probes.
Step 4
Step 5
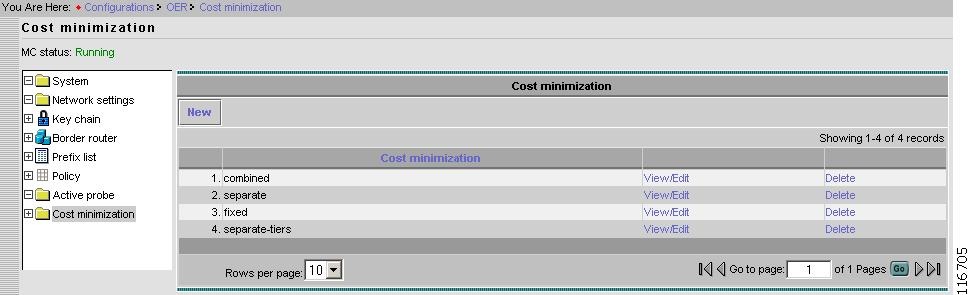
Cost Minimization
ISPs bill the customer for the use of their services using different methods. The cost minimization configuration supports fixed cost Cost Minimization and tier based with bursting Cost Minimization.
Cost Minimization types are the billing criteria that are established with each ISP.
The Cost minimization page provides a way for you to model the service level agreement with an ISP. If the Resolver Cost minimization is enabled, prefixes are moved based on the cost criteria for each ISP. That is, less costlier ISP will be preferred over a higher cost ISP.
More than one Cost Minimization type can be configured. The Cost Minimization type is then applied to an Exit by editing Configurations > Border router > Interface > Edit settings (see "Edit Border Router Interface" section).
Figure 2-34 Configurations > Cost Minimization
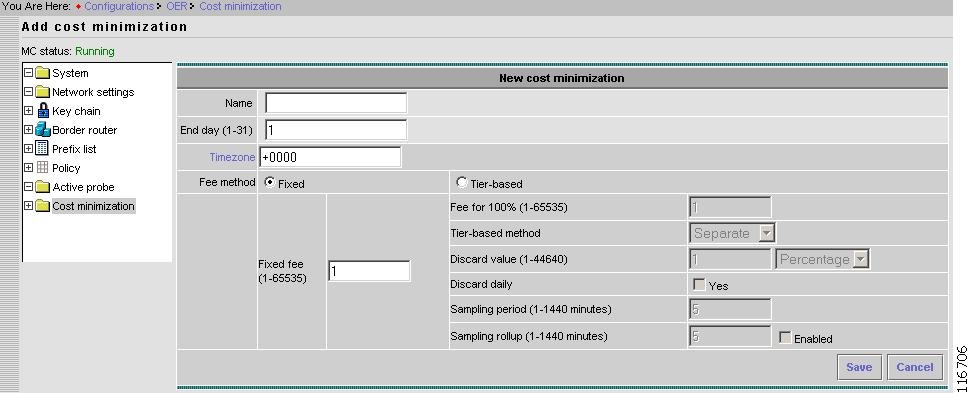
New Cost Minimization Contract
From the Cost Minimization page, click New.
Figure 2-35 Configurations > Cost Minimization > Add Cost Minimization
Step 1
Step 2
The last day of the billing cycle.
Step 3
By default a billing cycle ends at 23:59:59 UTC on the End day. This value allows a billing cycle to expire before or after 23:59:59 UTC.
The format is [+|-]HHmm.
For example, if billing cycle expires four hours early, then Timezone should be set to +0400.
Step 4
Fixed
a.
Monthly cost of Fixed cost link. This value is not used for any cost minimization. It is merely used for reporting.
Tier-based
a.
Fee for the top tier (100%).
b.
There are three methods within the tier-based-with-bursting structure. These methods define the manner in which bursty usage is discarded.
Separate: Egress and Ingress utilization samples are separately stacked to discard the bursty usage from each stack. Each stack is sorted in descending order, highest usage sample being on the top. Top n samples are discarded, where n is the discard value in terms of absolute or percentage. The remaining highest utilization on each stack is called sustained utilization. For Separate, the larger of the two sustained utilization is the monthly sustained utilization billed by the ISP.
Combined: Egress and Ingress utilization samples are put on one stack.
Summed: Egress and Ingress utilization values are added before putting them onto a single stack.
c.
The number of samples discarded from the stack of link utilization samples to remove the bursty link usage. It is specified in absolute terms or a percentage. The value applies to each stack. If Sampling rollup is enabled, the discard value applies to the stack of rollup utilization.
d.
If daily discard is enabled, then process of discarding is done daily and sustained utilization is calculated on each day. At the end of the billing cycle monthly sustained utilization is calculated by averaging daily sustained utilization.
e.
Rate at which link utilization is sampled.
Default is every 5 minutes.
f.
To reduce the number of samples, samples are aggregated (rolled up) by hours or minutes. If Sampling rollup is enabled, all the samples collected during the rollup period are averaged to calculate the rollup utilization.
Rollup utilization is used for all the calculations.
Step 5
Step 6
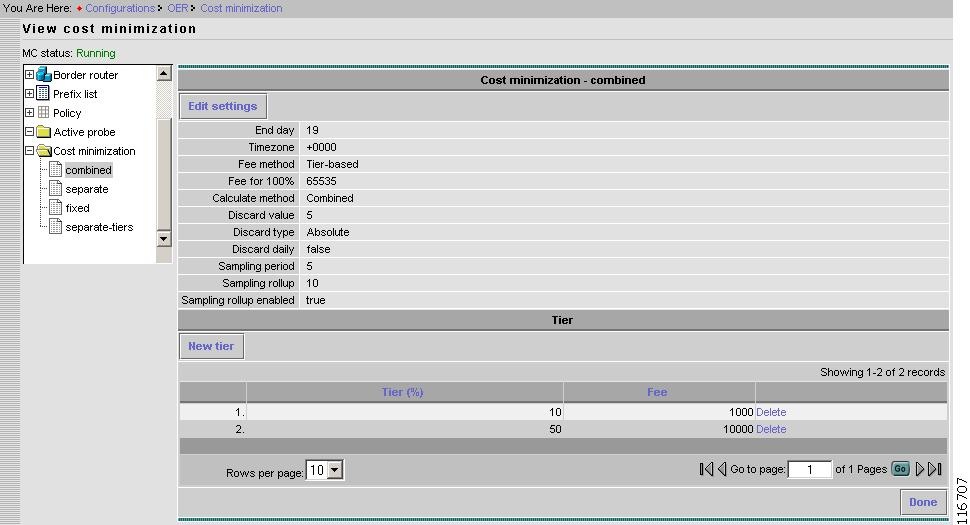
View Cost Minimization
From the Content list under Cost Minimization, click on the desired Cost Minimization type.
Figure 2-36 Configurations > Cost Minimization > View Cost Minimization
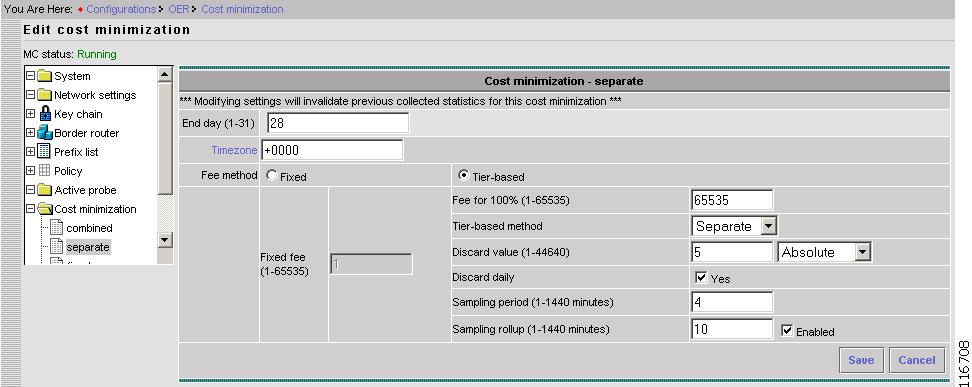
Edit Cost Minimization
From the View Cost Minimization page, click Edit Settings.
Figure 2-37 Configurations > Cost Minimization > Edit Cost Minimization
Warning
Step 1
The end day of the billing cycle.
Step 2
By default a billing cycle ends at 23:59:59 UTC on the End day. This value allows a billing cycle to expire before or after 23:59:59 UTC.
The format is [+|-]HHmm.
For example, if billing cycle expires four hours early, then Timezone should be set to +0400.
Step 3
Fixed
a.
Monthly cost of Fixed cost link. This value is not used for any cost minimization. It is merely used for reporting.
Tier-based
a.
Fee for the top tier (100%).
b.
There are three methods within the tier-based-with-bursting structure. These methods define the manner in which bursty usage is discarded.
Separate: Egress and Ingress utilization samples are separately stacked to discard the bursty usage from each stack. Each stack is sorted in descending order, highest usage sample being on the top. Top n samples are discarded, where n is the discard value in terms of absolute or percentage. The remaining highest utilization on each stack is called sustained utilization. For Separate, the larger of the two sustained utilization is the monthly sustained utilization billed by the ISP.
Combined: Egress and Ingress utilization samples are put on one stack.
Summed: Egress and Ingress utilization values are added before putting them onto a single stack.
c.
The number of samples discarded from the stack of link utilization samples to remove the bursty link usage. It is specified in absolute terms or a percentage. The value applies to each stack. If Sampling rollup is enabled, the discard value applies to the stack of rollup utilization.
d.
If daily discard is enabled, then process of discarding is done daily and sustained utilization is calculated on each day. At the end of the billing cycle monthly sustained utilization is calculated by averaging daily sustained utilization.
e.
Rate at which link utilization is sampled.
Default is every 5 minutes.
f.
To reduce the number of samples, samples are aggregated—rolled up—by hours or minutes. If Sampling rollup is enabled, all the samples collected during the rollup period are averaged to calculate the rollup utilization.
Rollup utilization is used for all the calculations.
Step 4
Step 5
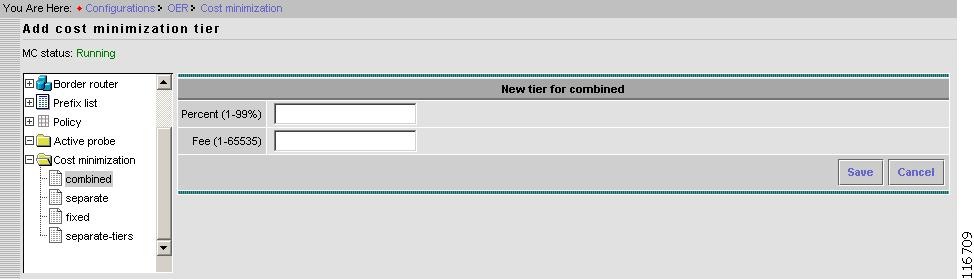
New Tier
From the View Cost Minimization page, click New tier.
Figure 2-38 Configurations > Cost Minimization > Add Cost Minimization Tier
Step 1
Step 2
Step 3
Step 4
Reports
Using the Reports main function, you can see the last n minutes/hours/days worth of data either in summarized form or as is. The Contents list shows the various subfunctions available under Reports.
•
•
•
•
•
•
•
Figure 2-39 Reports Contents List
Router Status
Under Router Status, you can find the following type reports:
•
•
•
•
•
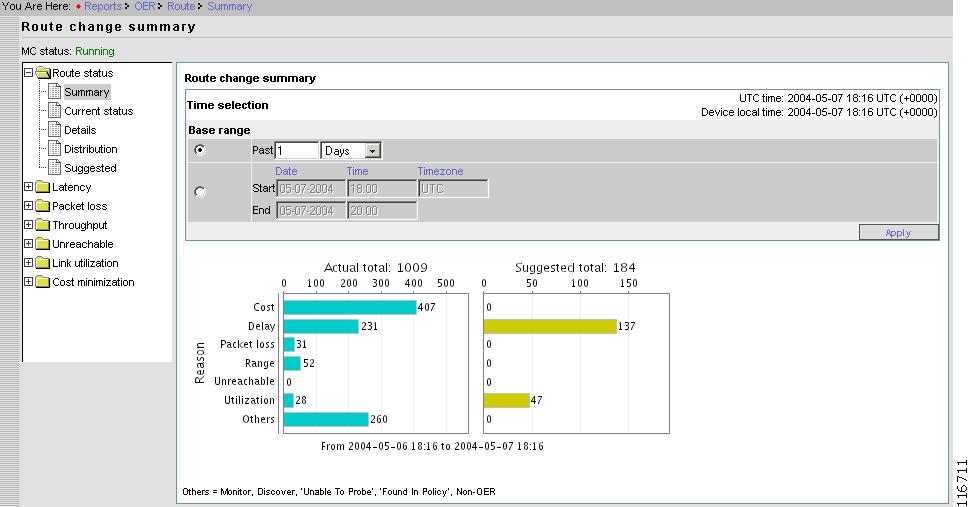
Summary
Summary router status shows overall summary with respect to Route Change.
From the Contents list, open the menu under Router status, then click Summary.
Figure 2-40 Reports > Router Status > Summary
Instead of selecting the last n minutes/hours/days, a time range can be selected by specifying start time and end time.
The format is: yyyy-mm-dd.
The Timezone is specified only with start time and the same is used for end time. For reference, the current UTC time and device local time are displayed on upper right corner of the page. If Timezone is not specified, the local time zone is used.
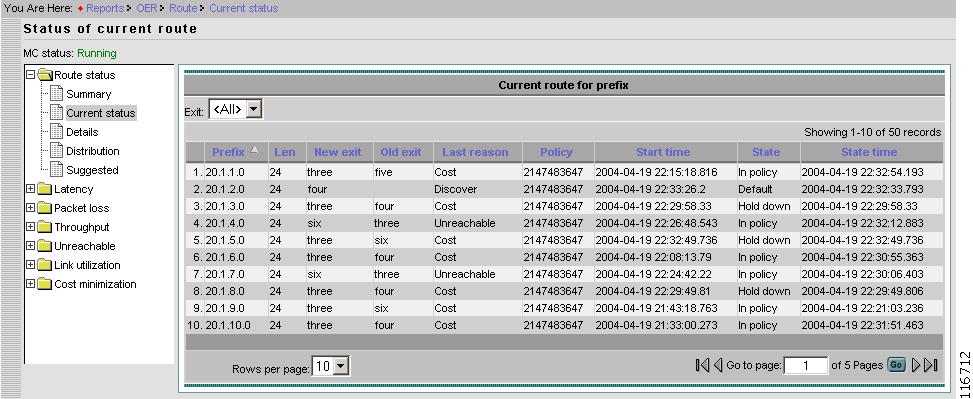
Current Status
From the Content List, select Current status. This reports contains the current status of each prefix.
Figure 2-41 Reports > Router Status > Current Status
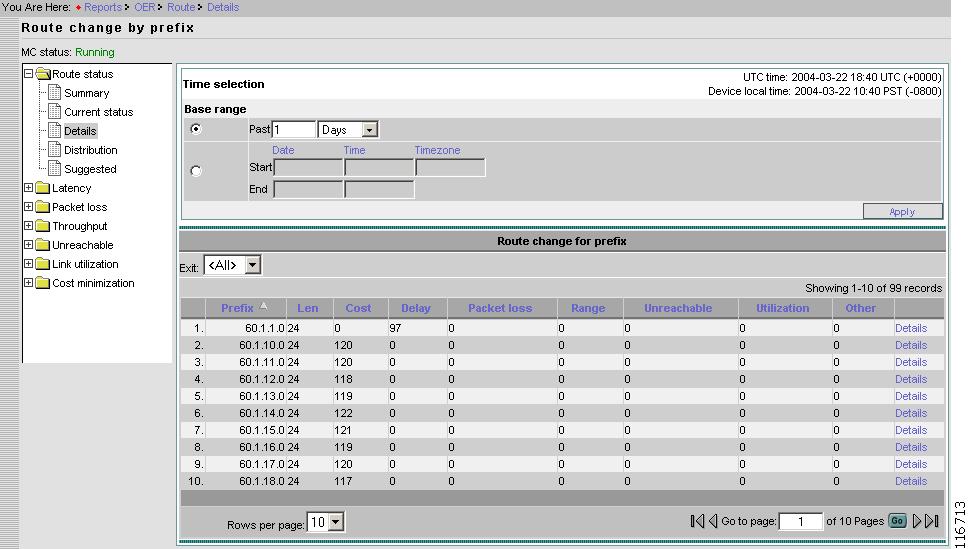
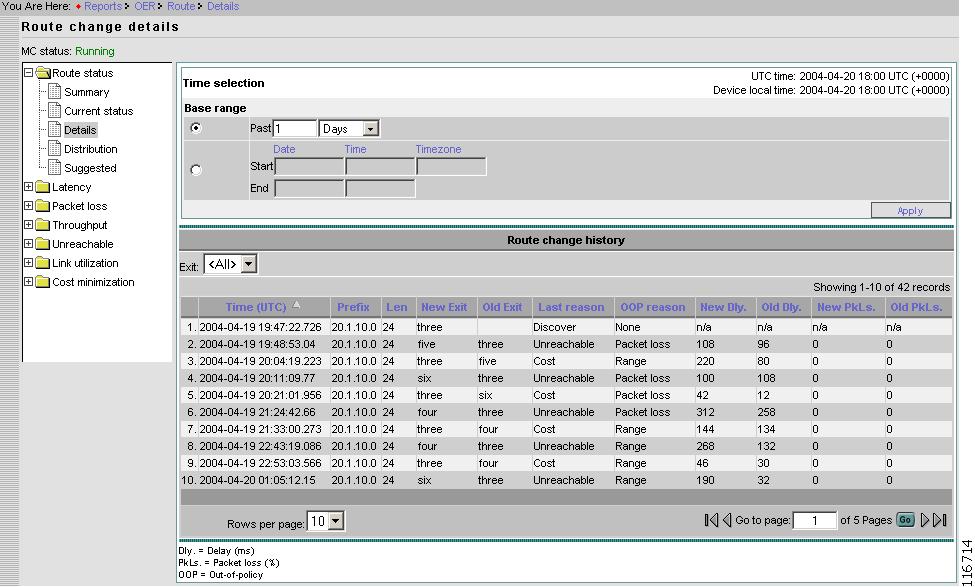
Details
From the Content List, select Details. This reports contains the Router Status Details of each prefix.
Figure 2-42 Reports > Router Status > Details > Route Change by Prefix
Route Change Details
From the Route change by prefix page, Select the prefix of interest, then click View details.
Figure 2-43 Reports > Router Status > Details > Route Change Details
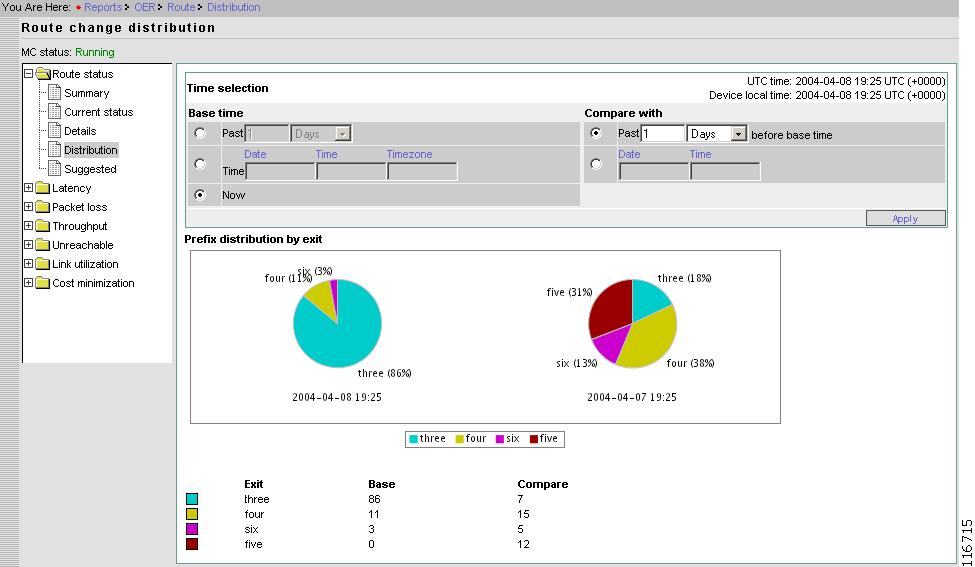
Distribution
From the Content List, select Distribution. The Distribution pie chart shows the number of prefixes being forwarded on all the Exits at two different time. You can select any two different times.
Figure 2-44 Reports > Router Status > Route Change Distribution
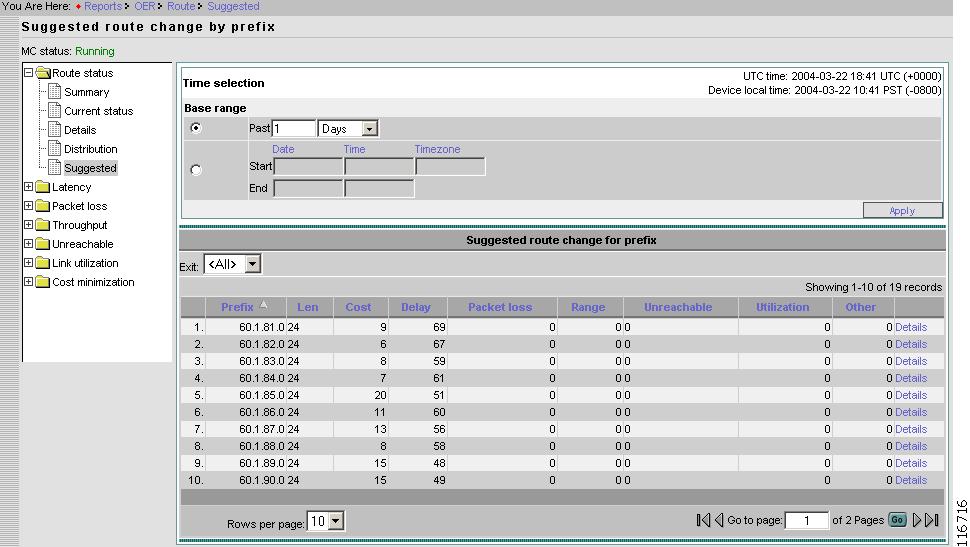
Suggested
From the Content List, select Suggested.
Figure 2-45 Reports > Router Status > Suggested Route Change by Prefix
This page shows the same information as the Detail page (Figure 2-42), but the route changes are not actual. All the data pertains to suggested route changes.
If a prefix is in observe mode (see "Default Policy Settings" section) then Route is not changed for the prefix, but it is just logged for reporting.
Latency
Under Latency, you can find the following type reports:
•
•
•
•
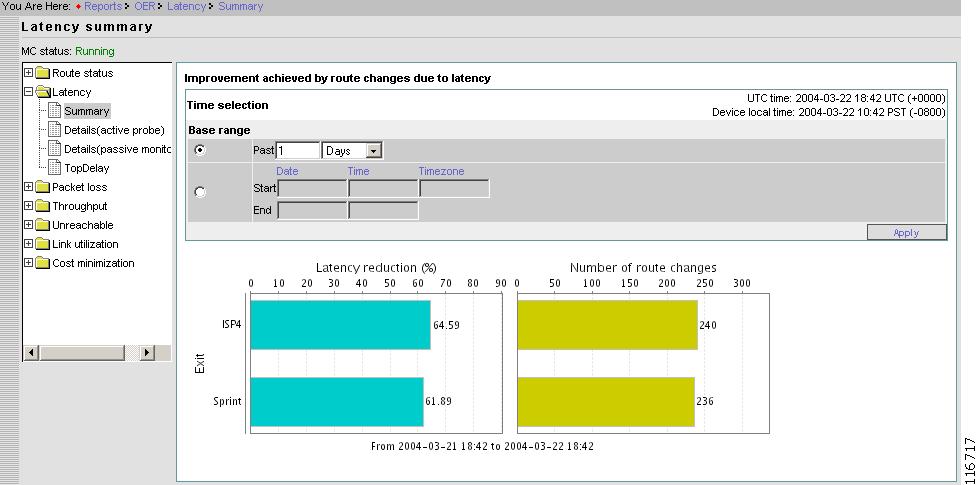
Summary
From the Contents list, open the menu under Latency, then click Summary.
Figure 2-46 Reports > Latency > Summary
The Latency Summary report displays the graph of average delay reduction per exit for selected duration. Delay reduction is calculated as (delay on old Exit - delay on new Exit) / (delay on old Exit). There is another graph (bar chart) displaying number of prefixes that were moved to the Exit due to delay reason for each Exit.
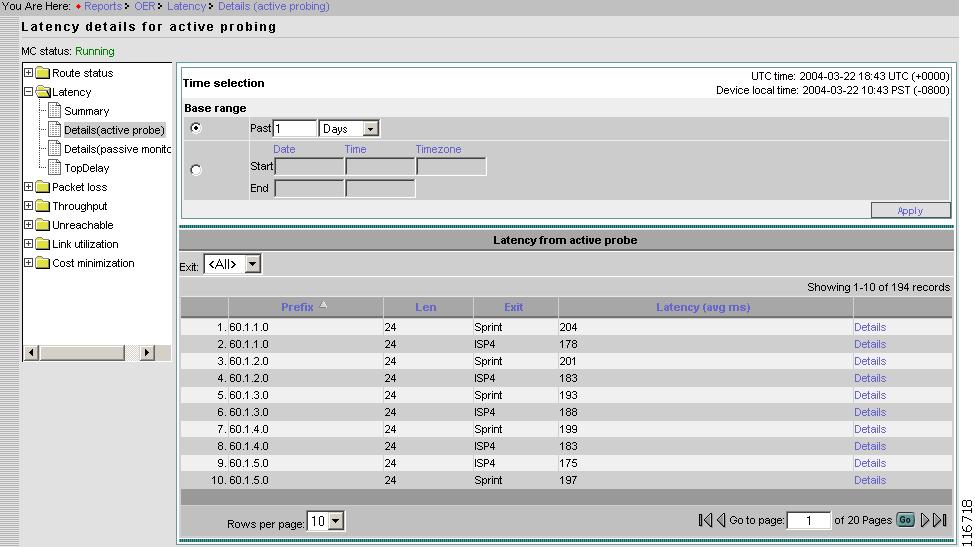
Details - Active Probe
From the Contents list, open the menu under Latency, then click Details (active probe). Figure 2-47 displays average active delay per Prefix per Exit for selected duration.
Figure 2-47 Reports > Latency > Details for Active Probe
Prefix
Prefix.
Length
Prefix length.
Exit
Current Exit of the Prefix.
Latency
Latency time in milliseconds.
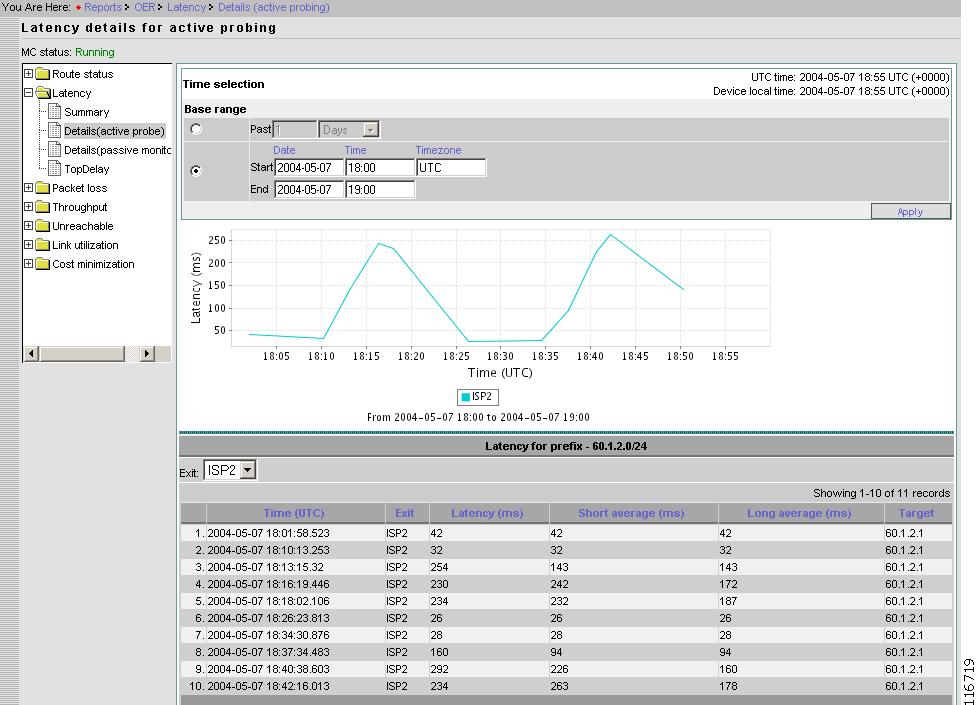
Active Probe Details for Selected Prefix
From the Latency details for active probing page, select the probe of interest, then click Details.
Figure 2-48 Reports > Latency > Details (Active Probe) > Probe Details
Multiple lines (one for each Exit) can be displayed. This is because active probing is performed simultaneously on all Exits.
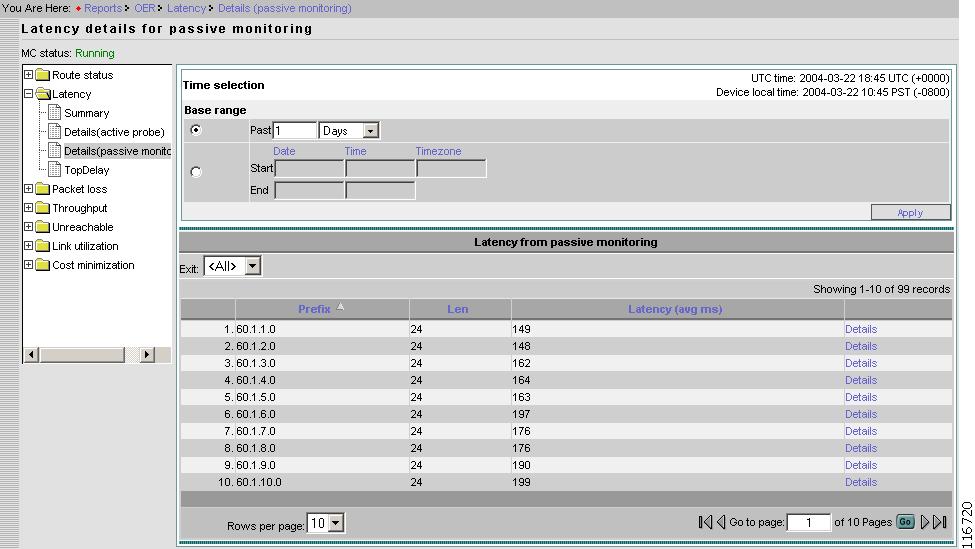
Details - Passive Monitoring
From the Contents list, open the menu under Latency, then click Details (passive monitoring).
Figure 2-49 Reports > Latency > Details (Passive Monitor)
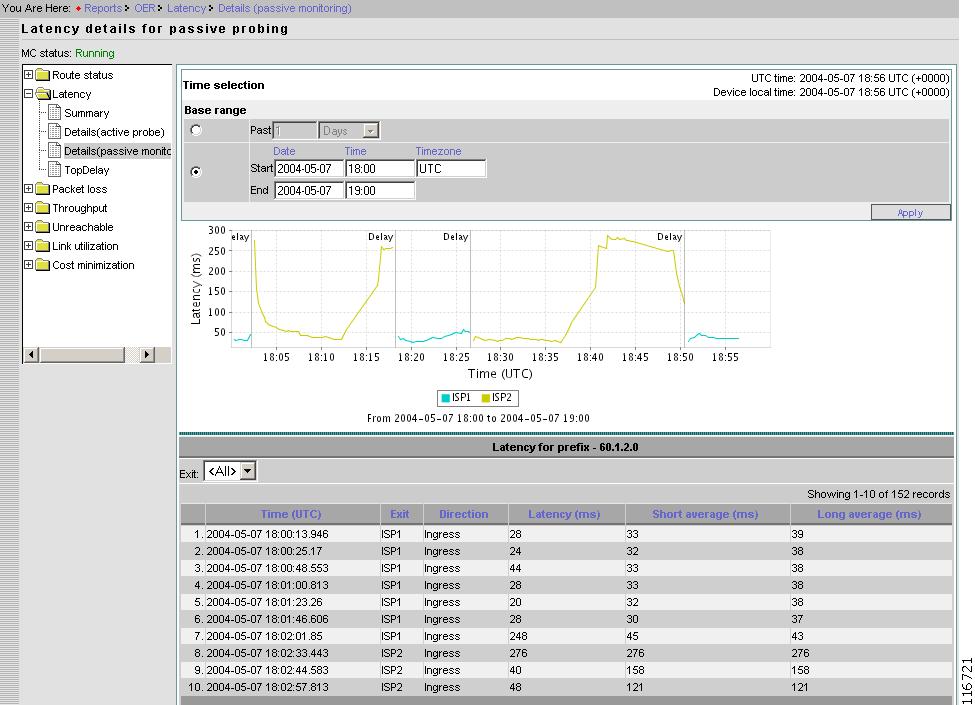
Passive Monitoring Details for Selected Prefix
From the Latency details for passive monitoring page, select the probe of interest, then click Details.
The time series chart displays the running short term average delay for a Prefix. If the Prefix was moved to a different Exit in selected duration then the color of the line is changed to indicate the change in Exit.
Apart from time series chart for delay, there are vertical bars that corresponds to route change. Each bar has a text associated with it which describes the reason why a Prefix was moved to a different Exit.
Figure 2-50 Reports > Latency > Details (Passive Monitoring) > Details
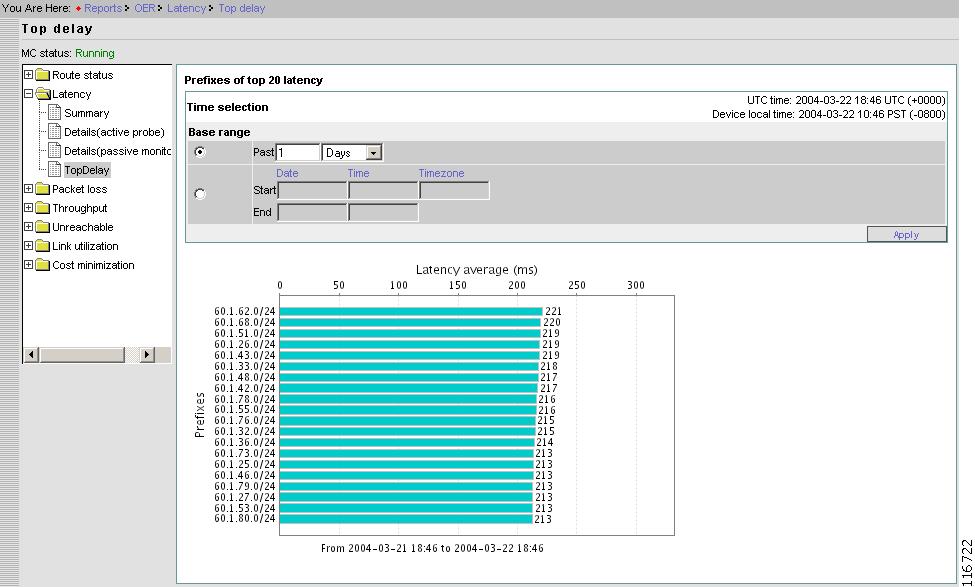
Top Delay
From the Contents list, open the menu under Latency, then click TopDelay.
Figure 2-51 Reports > Latency > Top Delay
Packet Loss
Under Packet Loss, you can find the following type reports:
•
•
•
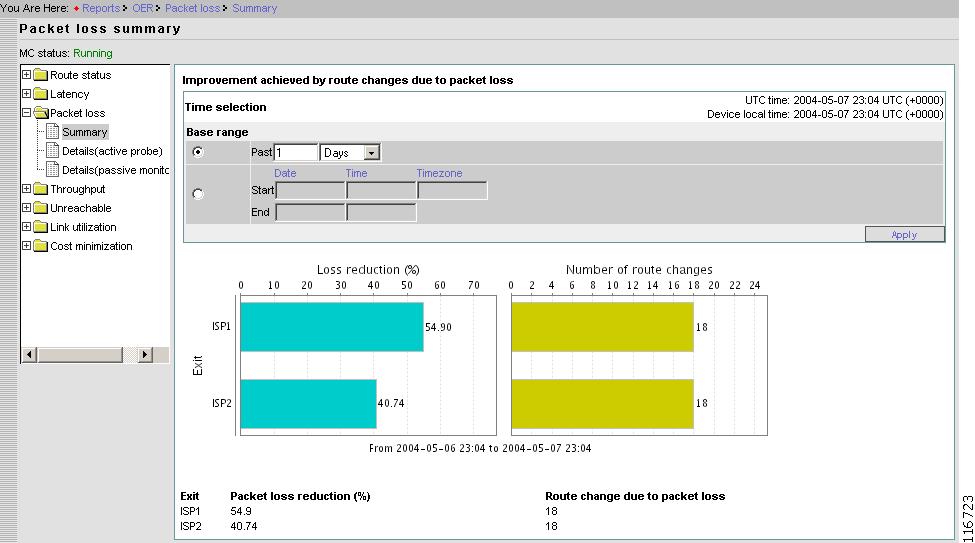
Summary
From the Contents list, open the menu under Packet loss, then click Summary.
Figure 2-52 Reports > Packet Loss > Summary
Details - Active Probe
Note
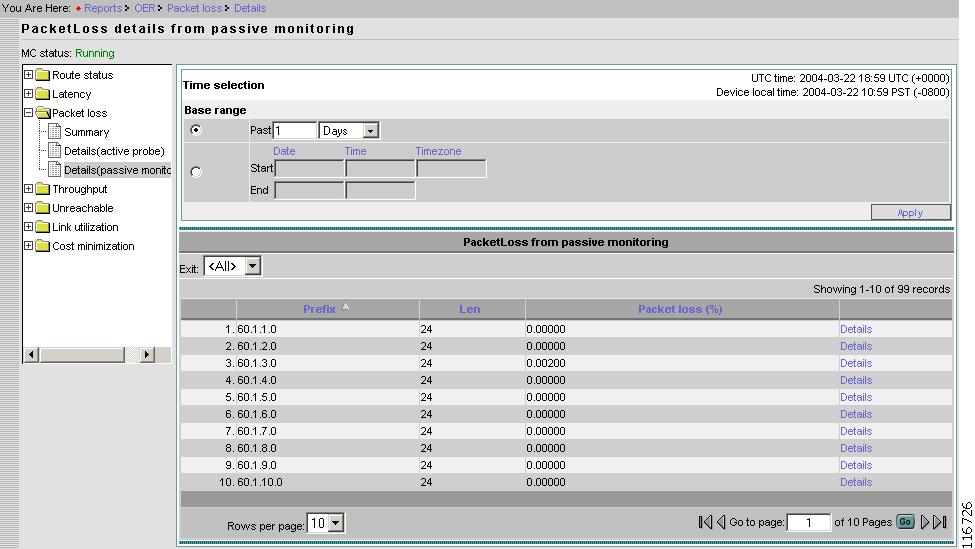
Details - Passive Monitoring
From the Contents list, open the menu under Packet loss, then click Details (passive monitoring).
Figure 2-53 Reports > Packet Loss > Details From Passive Monitoring
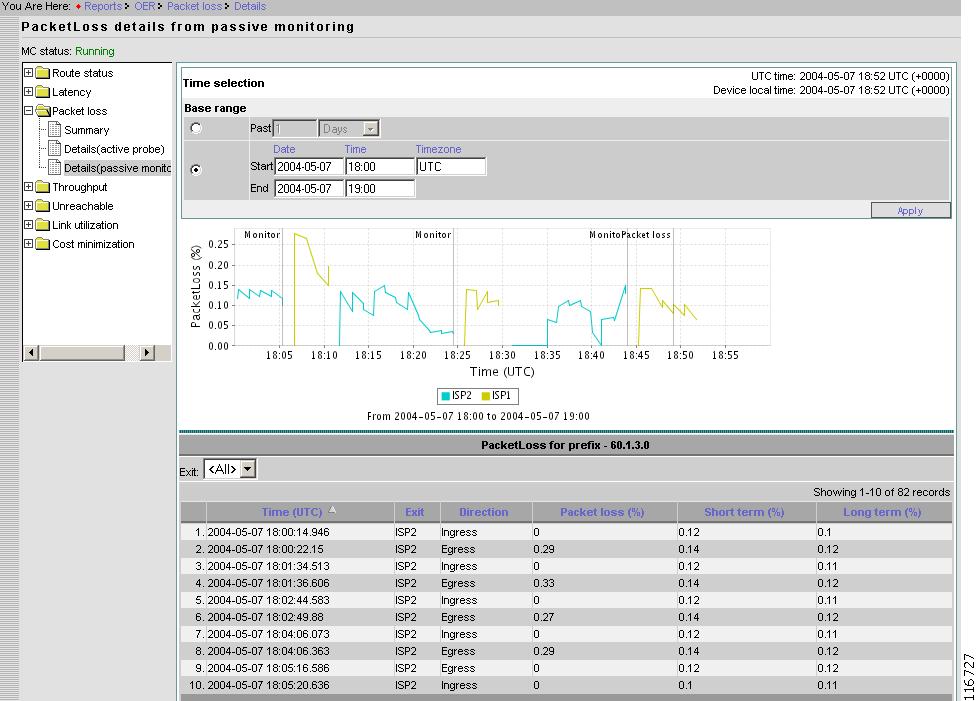
Passive Monitoring Details for Selected Prefix
From the PacketLoss details from passive monitoring page, select the probe of interest, then click Details.
Figure 2-54 Reports > Packet Loss > Details From Passive Monitoring > Prefix Details
Throughput
Under Throughput, you can find the following type reports:
•
•
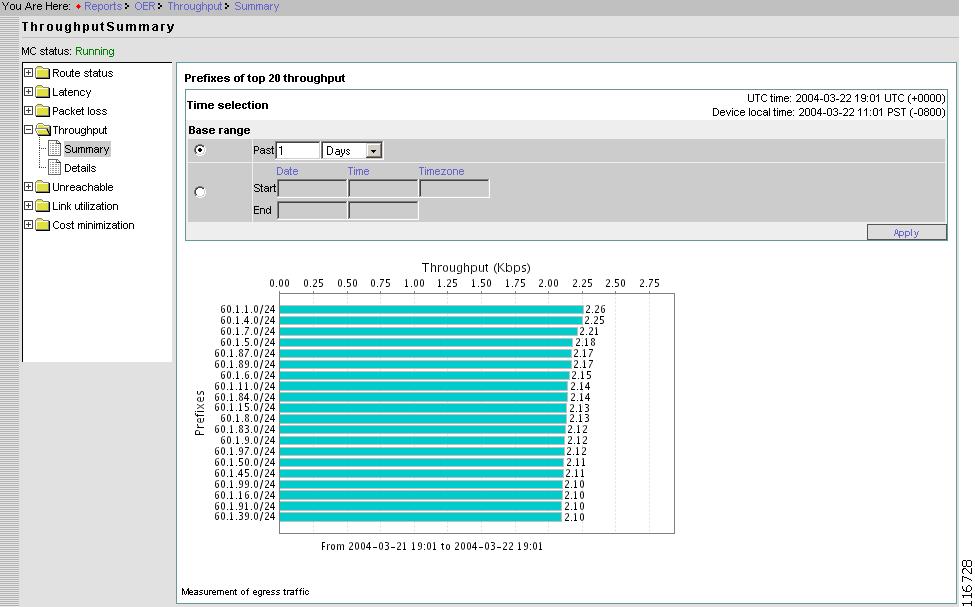
Summary
From the Contents list, open the menu under Throughput, then click Summary.
Figure 2-55 Reports > Throughput > Summary
This report provides the top 20 prefixes by average throughput observed during the selected duration.
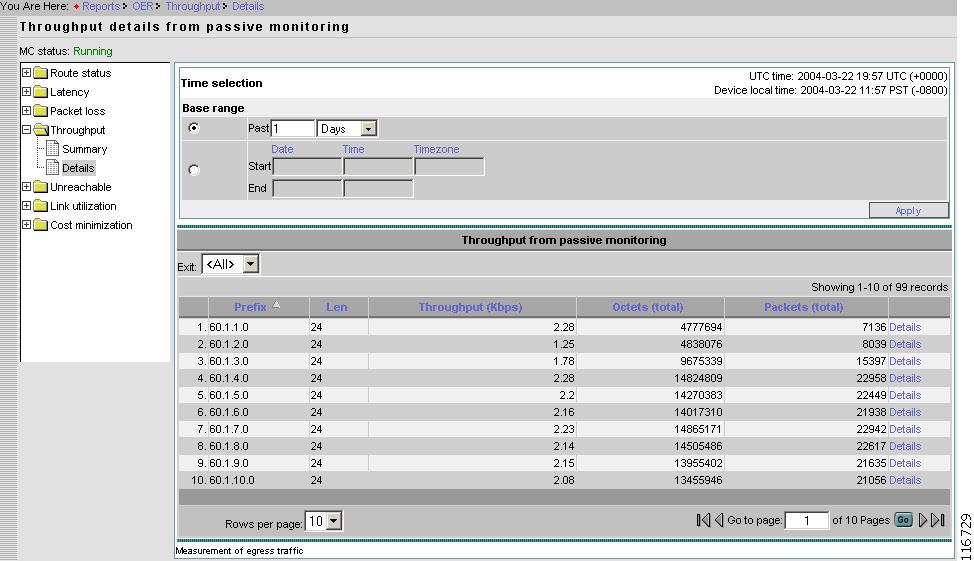
Details
From the Contents list, open the menu under Throughput, then click Details.
Figure 2-56 Reports > Throughput > Details
Prefix
Prefix.
Length
Prefix length.
Throughput
Throughput shown as rate of traffic.
Octets
Total egress octets.
Packets
Total number of packets.
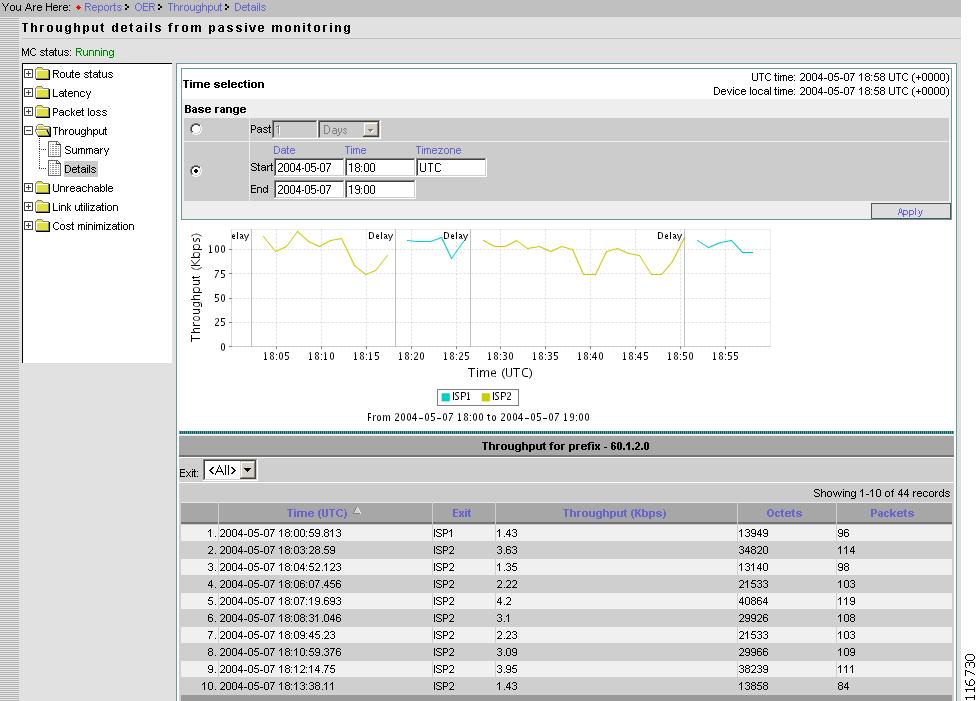
Details for Selected Prefix
From the Throughput details from passive monitoring page, select the probe of interest, then click Details.
Figure 2-57 Reports > Throughput > Details From Passive Monitoring> Prefix Details
Unreachable
Under Unreachable, you can find the following type reports:
•
•
•
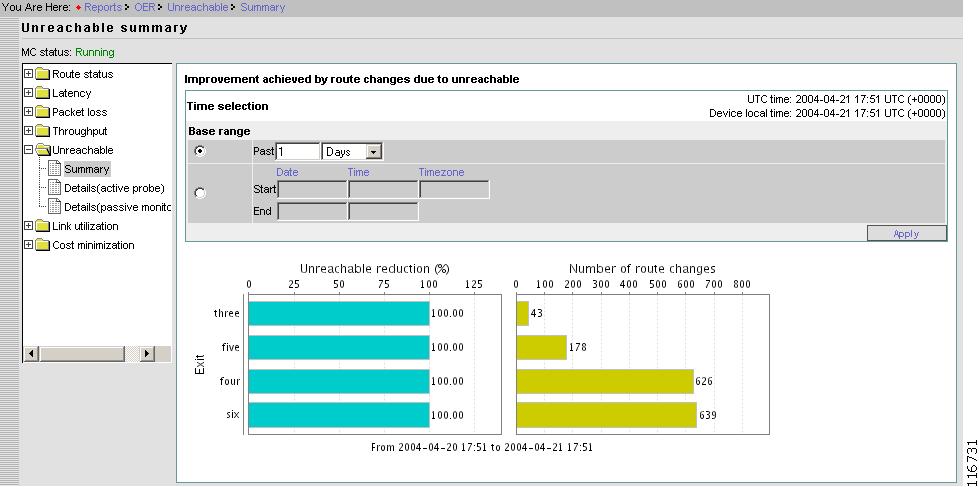
Summary
From the Contents list, open the menu under Unreachable, then click Summary.
Figure 2-58 Reports > Unreachable > Summary
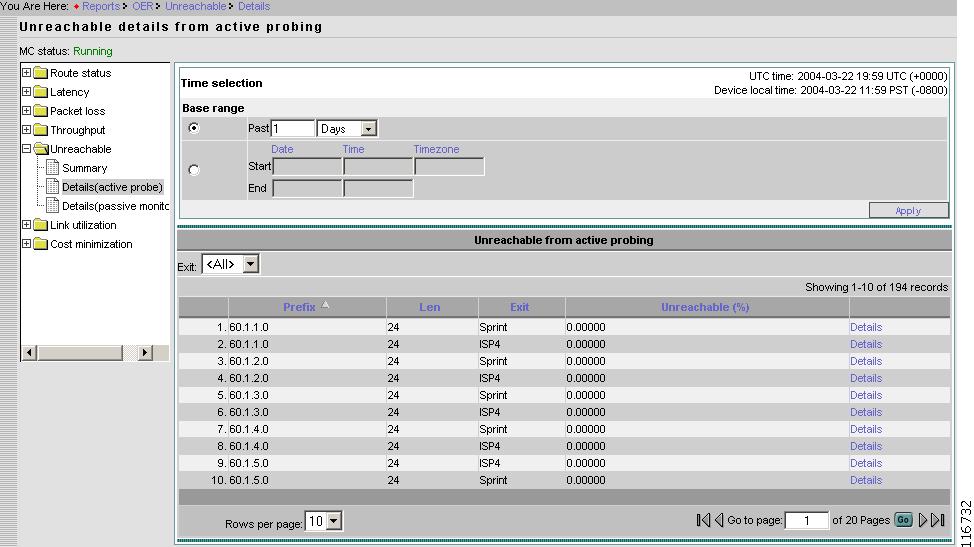
Detail - Active Probe
From the Contents list, open the menu under Unreachable, then click Details (active probe).
Figure 2-59 Reports > Unreachable > Details From Active Probe
Prefix
Prefix.
Length
Prefix length.
Exit
Exit for which the data is displayed. Or, you can select <All>.
Unreachable
Percentage unreachable.
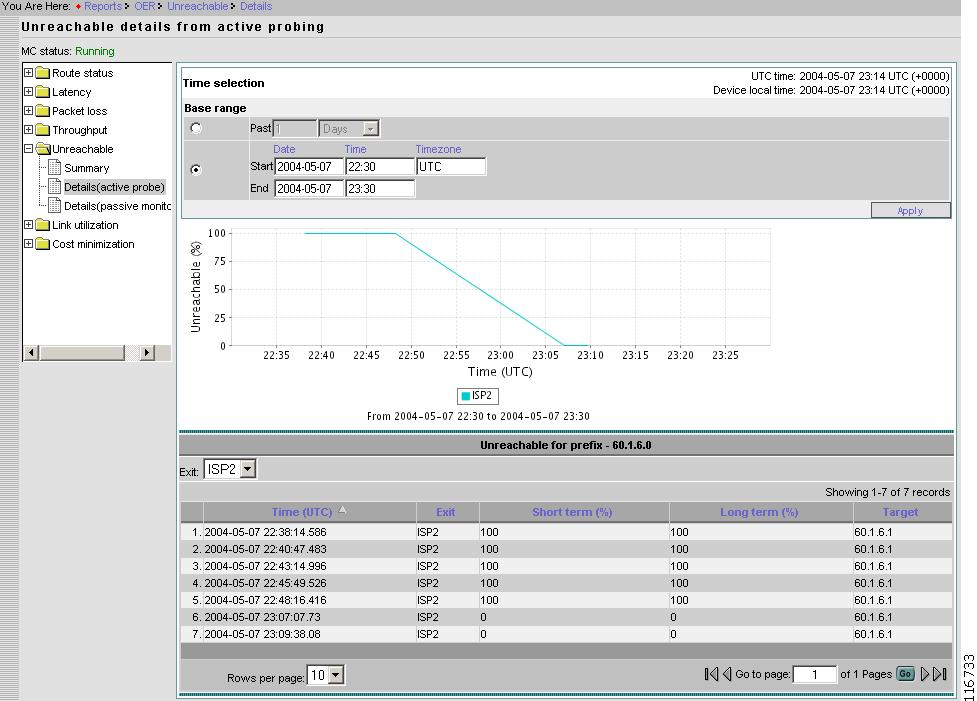
Active Probe Details for Selected Prefix
From the Unreachable details from active probing page, select the probe of interest, then click Details.
Figure 2-60 Reports > Unreachable > Details From Active Probe > Prefix Details
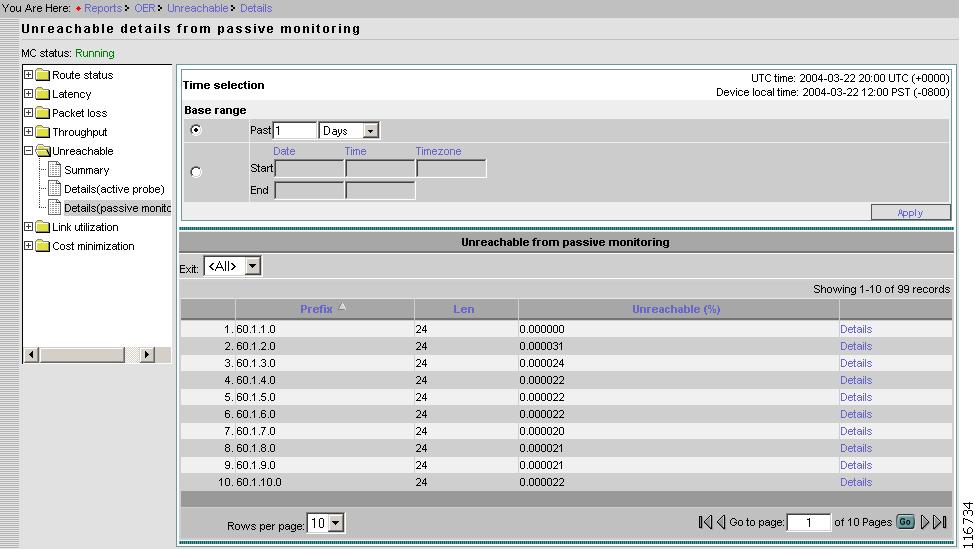
Details - Passive Monitoring
From the Contents list, open the menu under Unreachable, then click Details (passive monitoring).
Figure 2-61 Reports > Unreachable > Details From Passive Monitoring
Prefix
Prefix.
Length
Prefix length.
Exit
Exit for which the data is displayed. Or, you can select <All>.
Unreachable
Percentage Unreachable.
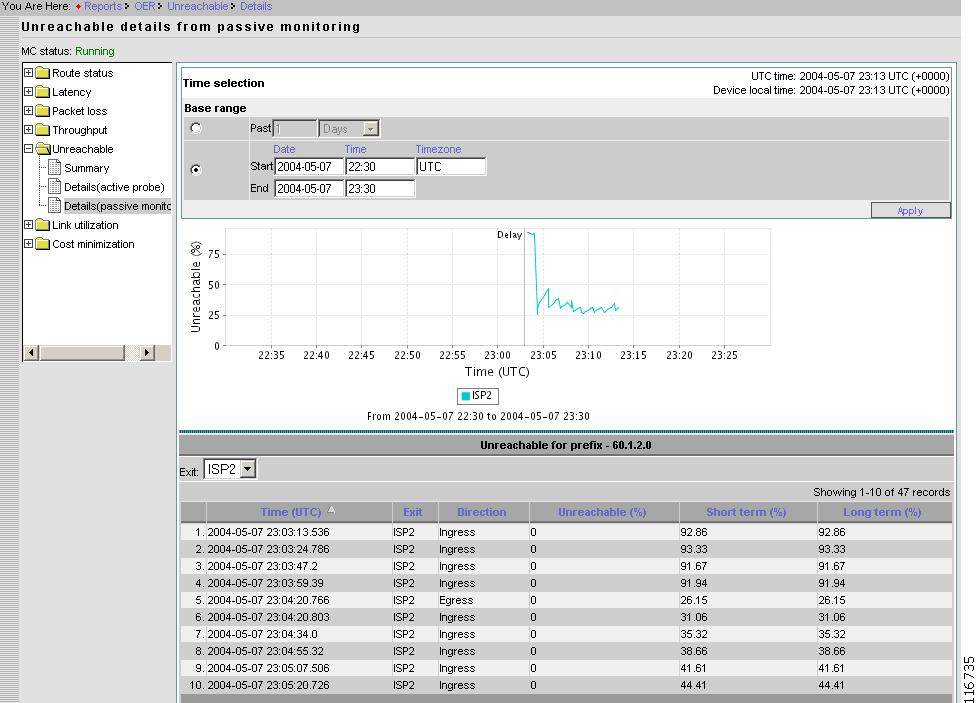
Passive Monitoring Details for Selected Prefix
From the Unreachable details from passive monitoring page, select the probe of interest, then click Details.
Figure 2-62 Reports > Unreachable > Details From Passive Monitoring > Prefix Detail
Link Unitization
Under Link Utilization, you can find the following type reports:
•
•
•
Summary
From the Contents list, open the menu under Link utilization, then click Summary.
Figure 2-63 Reports > Link Utilization > Summary
This graph shows throughput, 95th percentile throughput and utilization for ingress and egress direction of all the links for the selected time range.
Throughput and utilization are average values over the selected time range.
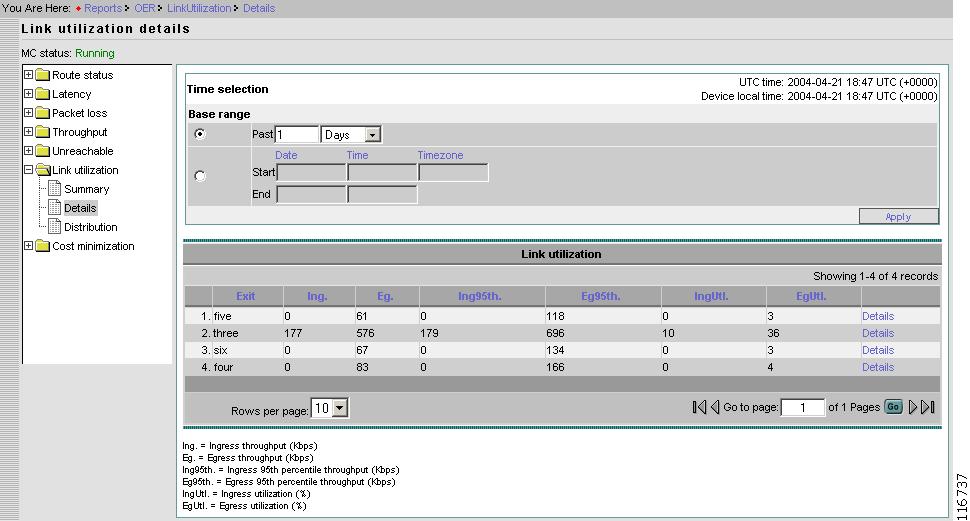
Details
From the Contents list, open the menu under Link utilization, then click Details.
Figure 2-64 Reports > Link Utilization > Details
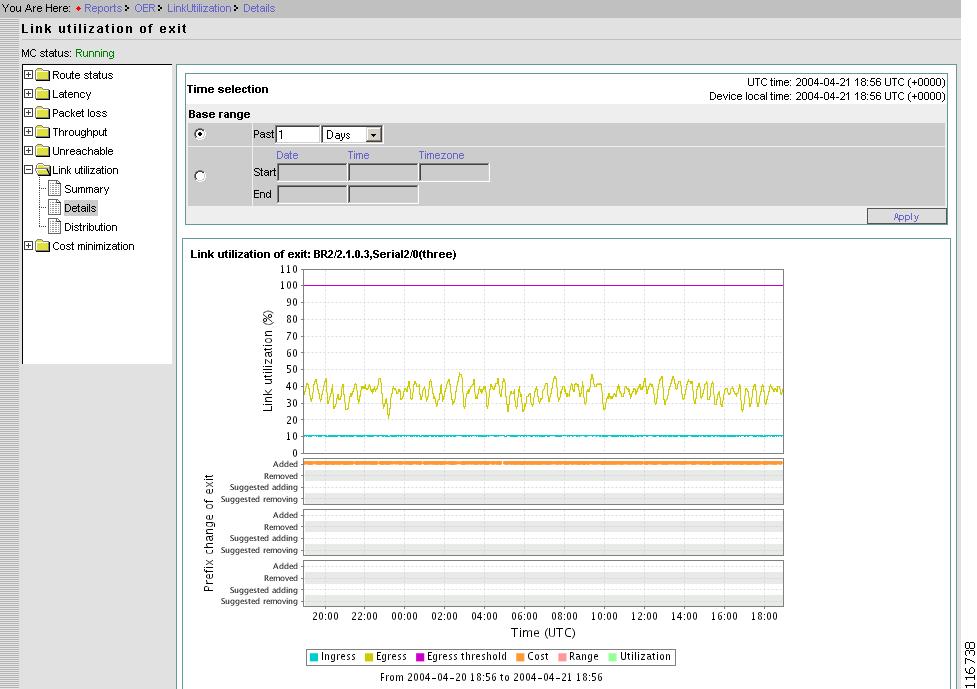
Link Utilization Details by Exit
From the Link utilization details page, select an Exit, then click Details.
Figure 2-65 Reports > Link Utilization > Details > Exit Details
The graph shows egress utilization, ingress utilization, and max-egress-utilization (configured) in a time series chart. It also shows the prefix added and removed, to and from the link at the bottom of the chart.
One dot is displayed for each prefix added and removed. Further more, if Prefix is in Observe mode, the dot is displayed on suggested adding or suggested removing. The dots are color coded based the reason it was added and removed, to and from the link.
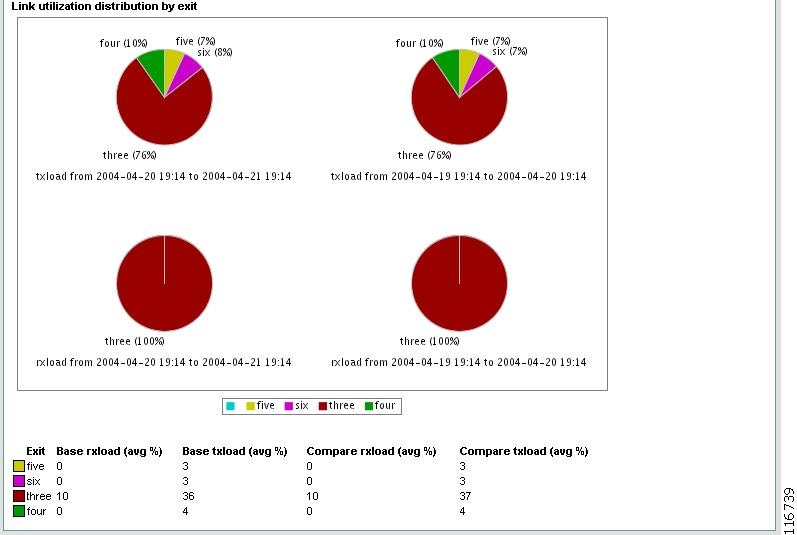
Distribution
From the Contents list, open the menu under Link utilization, then click Distribution.
Figure 2-66 Reports > Link Utilization > Distribution
This graph allows the you to compare distribution of traffic over two different periods.
The first period is called base range and the second period is called compare range.
The base range can be specified in two ways:
•
•
The compare range can also be specified in two ways:
•
•
Cost Minimization
Under Cost Minimization, you can find the following types of reports:
•
•
•
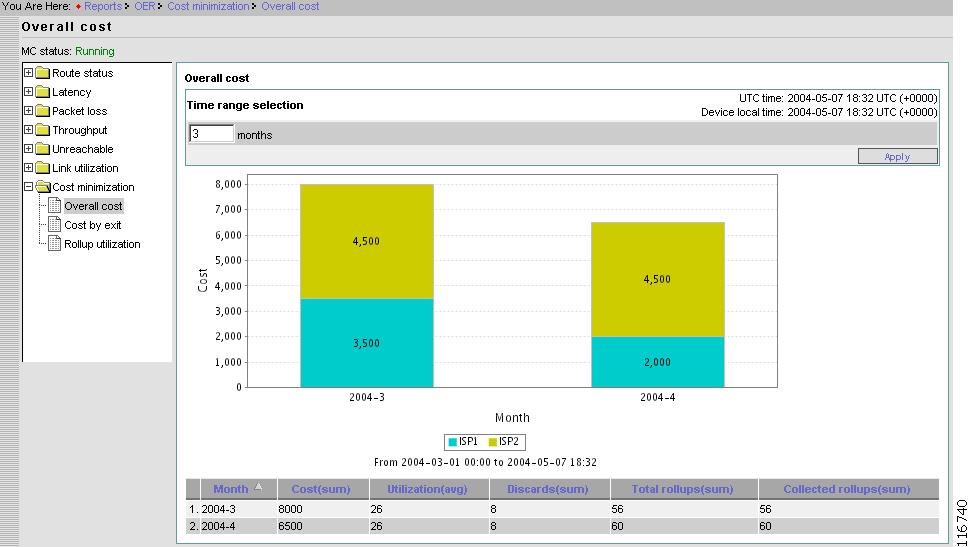
Overall
From the Contents list, open the menu under Cost minimization, then click Overall.
Figure 2-67 Reports > Cost Minimization > Overall
This page shows the overall cost for the number of billing periods selected.
For each billing period there is one stacked bar. The stack consists of the cost of each exit during that billing cycle.
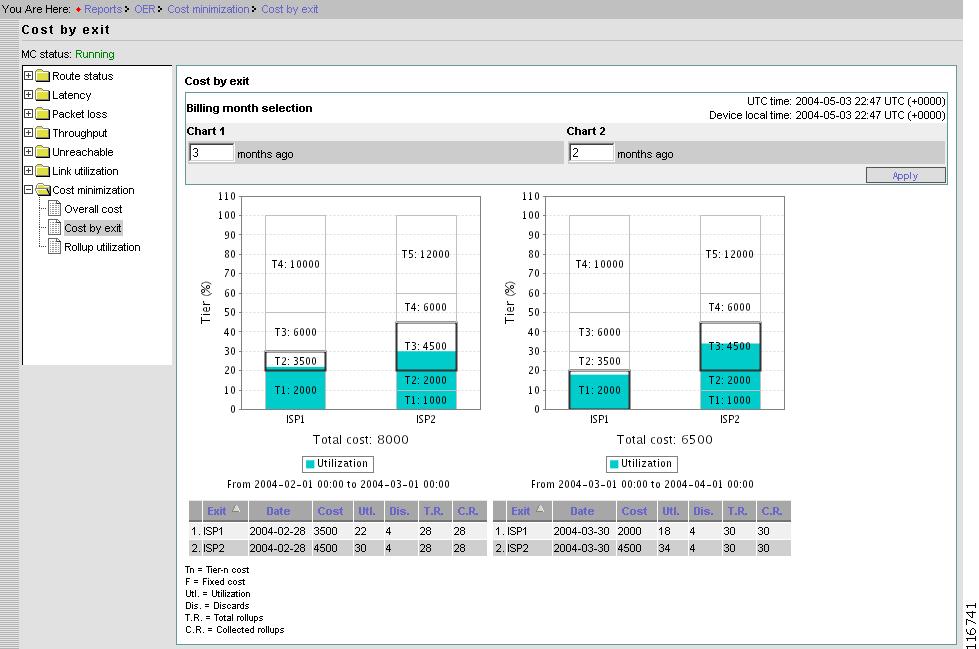
Cost by Exit
From the Contents list, open the menu under Cost minimization, then click Cost by exit.
Figure 2-68 Reports > Cost Minimization > Cost by Exit
The graph displays the cost of each Exit for two different billing periods. Zero months ago is the latest billing period. One month ago is the billing period before the latest one.
The graph shows stacked tiers on top of the sustained utilization. This gives an indication in which tier the sustained utilization falls.
The table at the bottom of the page shows more details about Cost Minimization configuration and data used for the billing period. Brief description of each item is shown below.
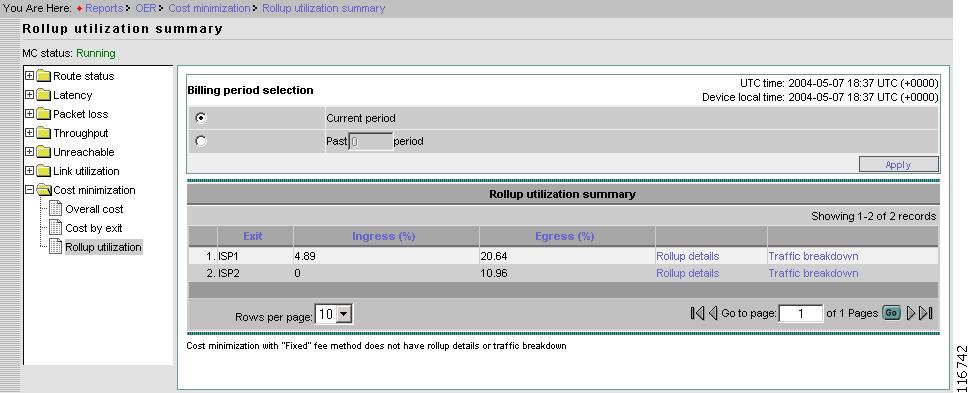
Rollup Utilization
From the Contents list, open the menu under Cost minimization, then click Rollup utilization.
Figure 2-69 Reports > Cost Utilization > Rollup Utilization Summary
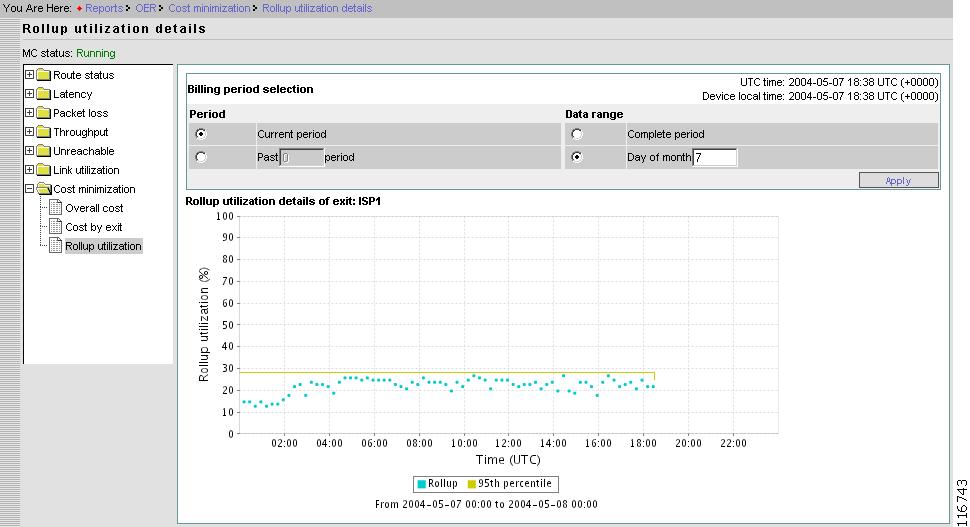
Rollup Details
From the Rollup utilization summary page, select an Exit, then click Rollup details.
Figure 2-70 Reports > Cost Utilization > Rollup Utilization > Rollup Details
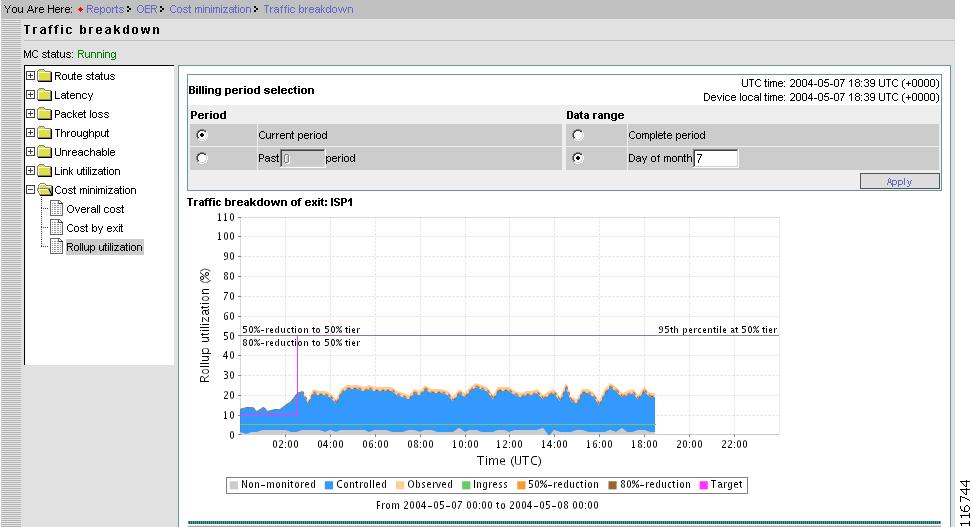
Traffic Breakdown
From the Rollup utilization summary page, select an Exit, then click Traffic breakdown.
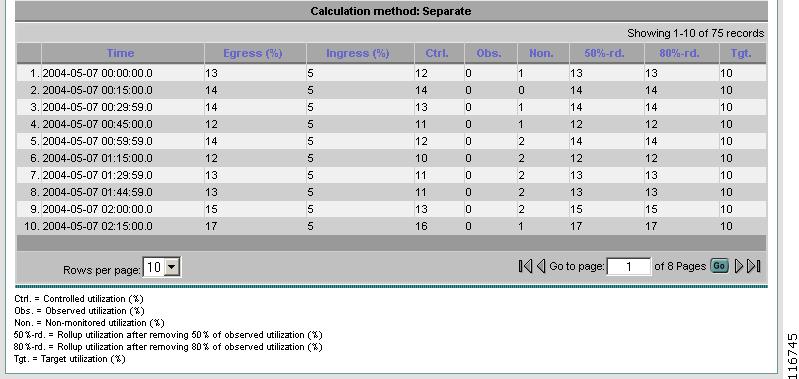
Figure 2-71 Reports > Cost Utilization > Rollup Utilization > Traffic Breakdown (Top Half)
This page shows the target utilization and actual utilization. The Cisco OER Master Controller Engine tries to keep actual utilization below the target utilization.
This page also shows egress utilization (summed utilization in case of Summed method) broken down into controlled, observed and non-monitored utilization.
In addition the graph also shows what would be the actual utilization if the Cisco OER Master Controller Engine was able to move 50%/80% of the observed traffic off of the link.
Figure 2-72 Reports > Cost Utilization > Rollup Utilization > Traffic Breakdown (Bottom Half)
Troubleshooting
Troubleshooting main function displays the error and debug messages logged. There are two categories of logs:
•
•
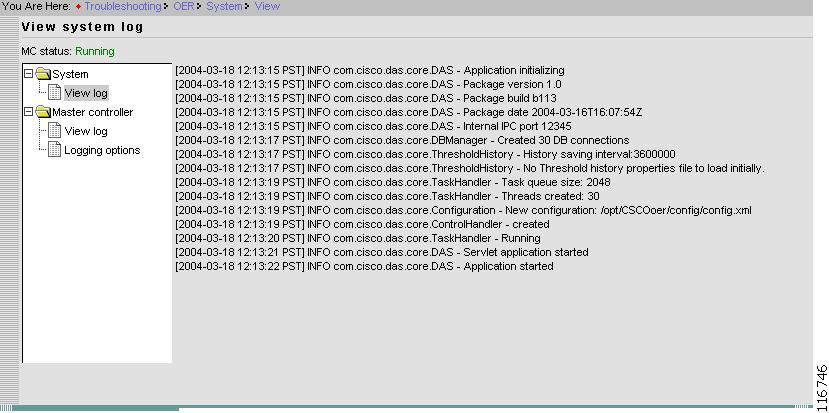
System Log
System log contains the messages pertaining to overall system. This yields logging of the Cisco OER Master Controller Engine startup, start, and stop activity.
Figure 2-73 Troubleshooting > System > View Log
Note
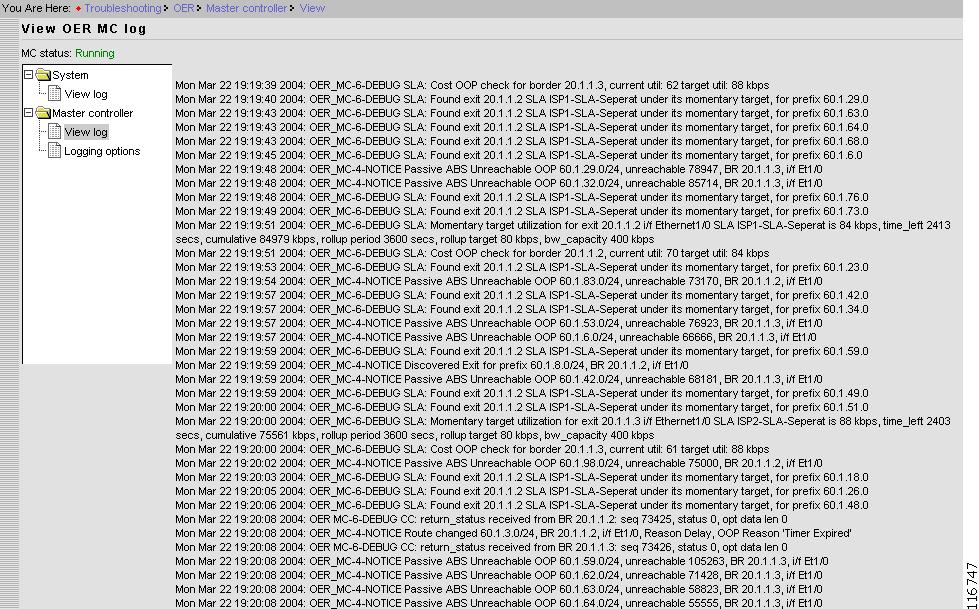
Master Controller Log
The Master Controller log contains the error and debugging messages for Cisco OER Master Controller Engine operations.
This yields logging of events after the Cisco OER Master Controller Engine is up and running.
Figure 2-74 Troubleshooting > Master Controller > View Log
Usually, communication between the Cisco OER Master Controller Engine and border routers are logged. Each message is prefixed with local timestamp. Messages also contains the severity.
All the message with DEBUG severity also contains a component name. For example, following DEBUG message is from Communication Control (CC):
Mon Aug 11 11:20:27 2003: OER MC-6-DEBUG CC: BR TT status received: 10
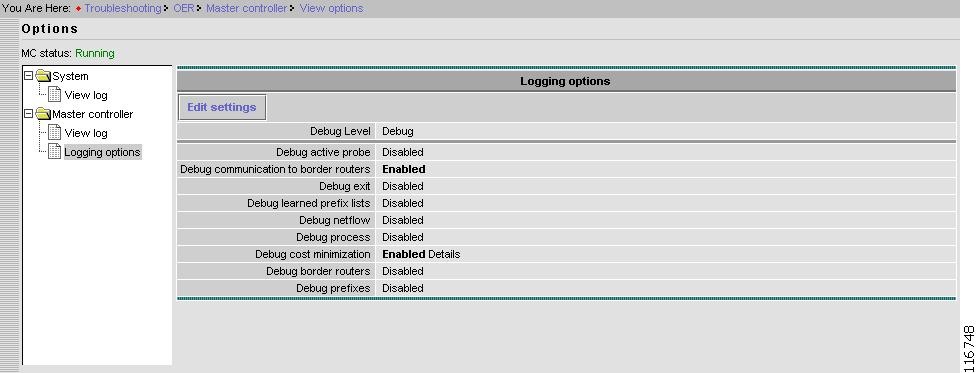
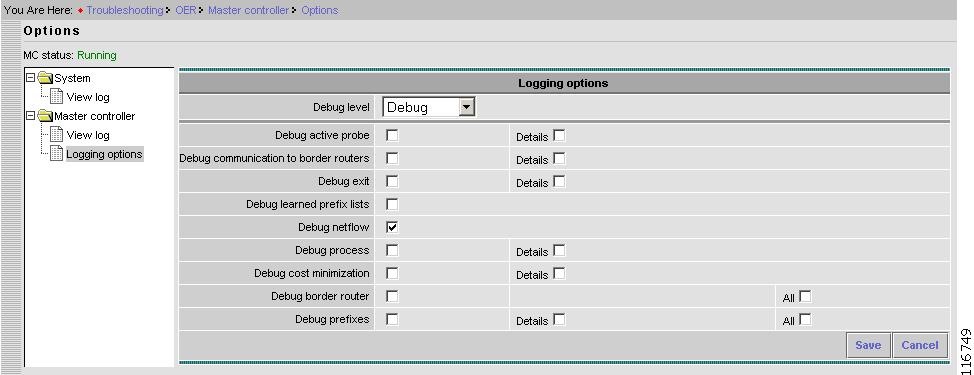
Logging Options
From the Contents list, under Troubleshooting select Master controller, then Logging options.
Figure 2-75 Troubleshooting > Master Controller > Logging Options
Edit Settings
From the Options page, click Edit Settings.
Figure 2-76 Troubleshooting > Master Controller > Logging Options > Edit Settings
How to Set up Logging Messages Specific to a Prefix
Step 1
Step 2
Step 3
Step 4
The Logging options page appears showing Debug prefixes as Enabled.
Step 5
Step 6
Step 7
Step 8
Step 9