Feedback
|
Table Of Contents
Starting the IPM Client on Windows
Running Simultaneous IPM Sessions
Configuring the IPM Components
Viewing Network Performance Statistics
Viewing Network Performance Statistics in Real Time
Viewing Historical Network Performance Statistics
Getting Started with IPM
This chapter provides information on starting the IPM application and configuring a collector to gather latency data. It includes the following major sections:
•
Running Simultaneous IPM Sessions
•
Configuring the IPM Components
•
Viewing Network Performance Statistics
Starting IPM
Because the IPM application is comprised of a server component and a client component, you must start both components to run the application. If you have installed the IPM server and client on the same workstation, then you can start the IPM server and client using a single command. You can also start the IPM server and client separately.
The following sections provide details for starting the IPM server and client:
•
Starting the IPM Client on Windows
Starting IPM on Solaris
To start the IPM server and client on a Solaris workstation, enter the following commands:
# cd /opt/CSCOipm/bin# ./ipm
Note
The default directory for installing IPM is /opt. If you installed IPM in a different directory, then you must specify that directory instead of /opt.
To start just the IPM server on a Solaris workstation, enter the following commands:
# cd /opt/CSCOipm/bin# ./ipm start server
Note
To issue the ipm start server command, you must be logged in as the root user.
To start just the IPM client on a Solaris workstation, enter the following commands:
# cd /opt/CSCOipm/bin# ./ipm start clientIf you installed the IPM client on a different Solaris workstation from the default IPM server, you must issue the ipm start command from the /opt/CSCOipmClient/bin directory. To start the IPM client on a different Solaris workstation from the default IPM server, enter the following commands:
# cd /opt/CSCOipmClient/bin# ./ipm start clientTo start the IPM client and connect to a different IPM server than the default server, enter the following commands:
# cd /opt/CSCOipmClient/bin# ./ipm start client server_nameWhere server_name is the Solaris workstation where the IPM server is running.
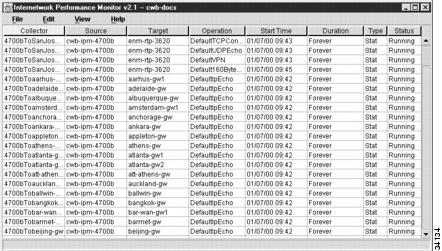
When the IPM client starts, it displays the IPM Main window (Figure 2-1). The name of the workstation where the IPM server is running is displayed in the title bar of the IPM Main window.
Figure 2-1 IPM Main Window
When you start IPM for the first time, the IPM Main window contains no collectors. As you configure collectors, they are displayed in this window. Each collector is a combination of a configured source, a target, and an operation. For each collector, you specify parameters for gathering statistics, generating event notifications, and scheduling.
Starting the IPM Client on Windows
When you install the IPM client on a Windows 95, Windows 98, or Windows NT workstation, the installation program adds two icons to your desktop: one icon for connecting to the IPM server that you specified during installation and one icon for connecting to any IPM server.
To start the IPM client on a Windows workstation and connect to the default IPM server:
Step 1
Make sure that the IPM server that you are connecting to is currently running.
Step 2
Double click on the IPM client icon on your desktop. The IPM client starts and displays the IPM Main window (Figure 2-1).
To start the IPM client on a Windows workstation and connect to any IPM server:
Step 1
Make sure that the IPM server that you are connecting to is currently running.
Step 2
Double-click on the IPM Any Server icon on your desktop. A prompt is displayed asking you for the name of the IPM server to which you want to connect.
Step 3
Type the IPM server name and click OK. The IPM client starts and displays the IPM Main window (Figure 2-1).
Running Simultaneous IPM Sessions
IPM uses a client/server architecture that allows you to run multiple sessions of the IPM client simultaneously. Central services and database functions are provided on an IPM server that communicates to multiple IPM clients. You can install the IPM client software on the same workstation as the IPM server or on a different workstation on the same network as the IPM server.
Note
Running multiple IPM clients on the same network and connecting to the same IPM server might impact the server's performance. For a large network, use multiple IPM clients connected to multiple IPM servers.
Configuring the IPM Components
To collect network performance metrics using IPM, you must define a collector in a source router. A collector is a definition of a source router, a target device, an operation, and a collector schedule.
To define a collector, complete the following tasks:
Defining a Source Router
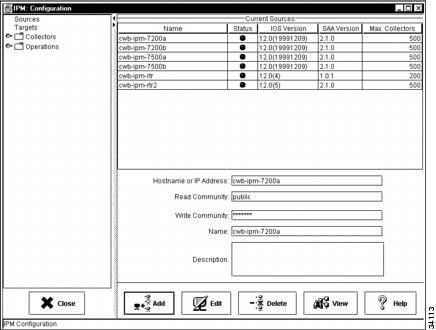
IPM source routers are the routers from which packets are sent to measure and store statistical data, including network latency, jitter, availability, packet loss, and errors. Each source router must contain the Cisco IOS software SAA feature.
The types of operations that you can use are determined by the version of the Cisco IOS software running on the source router. IPM automatically checks the Cisco IOS software version on the router and limits the creation of operations to those supported by the source router. For information on the recommended versions of Cisco IOS software to use with IPM, see the "Cisco IOS Software Requirements" section of the Cisco Internetwork Performance Monitor Installation Guide.
To define a new source router:
Step 1
Verify that the SNMP read community and write community strings are configured properly on the router.
Step 2
(Optional) If you want to receive traps at your network management system (NMS), verify that the router is configured to send SAA-generated traps to your NMS.
For information on configuring SNMP on the source router, see the "Configuring Your Routers to Send SAA-Related Traps" section in "Preparing to Install" chapter of the Cisco Internetwork Performance Monitor Installation Guide.
Step 3
From the IPM Main window (Figure 2-1), select Edit > Configuration. The Configuration window (Figure 2-2) is displayed. By default Sources is selected in the navigation pane and the Source Configuration window is displayed within the Configuration window.
Figure 2-2 Configuration Window—Source Configuration
Step 4
In the Hostname or IP Address field, enter the host name or IP address of the router to use as the source for network performance measurements. This host name can be from 1 to 64 characters in length.
Step 5
In the Read Community field, enter the SNMP community name for read access to the information maintained by the SNMP agent on the source router. This value can be from 1 to 32 characters in length. The default value is public.
Step 6
In the Write Community field, enter the SNMP community name for write access to the information maintained by the SNMP agent on the source router. This value can be from 1 to 32 characters in length.
Step 7
In the Name field, enter a name to assign to the source router. By default, this field matches the Hostname or IP Address field, but you can modify the name.
Step 8
(Optional) In the Description field, enter a brief description of the source router.
Step 9
Click Add. IPM attempts to locate the router and determine whether or not it is SNMP enabled with the correct community string. If the router is successfully located, IPM adds it to the IPM database. If IPM cannot reach the router, IPM displays an error message.
Note
If you specify an IP address instead of a hostname and that IP address cannot be resolved by standard address resolution techniques, then IPM assumes that the IP address is valid and does not resolve to a hostname.
Step 10
Click OK to close the Configuration window and return to the IPM Main window.
For information on using a seed file to add source routers to IPM, see the "Adding Source Routers Using a Seed File" section. For information on modifying or deleting source routers, see the "Working with Source Routers" section.
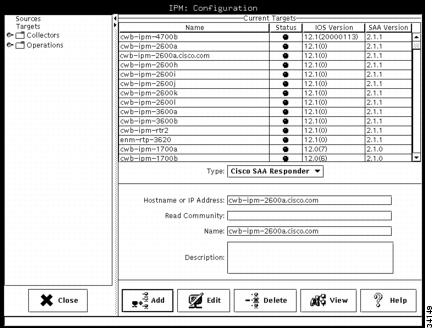
Defining a Target
IPM targets are destination devices for which you want to gather data. A target can be any IP-addressable device, a Cisco SAA responder, or an SNA host.
To define a device as a target:
Step 1
Select Edit > Configuration from the IPM Main window (Figure 2-1). The Configuration window (Figure 2-2) is displayed.
Step 2
Click Targets. The Target Configuration window (Figure 2-3) is displayed within the Configuration window.
Figure 2-3 Target Configuration Window
Step 3
In the Target Type field, select the protocol type to be used with this target. The possible values are:
•
IP—IP/ICMP Echo. Any IP-addressable device. Requires a destination IP address or host name.
•
Cisco SAA Responder—Component embedded in a target Cisco router that is running a version of the Cisco IOS software that supports the SAA feature. Its function is to respond to SAA request packets from a source router running the SAA software. The SAA responder must be enabled at the router using the rtr responder configuration command.
•
SNA—SNA LU Type 0 or Type 2 connection to Cisco's NSPECHO host application, or SNA SCCP-LU Native Echo. Requires the PU name defined for the SNA PU connection to VTAM.
NSPECHO must be installed on the VTAM mainframe to used as the target. The NSPECHO application is provided on the IPM product CD. For information on installing NSPECHO, see the "Installing NSPECHO to Measure SNA Response Times" chapter in the Cisco Internetwork Performance Monitor Installation Guide.
Step 4
If the target type is IP, enter the host name or IP address of the target device in the Host Name or IP Address field.
Step 5
If the target type is Cisco SAA Responder, enter the host name or IP address of the target device in the Host Name or IP Address field. In the Read Community field, enter the SNMP community name for read access to the information maintained by the SNMP agent on the target device. The default value is public.
Step 6
If the target type is SNA, enter the SNA host name of the target device in the PU Name field.
Step 7
In the Name field, enter a name to assign to the target. By default, this field matches the Hostname, IP Address, or PU Name field, but you can modify the name.
Step 8
(Optional) In the Description field, enter a brief description of the target.
Step 9
Click Add. IPM adds the newly defined target to the IPM database.
Note
If you specify an IP address instead of a hostname and that IP address cannot be resolved by standard address resolution techniques, then IPM assumes that the IP address is valid and does not resolve to a hostname.
Step 10
Click OK to close the Configuration window and return to the IPM Main window.
For information on using a seed file to add targets to IPM, see the "Adding Targets Using a Seed File" section. For information on modifying or deleting targets, see the "Working with Target Devices" section.
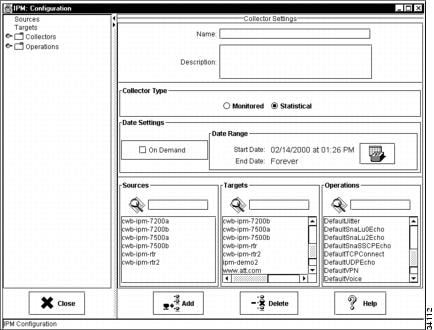
Defining a Collector
Defining a collector involves selecting a source router, a target, an operation, and a collector schedule.
Note
After you configure a collector, you cannot change its attributes.
To define a new collector:
Step 1
From the IPM Main window (Figure 2-1), select Edit > Configuration. The Configuration window (Figure 2-2) is displayed.
Step 2
Click Collectors. The Collector Configuration window (Figure 2-4) is displayed within the Configuration window.
Figure 2-4 Collector Configuration Window
Step 3
In the Name field, enter a name to assign to the collector.
Step 4
(Optional) In the Description field, enter a brief description of the collector.
Step 5
In the Collector Type field, select the Statistical option to gather data and store it in the IPM database for future analysis. If the Monitored option is selected, you can monitor for threshold violations and view data in real-time, but network performance data is not stored in the IPM database. By default the Collector type is set to collect statistics.
Step 6
Do one of the following tasks to define the schedule for the collector:
•
To configure and start the collector at a later time, enable the On Demand option and go to Step 11.
•
To specify when the collector starts, click Set Date. The Set Date Range window is displayed (Figure 2-5). By default the collector schedule is set to start now and run forever.
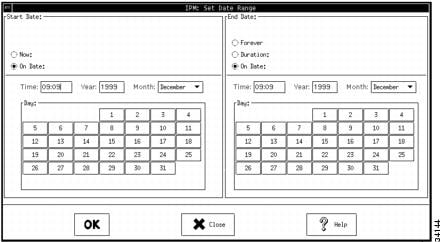
Figure 2-5 Set Date Range Window
Step 7
Specify a start date for the collector. The following options are available:
•
Now—Starts the collector immediately after it is configured.
•
On Date—Starts the collector at the date and time that you specify. If you select this option, you must specify the time based on a 24-hour clock, specify the year in the format YYYY, select the month from the month list, and select the date from the calendar. The default start date is the current date and time.
Note
If the date selected9 is in the future, then the collector's status in the IPM Main window is SCHEDULE_PENDING. At the scheduled start time, IPM configures the collector in the router and the status is reflected in the IPM Main window.
Step 8
Specify an end date for the collector. The following options are available:
•
Forever—Allows the collector to run continuously until you stop it by selecting Edit > Stop from the IPM Main menu.
•
Duration—Stops the collector after the specified length of time has expired. You can specify the duration in any combination of days, hours, and minutes.
•
On Date—Stops the collector at the date and time that you specify. If you select this option, you must specify the time based on a 24-hour clock, specify the year in the format YYYY, select the month from the month list, and select the date from the calendar. The default end date is exactly one day from the current date and time.
Step 9
Click OK. The start time and end time that you specified are defined for the collector.
Step 10
From the Sources list, select the router to designate as the source router for initiating test packets. If you already know the name of the router, start typing the name in the Search field and the cursor moves to the matching router in the Sources list.
Step 11
From the Targets list, select the device to designate as the target. If you already know the name of the target, start typing the name in the Search field and the cursor moves to the matching target in the Targets list.
Note
If you select a DNS or DHCP operation, the Targets list is disabled because these operations do not use targets.
Step 12
From the Operations list, select the operation to use for this collector. If you already know the name of the operation, start typing the name in the Search field and the cursor moves to the matching operation in the Operations list.
When you install IPM, a group of predefined operations are provided. The predefined operations are described in Table 2-1.
You can also define one or more new operations to fit your needs. Although the default operations cannot be modified, you can use them as templates for creating your own operations. For information on defining, modifying, or deleting operations, see the "Working with Operations" section.
Step 13
Click Add. IPM adds the newly defined collector to the IPM database.
Step 14
Click Close to close the Configuration window and return to the IPM Main window. The newly defined collector has been added to the list of collectors in the IPM Main window.
For information on using a seed file to add collectors to IPM, see the "Adding Collectors Using a Seed File" section. For information on viewing or deleting collectors, see the "Working with Collectors" section.
Viewing Network Performance Statistics
As your collectors begin to gather network performance statistics and store the information in the IPM database, you can view the resulting data.
IPM provides two methods for reviewing network performance statistics:
•
Viewing Network Performance Statistics in Real Time
•
Viewing Historical Network Performance Statistics
Viewing Network Performance Statistics in Real Time
The Real Time Statistics window allows you to view statistics for an active collector as the data is being collected. This data is only displayed in real time, it is not stored in the IPM database.
To view statistics in real time:
Step 1
From the IPM Main window (Figure 2-1), select the collector to be viewed.
Step 2
Select View > Real Time. The Real Time Statistics window (Figure 2-6 and Figure 2-7) is displayed.
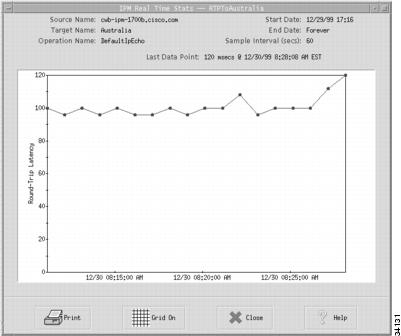
Figure 2-6 Real Time Statistics Window
Figure 2-7 Jitter Real Time Statistics Window
Statistics are displayed as soon as the frequency interval elapses. Data points will be added to the graph for each interval that the statistics are measured for the selected collector.
Viewing Historical Network Performance Statistics
To view statistics gathered over an historical monitoring period:
Step 1
From the IPM Main window (Figure 2-1), select the collector to be viewed.
Step 2
Select View > Statistics. The Statistics Data Filter window (Figure 2-8) is displayed.
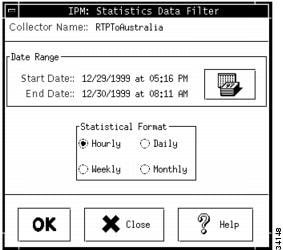
Figure 2-8 Statistics Data Filter Window
In this window, you specify the time period for which you want to view statistics. You can view statistics for all or part of the time that the data was collected. When this window is displayed, by default the start date is set to the starting date for the collector and the end date is set for one day from the start date.
Step 3
To change the date range, click the Calendar icon. The Set Date Range window is displayed (Figure 2-5).
Step 4
Specify a start date for the statistics that you want to view. The following options are available:
•
Now—Sets the start date to the current date and time.
•
On Date—Sets the start date and time that you specify. If you select this option, you must specify the time based on a 24-hour clock, specify the year in the format YYYY, select the month from the month list, and select the date from the calendar. The default start date is the date and time that the collector was created.
Step 5
Specify an end date for the statistics that you want to view. The following options are available:
•
Duration—Sets the end date so that statistics are displayed for the period of time that you specify. You can specify the duration in any combination of days, hours, and minutes.
•
On Date—Sets the end date and time that you specify. If you select this option, you must specify the time based on a 24-hour clock, specify the year in the format YYYY, select the month from the month list, and select the date from the calendar. The default end date is the current date and time.
Step 6
Click OK. The start time and end time that you specified are defined for the collector.
Step 7
In the Statistics Format field, specify the initial increment for the granularity for displaying the statistical graphs. Choose one of the available options: Hourly, Daily, Weekly, or Monthly.
By default, IPM automatically selects the option that best matches the amount of data currently in the IPM database for the selected collector.
Step 8
Click OK. The Historical Statistics window (Figure 2-9 and Figure 2-10) is displayed.
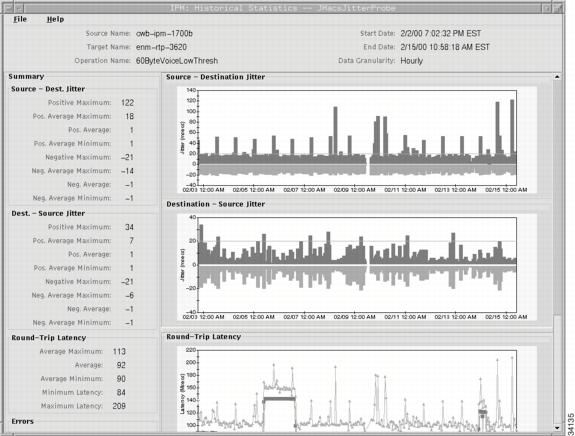
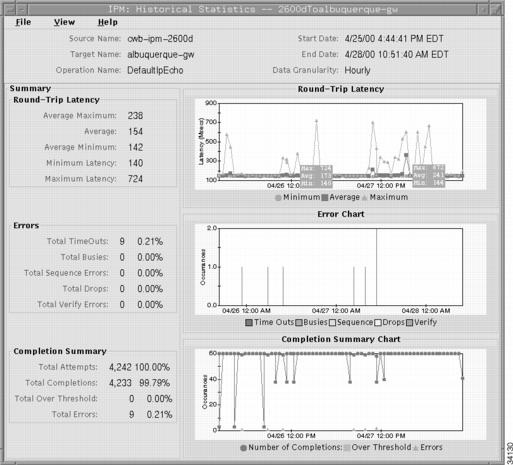
Figure 2-9 Historical Statistics Window—IP Echo Collector
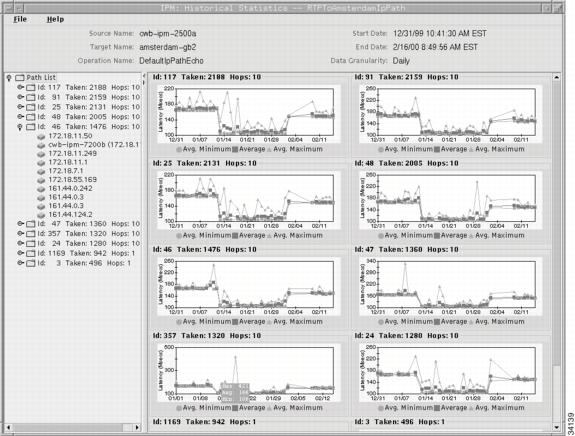
Figure 2-10 Historical Statistics Window—IP Path Echo Collector
Table 2-2 describes the actions that you can perform from the Historical Statistics window.
Printing IPM Statistics
You can display statistics in graphical and tabular format in the Real Time Statistics window and in the Historical Statistics window.
To print the data:
Step 1
Display the window containing the data that you want to print, either the Real Time Statistics window or the Historical Statistics window for a specific collector.
Step 2
Select File > Print. The Print Dialog window (Figure 2-11) is displayed.
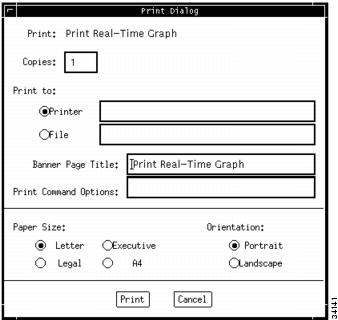
Figure 2-11 Print Dialog Window
Step 3
Enter data in the following fields:
•
Copies—Specify the number of copies that you want to print. The default setting is 1 copy.
•
Print to—Specify whether you want the data printed to a printer or saved to a file. If printing to a printer, specify the name of the printer. If saving to a file, specify the directory and filename.
•
Paper Size—Specify whether you want the data printed on Letter, Legal, Executive, or A4 paper. The default setting is Letter.
•
Orientation—Specify whether you want the data printed in a Landscape or Portrait orientation on the page. The default setting is Portrait.
Step 4
Click Print. IPM sends the output to the printer or file that you specified.
Exiting the IPM Client
When you are finished monitoring network performance statistics, you can exit the IPM client by completing the following steps:
Step 1
From the IPM Main window (Figure 2-1), select File > Exit. A confirmation window (Figure 2-12) is displayed.
Figure 2-12 Confirmation Window for Exiting IPM
Step 2
Click Yes to close the IPM client application.
Collectors that were still running when you closed the IPM client will continue to run and gather statistics until they reach the end date specified in the collector configuration. For collectors defined to run forever, they will continue to run and gather statistics until you stop them.
To shut down the IPM servers completely, use the ipm stop command. To stop gathering statistics, stop the collectors before exiting the IPM client. When you stop a collector, the gathered data for that collector is still available for viewing.
Note
Collectors remain in the database until you uninstall the IPM software from the workstation or directly delete the collectors from the IPM server.
Feedback


