排除IOS XE上的Netflow故障
簡介
本檔案介紹如何對Cisco IOS® XE技術上的Netflow進行故障排除。
必要條件
需求
思科建議您瞭解以下主題:
- Netflow
- Cisco IOS XE
有關這些主題的詳細資訊,請參閱:
Flexible Netflow概述
設定Flexible NetFlow(Catalyst 9300交換器)
設定Flexible NetFlow(Catalyst 9400交換器)
設定Flexible NetFlow(Catalyst 9500交換器)
配置Flexible NetFlow(Catalyst 9600交換機)
採用元件
本檔案中的資訊是根據Cisco IOS XE軟體。
本文中的資訊是根據特定實驗室環境內的裝置所建立。文中使用到的所有裝置皆從已清除(預設)的組態來啟動。如果您的網路運作中,請確保您瞭解任何指令可能造成的影響。
對思科路由器上的NetFlow進行故障排除
網路圖表
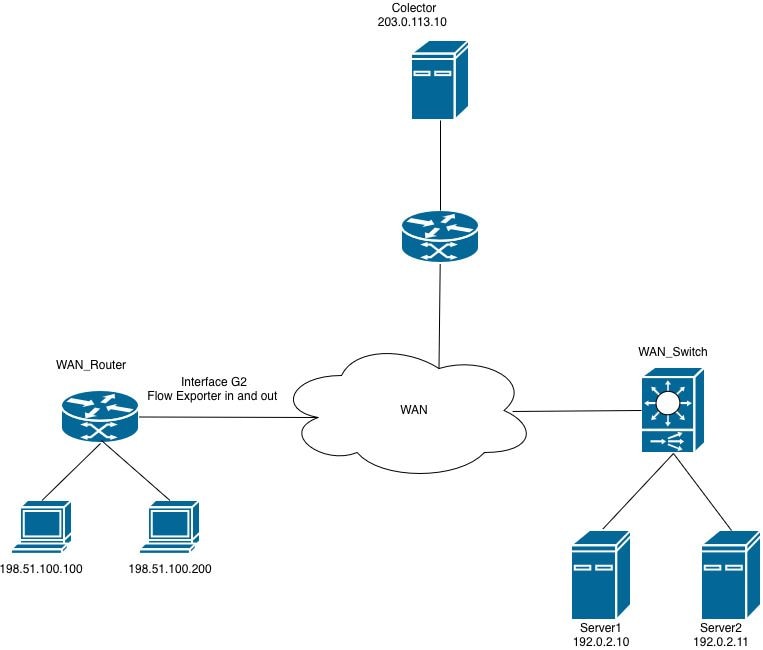 路由器上的Netflow
收集器沒有從路由器接收NetFlow匯出資料包(CFURS)
收集器沒有從介面GigabitEthernet2上的路由器接收資訊。
步驟1.驗證匯出器配置。
- 收集器IP地址
- 源介面
- UDP埠
- 匯出協定(NetFlow v9/IPFIX)
WAN_Router#show running-config | section flow exporter
flow exporter Netflow_Exporter
destination 203.0.113.10
source Loopback0
transport udp 9996
template data timeout 60
步驟2.驗證介面狀態。
確認GigabitEthernet2可操作:
- Interface is up/up
- 已配置正確的IP地址
- 沒有過多的錯誤或丟棄
WAN_Router#show interface gigabitEthernet 2 | include up|error|drop
GigabitEthernet2 is up, line protocol is up
Full Duplex, 1000Mbps, link type is auto, media type is Virtual
output flow-control is unsupported, input flow-control is unsupported
Input queue: 0/375/0/0 (size/max/drops/flushes); Total output drops: 0
0 input errors, 0 CRC, 0 frame, 0 overrun, 0 ignored
0 output errors, 0 collisions, 0 interface resets
0 unknown protocol drops
步驟3.驗證與收集器的連通性。
從源介面測試連線:
WAN_Router#ping 203.0.113.10 source Loopback 0
Type escape sequence to abort.
Sending 5, 100-byte ICMP Echos to 203.0.113.10, timeout is 2 seconds:
Packet sent with a source address of 198.51.100.10
!!!!!
Success rate is 100 percent (5/5), round-trip min/avg/max = 1/2/5 ms
WAN_Router#

WAN_Router#traceroute 203.0.113.10 source Loopback 0 numeric
Type escape sequence to abort.
Tracing the route to 203.0.113.10
VRF info: (vrf in name/id, vrf out name/id)
1 X.X.X.X 2 msec 1 msec 1 msec
2 Y.Y.Y.Y 2 msec 2 msec 1 msec
3 Z.Z.Z.Z 2 msec * 2 msec
WAN_Router#
步驟4.驗證匯出器統計資訊。
驗證路由器是否正在生成NetFlow匯出資料包,並將其傳送到已配置的收集器地址。
驗證:
- 已成功傳送資料包
- 已成功傳送模板
- 無傳輸故障
- 無套接字錯誤
WAN_Router#show flow exporter statistics
Flow Exporter Netflow_Exporter:
Packet send statistics:
Successfully sent: 41 (3780 bytes)

Client send statistics:
Client: Flow Monitor MONITOR_INGRESS
Records added: 35
- sent: 35
Bytes added: 1750
- sent: 1750

Client: Flow Monitor MONITOR_EGRESS
Records added: 35
- sent: 35
Bytes added: 1750
- sent: 1750
步驟5.驗證流量建立。
驗證流條目是否在流監控器快取中填充和維護。
驗證:
- 活動流存在於流監控器快取中。
- 快取條目正在遞增,這表示正在記錄流量。
- 流條目將在預期的超時間隔內過期(過期)。

附註:如果快取中未觀察到流,請調查流監控器和記錄配置,因為問題可能與匯出功能無關。
WAN_Router#show flow monitor MONITOR_EGRESS cache
Cache type: Normal (Platform cache)
Cache size: 200000
Current entries: 14
High Watermark: 27

Flows added: 3032
Flows aged: 3018
- Active timeout ( 60 secs) 200
- Inactive timeout ( 30 secs) 2818

IPV4 SOURCE ADDRESS: 198.51.100.200
IPV4 DESTINATION ADDRESS: 192.0.2.11
TRNS SOURCE PORT: 57188
TRNS DESTINATION PORT: 1967
INTERFACE OUTPUT: Gi2
IP TOS: 0x00
IP PROTOCOL: 17
counter bytes long: 80
counter packets long: 1
timestamp abs first: 22:09:34.067
timestamp abs last: 22:09:34.067
根據輸出可確定:
- 流監控器MONITOR_EGRESS運行正常且正在用流條目填充快取。
- 快取運行狀況已確認 — 正在按預期速率新增和刪除(過期)條目。
- 相當一部分流(3018中的2818)將因非活動超時而過期,這是短持續時間或低頻率流量的預期行為。
- 顯示的快取條目表示從源198.51.100.200(埠57188)到目標192.0.2.11(埠1967)(通過介面GigabitEthernet2退出)的單資料包UDP流(協定17)。
步驟6.驗證監控器附件。
確認已將流量監控器應用於正確的介面。
WAN_Router#show running-config interface gigabitEthernet 2
Building configuration...

Current configuration : 217 bytes
!
interface GigabitEthernet2
ip flow monitor MONITOR_EGRESS output
ip address x.x.x.x 255.255.255.252
ip ospf network point-to-point
ip ospf 1 area 0
negotiation auto
end
步驟7.檢驗ACL或安全策略。
驗證沒有已配置的ACL或安全策略正在過濾或丟棄目的地為收集器的NetFlow匯出資料包:
WAN_Router#show running-config | include access-group
WAN_Router#
步驟8.捕獲路由器上的流量。
- 發出show ip route <collector_IP>命令以驗證到達收集器的路由路徑。確定路由器用來轉發NetFlow匯出流量的輸出介面。
- 建立一個ACL,允許源IP地址與配置的NetFlow匯出器源介面匹配、目標IP地址與收集器匹配的UDP資料包。將此ACL套用到封包擷取,以過濾相關流量。
WAN_Router#show running-config | sec flow exporter
flow exporter Netflow_Exporter
destination 203.0.113.10
source Loopback0
transport udp 9996
template data timeout 60
WAN_Router#show ip route 203.0.113.10
Routing entry for 203.0.113.10/32
Known via "ospf 1", distance 110, metric 22, type intra area
Last update from x.x.x.x on GigabitEthernet2, 02:12:27 ago
Routing Descriptor Blocks:
* x.x.x.x, from 203.0.113.10, 02:12:27 ago, via GigabitEthernet2
Route metric is 22, traffic share count is 1

WAN_Router#show running-config interface Loopback0
Building configuration...

Current configuration : 87 bytes
!
interface Loopback0
ip address 198.51.100.10 255.255.255.255
ip ospf 1 area 0
end

WAN_Router(config)#ip access-list extended netflow
WAN_Router(config-ext-nacl)#permit udp host 198.51.100.10 host 203.0.113.10
WAN_Router(config-ext-nacl)#end
!
WAN_Router#monitor capture netflow interface gigabitEthernet 2 out access-list netflow buffer size 10
WAN_Router#monitor capture netflow start
Started capture point : netflow

WAN_Router#show monitor capture netflow buffer brief
-------------------------------------------------------------------------------------
#    size     timestamp      source                destination     dscp   protocol
-------------------------------------------------------------------------------------
0    166      0.000000      198.51.100.10      -> 203.0.113.10      0 BE   UDP
1    166      0.055997      198.51.100.10      -> 203.0.113.10      0 BE   UDP
2    166      7.562019      198.51.100.10      -> 203.0.113.10      0 BE   UDP
3    166      7.617024      198.51.100.10      -> 203.0.113.10      0 BE   UDP
4    166      9.719009      198.51.100.10      -> 203.0.113.10      0 BE   UDP
5    166      9.776013      198.51.100.10      -> 203.0.113.10      0 BE   UDP
附註:捕獲的資料可以作為.pcap檔案儲存在bootflash中,也可以作為十六進位制轉儲提取到文本檔案中,然後可以匯入到資料包分析工具(如Wireshark)中進行詳細檢查。
設定及擷取軟體的內嵌封包
WAN_Router#show monitor capture netflow buffer dump
0
0000: AABBCC00 18005254 00B62209 08004500 ......RT.."...E.
0010: 009863EA 0000FF11 F121C633 640ACB00 ..c......!.3d...
0020: 710AC027 270C0084 F2E70009 0002086E q..''..........n
0030: 9B7A6A2F 2ED40000 07CE0000 01000102 .zj/............
0040: 0068C000 020BC633 64C80011 07AFDCA1 .h.....3d.......
0050: 00000002 00000000 00000034 00000000 ...........4....
0060: 00000001 0000019E C84E6CDC 0000019E .........Nl.....
0070: C84E6CDC C000020B C63364C8 0011007B .Nl......3d....{
0080: DCA10000 00020000 00000000 002C0000 .............,..
0090: 00000000 00010000 019EC84E 6CF00000 ...........Nl...
00A0: 019EC84E 6CF0 ...Nl.
根據封包擷取分析,NetFlow輸出封包(資料流)會從路由器傳輸到已設定的收集器。 封包擷取Netflow
如果匯出器統計資訊指示成功的傳輸,但收集器沒有收到任何資料包,則問題可能位於路由器和收集器之間的網路路徑中,而不是NetFlow匯出器配置本身。
要隔離問題,請執行以下驗證:
- 驗證網路路徑 — 檢查沿途應用的所有ACL,確保配置的NetFlow UDP埠未被拒絕或過濾。
- 驗證防火牆策略 — 如果匯出器和收集器之間的路徑中存在防火牆,請確認適用的安全策略允許指定埠上的NetFlow匯出UDP流量。
- 確認收集器應用程式狀態 — 驗證收集器服務或進程是否正在運行並在預期的UDP埠上主動偵聽。
NetFlow匯出器無法向VRF感知拓撲中的收集器傳輸流資料
收集器未從介面GigabitEthernet2接收流匯出資料。雖然已驗證到收集器的可訪問性,但流記錄未成功傳送。
步驟 1. 驗證是否正在獲知流量。
驗證監控器是否正在接收流量並建立流量條目。
WAN_Router#show flow monitor MONITOR_INGRESS cache
Cache type: Normal (Platform cache)
Cache size: 200000
Current entries: 7
High Watermark: 9

Flows added: 65
Flows aged: 58
- Active timeout ( 60 secs) 4
- Inactive timeout ( 30 secs) 54

IPV4 SOURCE ADDRESS: x.x.x.x
IPV4 DESTINATION ADDRESS: 224.0.0.5
TRNS SOURCE PORT: 0
TRNS DESTINATION PORT: 0
INTERFACE INPUT: Gi2
IP TOS: 0xC0
IP PROTOCOL: 89
counter bytes long: 100
counter packets long: 1
timestamp abs first: 01:54:53.144
timestamp abs last: 01:54:53.144
步驟2.檢驗匯出統計資訊。
檢查匯出器操作。
WAN_Router#show flow exporter statistics
Flow Exporter Netflow_Exporter:
Packet send statistics :
Successfully sent: 0 (0 bytes)

Client send statistics:
Client: Flow Monitor MONITOR_INGRESS
Records added: 0
Bytes added: 0
輸出表明流監控器MONITOR_INGRESS成功收集和快取流資料;但是,流匯出器Netflow_Exporter不會向收集器傳輸任何記錄。
步驟3.在路由表中驗證收集器可達性。
驗證到收集器IP地址的路由是否存在於相應的路由表中。這可能是全域性路由表,也可以是VRF特定的路由表,具體取決於網路拓撲。
WAN_Router#show ip route 203.0.113.10
% Network not in table

WAN_Router#show ip cef 203.0.113.10
0.0.0.0/0
no route
WAN_Router#show ip vrf
Name           Default RD         Interfaces
A             <not set>           Lo0
                                  Gi1
                                  Gi2

WAN_Router#show ip route vrf A 203.0.113.10

Routing Table: A
Routing entry for 203.0.113.10/32
Known via "ospf 1", distance 110, metric 22, type intra area
Last update from x.x.x.x on GigabitEthernet2, 00:37:34 ago
Routing Descriptor Blocks:
* x.x.x.x, from 203.0.113.10, 00:37:34 ago, via GigabitEthernet2
Route metric is 22, traffic share count is 1

WAN_Router#ping vrf A 203.0.113.10 source loopback0
Type escape sequence to abort.
Sending 5, 100-byte ICMP Echos to 203.0.113.10, timeout is 2 seconds:
Packet sent with a source address of 198.51.100.10
!!!!!
Success rate is 100 percent (5/5), round-trip min/avg/max = 1/1/3 ms
WAN_Router
步驟4.驗證流匯出器配置。
檢查匯出器配置以確認指定了適當的VRF,確保匯出器可感知VRF。
WAN_Router#show running-config | sec flow exporter
flow exporter Netflow_Exporter
destination 203.0.113.10
source Loopback0
transport udp 9996
template data timeout 60
WAN_Router#
匯出失敗的根本原因是流匯出器配置中沒有VRF定義。在感知VRF的網路中,必須使用適當的VRF顯式配置流匯出器,以確保通過正確的路由表將匯出資料包轉發到收集器。
此處顯示了用於確認匯出器是否按預期運行的更正配置和驗證步驟。
WAN_Router#show running-config | section flow exporter
flow exporter Netflow_Exporter
destination 203.0.113.10 vrf A
source Loopback0
transport udp 9996
template data timeout 60
步驟5.檢驗匯出資料包是否從路由器發出。
在出口介面上啟用資料包捕獲,並使用相關的show命令確認NetFlow匯出資料包是否正在傳送到收集器。
WAN_Router#show monitor capture netflow parameter
monitor capture netflow interface GigabitEthernet2 OUT
monitor capture netflow access-list netflow
monitor capture netflow buffer size 10
monitor capture netflow limit pps 1000
WAN_Router#show flow exporter statistics
Flow Exporter Netflow_Exporter:
Packet send statistics :
Successfully sent: 7 (576 bytes)

Client send statistics:
Client: Flow Monitor MONITOR_INGRESS
Records added: 9
- sent: 9
Bytes added: 450
- sent: 450

WAN_Router#show monitor capture netflow buffer brief
--------------------------------------------------------------------------------
#   size   timestamp      source               destination      dscp    protocol
--------------------------------------------------------------------------------
0    114    0.000000     198.51.100.10     -> 203.0.113.10         0 BE UDP
1    118    31.873947    198.51.100.10     -> 203.0.113.10         0 BE UDP
2    166    32.955004    198.51.100.10     -> 203.0.113.10         0 BE UDP
3    166    43.580963    198.51.100.10     -> 203.0.113.10         0 BE UDP
4    166    53.061993    198.51.100.10     -> 203.0.113.10         0 BE UDP
5    114    62.480978    198.51.100.10     -> 203.0.113.10         0 BE UDP
對思科交換機上的NetFlow進行故障排除
網路圖表
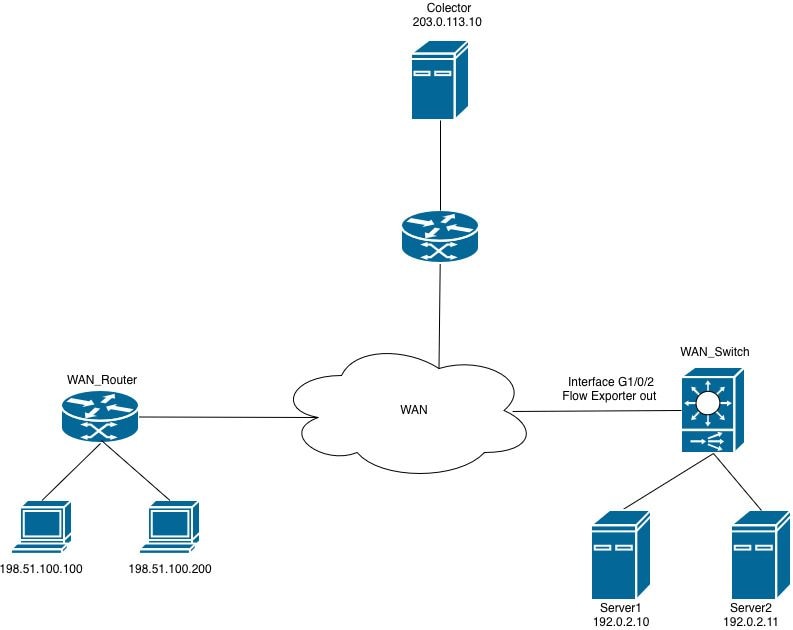 交換器上的Netflow
無法向介面應用流量監視器
嘗試將Flexible NetFlow(FNF)流監控器連線到輸出方向的介面時,路由器會拒絕設定並產生錯誤訊息。
WAN_Switch(config-if)#interface TwentyFiveGigE1/0/1
WAN_Switch(config-if)#ip flow monitor MONITOR_INGRESS input
% Flow Monitor: Failed to add monitor to interface: Invalid set of fields in monitor record for wired interface
步驟1.檢驗監控器配置。
WAN_Switch#show running-config | section flow monitor
flow monitor MONITOR_INGRESS
exporter Netflow_Exporter
cache timeout inactive 30
cache timeout active 60
record INGRESS
步驟2.檢視特定於方向的欄位的流記錄配置。導致此問題的最常見欄位為:匹配應用程式名稱。
WAN_Switch#show running-config | section flow record
flow record INGRESS
match ipv4 version
match ipv4 protocol
match application name
match ipv4 destination address
match ipv4 source address
match transport destination-port
match transport source-port
match interface input
match flow direction
collect timestamp absolute first
collect timestamp absolute last
collect counter bytes long
collect counter packets long
Flexible NetFlow(FNF)流記錄中的match application name欄位用於應用可視性與可控性(AVC)部署中,以根據生成流的應用來識別和分類流量。
此欄位利用基於網路的應用識別(NBAR)引擎執行深度資料包檢測(DPI)並識別與每個流關聯的應用。該欄位使路由器能夠在應用層(第7層)對流量進行分類,而不是僅僅依賴埠號或IP地址。
在僅使用Flexible NetFlow(FNF)且未啟用AVC功能的部署中,此欄位與介面配置不相容,並且阻止將流監控器連線到受監控的介面。
附註:在Catalyst 9500H和Catalyst 9600平台上,AVC功能不可用。對於基於AVC的流量監控,Catalyst 9300系列是支援的平台。
3.從流記錄配置中刪除不受支援的欄位,然後將流監視器重新應用到介面。
WAN_Switch(config)#interface twentyFiveGigE 1/0/1
WAN_Switch(config-if)#no ip flow monitor MONITOR_INGRESS in
WAN_Switch(config)#no flow monitor MONITOR_INGRESS
WAN_Switch(config)#flow record INGRESS
WAN_Switch(config-flow-record)#no match flow direction
<snip>
附註:修改流記錄後,重新應用流監控器配置,並將流監控器連線到介面以完成配置更改。
步驟4.確認應用配置更改後流量監控器正常運行。
WAN_Switch#show flow monitor MONITOR_INGRESS statistics
Cache type: Normal (Platform cache)
Cache size: 10000
Current entries: 1

Flows added: 1
Flows aged: 0

WAN_Switch#show flow monitor MONITOR_INGRESS cache
Cache type: Normal (Platform cache)
Cache size: 10000
Current entries: 1

Flows added: 1
Flows aged: 0

IPV4 SOURCE ADDRESS: x.x.x.x
IPV4 DESTINATION ADDRESS: y.y.y.y
TRNS SOURCE PORT: 0
TRNS DESTINATION PORT: 0
INTERFACE INPUT: Twe1/0/1
FLOW DIRECTION: Input
IP VERSION: 4
IP PROTOCOL: 89
counter bytes long: 708
counter packets long: 7
timestamp abs first: 20:38:23.408
timestamp abs last: 20:39:12.408
修訂記錄
| 修訂 | 發佈日期 | 意見 |
|---|---|---|
1.0 |
18-Jun-2026
|
初始版本 |
 意見
意見