简介
本文档介绍4G网络上的用户数据浏览问题。
先决条件
Cisco建议您了解这些节点的功能
1. 服务分组数据网关(SPGW)
2. 控制和用户平面分离(CUPS)
症状
在开始测试和日志收集之前,您需要检查下述详细信息:
1. 检查问题是数据包数据网络(PDN)的数据类型:IPv4/IPv6/IPv4v6
2. 检查任何特定接入点名称(APN)或所有APN的问题,因为此问题也可能与特定APN相关。
3. 检查URL是企业URL/客户应用URL还是某个常规服务URL,并相应地检查特定VPN是否存在问题。
4. 检查直接从浏览器访问URL时或访问Web应用时是否出现问题。
5. 问题是否在本质上是间歇性的(例如手机重启后/刷新Web URL开始工作)?或者问题是否一致,甚至在手机重启后也不起作用?
6. 检查观察到的拒绝原因以及哪个评级组。
日志收集/测试

注意:对于此类问题,您需要对有问题的用户IMSI执行实时在线故障排除,并相应地收集日志/跟踪。
在继续测试和日志收集之前。
Flush the subscriber from the node and also clear browsing history/database from testing user handset so that it can freshly attach

clear subscriber imsi <IMSI number>  ------------------ to be executed in the node to clear the subscriber
1. 首先测试任何PDN类型的用户。
2. 记录putty会话并使用详细程度5启动监控用户并启用此选项。
SPGW:
Press + for times then it collects the logs verbosity 5 logs then select next options
+++++
S,X,A,Y,56,26,33,34,19,37,35,88,89
Once option 75 is pressed then select 3,4,8 then press esc

CUPS::
on CP:
monitor subscriber imsi <IMSI> +++++        S, X,A,Y,56,26,33,34,19,37,35,88,89
on UP:
monitor subscriber imsi <IMSI> +++++        S,X,A,Y,56,26,33,34,19,37,35,88,89
3. 请启用这些调试日志并记录putty会话,并确保会话不能终止(按tab/每隔几分钟输入一次,以便会话不会终止)。
On SPGW:
logging filter active facility sessmgr level debug
logging filter active facility acsmgr level debug
logging filter active facility npumgr-acl level debug
logging filter active facility firewall level debug
logging filter active facility vpn level debug
logging filter active facility vpnmgr level debug
logging active   ---------------- to enable the logging
no logging active ---------------- to disable the logging

On CP:
logging filter active facility sessmgr level debug
logging filter active facility sxdemux level debug
logging filter active facility firewall level debug
logging filter active facility vpn level debug
logging filter active facility vpnmgr level debug
logging active ---------------- to enable the logging
no logging active ---------------- to disable the logging

On UP:
logging filter active facility sessmgr level debug
logging filter active facility sxdemux level debug
logging filter active facility npumgr-acl level debug
logging filter active facility firewall level debug
logging filter active facility vpn level debug
logging filter active facility vpnmgr level debug
logging active ---------------- to enable the logging
no logging active ---------------- to disable the logging

Note :: These logging has to be enabled for short time depending on the CPU utilization because it
increase the utilization so while enabling logging need to keep a watch on CPU
4. 配置模式,请为用户启用日志记录监视器
config
logging monitor msid <imsi>
end
5. 附加订用服务器并连续浏览URL 3到5分钟,浏览时多次执行此命令并记录同一用户的putty会话。
ON SPGW/SAEGW:
show subscriber full imsi <>
show active-charging session full imsi <>
show subscriber pgw-only full imsi <>
show subscriber sgw-only full imsi <>
show subscribers data-rate summary imsi <>
show ims-authorization sessions full imsi <>
show subscribers debug-info msid <>

On CP node:

 Show subscriber full imsi <imsi>
Show active-charging session full imsi <imsi>
show subscribers pgw-only full imsi <>
show subscribers sgw-only full imsi <>
show session subsystem facility sessmgr instance <> verbose
show logs

On UP node:
show sub user-plane-only full callid  <>
show sub user-plane-only callid <> urr full all
show sub user-plane-only callid <> far full all
show sub user-plane-only callid <> pdr full all
show subscribers user-plane-only callid <> far all
show subscribers user-plane-only callid <> far
show subs data-rate call <callid>
show subscribers user-plane-only flows
show user-plane-service statistics all
show user-plane-service statistic rulebase name <rulebase_name>
6. 浏览5分钟后,在步骤4打开的终端中执行no logging active
7. 禁用用户的日志记录监视器。
Config
no logging monitor msid <imsi>
8. 执行此命令以获取用户的呼叫ID并记录此呼叫的putty会话。
Show subscriber full imsi <imsi>.  --> to get the call id
show logs callid <call_id>
show logs
9. 如果存在呼叫ID,则用户会话日志显然已收集(如果没有),需要再次运行。
分析
1. 检查DNS解析是否成功。如果成功,则DNS没有问题。
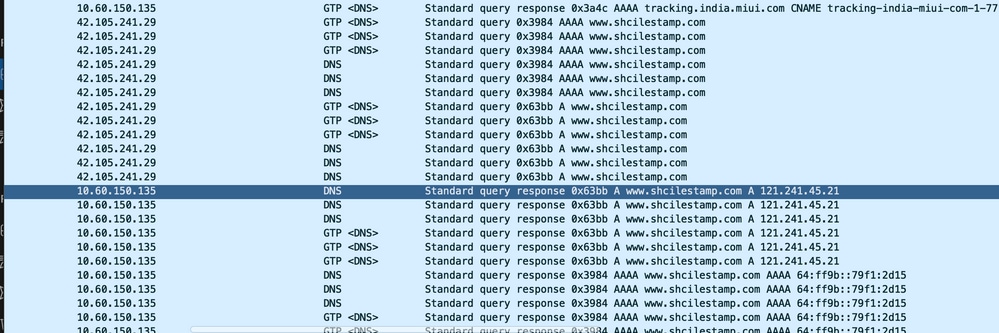 DNS解析跟踪
2.检查用户级别统计信息,查看数据包丢弃。
SPGW/CP:
Show subscriber full imsi <imsi number>

CUPS UP:
show user-plane-only full imsi <>

input pkts: 455 output pkts: 474
input bytes: 75227 output bytes: 103267
input bytes dropped: 0 output bytes dropped: 0
input pkts dropped: 0 output pkts dropped: 0
input pkts dropped due to lorc : 0 output pkts dropped due to lorc : 0
input bytes dropped due to lorc : 0
in packet dropped suspended state: 0 out packet dropped suspended state: 0
in bytes dropped suspended state: 0 out bytes dropped suspended state: 0
in packet dropped sgw restoration state: 0 out packet dropped sgw restoration state: 0
in bytes dropped sgw restoration state: 0 out bytes dropped sgw restoration state: 0
pk rate from user(bps): 18547 pk rate to user(bps): 25330
ave rate from user(bps): 6182 ave rate to user(bps): 8443
sust rate from user(bps): 5687 sust rate to user(bps): 7768
pk rate from user(pps): 13 pk rate to user(pps): 14
ave rate from user(pps): 4 ave rate to user(pps): 4
sust rate from user(pps): 4 sust rate to user(pps): 4
link online/active percent: 92
ipv4 bad hdr: 0 ipv4 ttl exceeded: 0
ipv4 fragments sent: 0 ipv4 could not fragment: 0
ipv4 input acl drop: 0 ipv4 output acl drop: 0
ipv4 bad length trim: 0
ipv6 input acl drop: 0 ipv6 output acl drop: 0
ipv4 input css down drop: 0 ipv4 output css down drop: 0
ipv4 input css down drop: 0 ipv4 output css down drop: 0
ipv4 output xoff pkts drop: 0 ipv4 output xoff bytes drop: 0
ipv6 output xoff pkts drop: 0 ipv6 output xoff bytes drop: 0
ipv6 input ehrpd-access drop: 0 ipv6 output ehrpd-access drop: 0
input pkts dropped (0 mbr): 0 output pkts dropped (0 mbr): 0
ip source violations: 0 ipv4 output no-flow drop: 0
ipv6 egress filtered: 0
ipv4 proxy-dns redirect: 0 ipv4 proxy-dns pass-thru: 0
ipv4 proxy-dns drop: 0
ipv4 proxy-dns redirect tcp connection: 0
ipv6 bad hdr: 0 ipv6 bad length trim: 0
ip source violations no acct: 0
ip source violations ignored: 0
dormancy total: 0 handoff total: 0
ipv4 icmp packets dropped: 0
APN AMBR Input Pkts Drop: 0 APN AMBR Output Pkts Drop: 0
APN AMBR Input Bytes Drop: 0 APN AMBR Output Bytes Drop: 0
APN AMBR UE Overload Input Pkts Drop: 0 APN AMBR UE Overload Output Pkts Drop: 0
APN AMBR UE Overload Input Bytes Drop: 0 APN AMBR UE Overload Output Bytes Drop: 0
Access-flows:0
Num Auxiliary A10s:0
3.检查ECS/ACS级别数据包丢弃的show active charging命令输出,并检查是否存在任何数据包丢弃,然后检查配置中的操作是什么。
Show active-charging session full imsi <imsi num> or show sub user-plane-only full callid  <>
 Ruledef Name Pkts-Down Bytes-Down Pkts-Up Bytes-Up Hits Match-Bypassed
-------------------- ---------- ---------- ---------- ---------- ---------- --------------
dns_free_covid 4 428 4 340 8 0
icmpv6 0 0 5 1423 5 0
ip-pkts 479 103670 432 74488 764 429
4. 检查UE与服务器之间的TCP连接是否成功建立。
5. 如果在上述任何步骤中未观察到丢包,则节点中不存在问题。
丢包
- 检查用户版本统计信息,以确定是否遇到了与此处所示类似的数据包丢弃。
 Total Dropped Packets : 132329995
Total Dropped Packet Bytes: 14250717212

Total PP Dropped Packets : 0
Total PP Dropped Packet Bytes: 0

R7Gx Rule-Matching Failure Stats:
Total Dropped Packets : 871921
Total Dropped Packet Bytes : 86859232

P2P random drop stats:
Total Dropped Packets : 0
Total Dropped Packet Bytes : 0
2. 检查show subscriber输出中观察到的故障百分比。如果数据包丢弃小于1%,则很可能只是侥幸,不会产生任何影响。
input pkts: 455 output pkts: 474
input bytes: 75227 output bytes: 103267
input bytes dropped: 0 output bytes dropped: 0
input pkts dropped: 0 output pkts dropped: 0
3. 如果您注意到RX评级组中的数据包丢弃和ITC数据包丢弃,这很可能是因为带宽问题和用户包过期。
ITC Packets Drop: 47235019
4. 在ECS级别,必须验证DPI配置(包括规则定义、计费操作和规则库),以确定是否存在任何阻止因素。在ECS级别有各种类型的丢弃,下一步操作取决于遇到的特定类型的丢弃。
5. 正在传递但未处理的数据包大小的MTU大小。
6. 通过TCP转储/用户级跟踪可以确定数据包被丢弃的中间路径问题。
针对此类问题的恢复行动计划并不相同,因为它会根据问题的模式而有所不同。
 反馈
反馈