了解Nexus 9000 TAHUSD缓冲区系统日志和拥塞

简介
本文档介绍配备运行 NX-OS 软件的 Cisco Scale ASIC 的 Cisco Nexus 9000 系列交换机上的排队和缓冲。
先决条件
要求
思科建议您了解共享介质网络中的以太网交换基础知识,以及在这些网络中使用队列/缓冲的必要性。思科还建议您了解 Cisco Nexus 交换机上服务质量 (QoS) 和缓冲的基础知识。有关其他详细信息,请参阅文档:
- Cisco Nexus 9000 系列 NX-OS 服务质量配置指南版本 10.1(x)
- Cisco Nexus 9000 系列 NX-OS 服务质量配置指南版本 9.3(x)
- Cisco Nexus 9000 系列 NX-OS 服务质量配置指南版本 9.2(x)
- Cisco Nexus 9000 系列 NX-OS 服务质量配置指南版本 7.x
使用的组件
本文档中的信息基于配备运行 NX-OS 软件版本 9.3(8) 的 Cloud Scale ASIC 的 Cisco Nexus 9000 系列交换机。
本文档中介绍的过程仅适用于以下Nexus 9200/9300硬件:
- Nexus 9200/9300 系列非模块化交换机
- N9K-C92160YC-X
- N9K-C92300YC
- N9K-C92304QC
- N9K-C92348GC-X
- N9K-C9236C
- N9K-C9272Q
- N9K-C9332C
- N9K-C9364C
- N9K-C93108TC-EX
- N9K-C93108TC-EX-24
- N9K-C93180LC-EX
- N9K-C93180YC-EX
- N9K-C93180YC-EX-24
- N9K-C93108TC-FX
- N9K-C93108TC-FX-24
- N9K-C93180YC-FX
- N9K-C93180YC-FX-24
- N9K-C9348GC-FXP
- N9K-C93240YC-FX2
- N9K-C93216TC-FX2
- N9K-C9336C-FX2
- N9K-C9336C-FX2-E
- N9K-C93360YC-FX2
- N9K-C93180YC-FX3
- N9K-C93108TC-FX3P
- N9K-C93180YC-FX3S
- N9K-C9316D-GX
- N9K-C93600CD-GX
- N9K-C9364C-GX
- N9K-C9364D-GX2A
- N9K-C9332D-GX2B
- Cisco Nexus 9500 模块化交换机线卡
- N9K-X97160YC-EX
- N9K-X9732C-EX
- N9K-X9736C-EX
- N9K-X97284YC-FX
- N9K-X9732C-FX
- N9K-X9788TC-FX
- N9K-X9716D-GX
本文档中的信息都是基于特定实验室环境中的设备编写的。本文档中使用的所有设备最初均采用原始(默认)配置。如果您的网络处于活动状态,请确保您了解所有命令的潜在影响。
背景信息
本文档介绍在配备运行NX-OS软件的Cisco Cloud Scale ASIC的Cisco Nexus 9000系列交换机上的排队和缓冲。
了解 Cisco Nexus 9000 Cloud Scale ASIC 缓冲架构
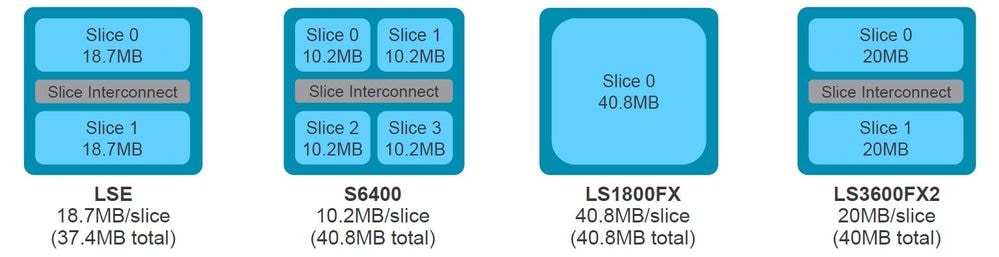
采用Cisco Cloud Scale ASIC(特定应用集成电路)的Cisco Nexus 9000系列交换机实施“共享内存”出口缓冲区架构。ASIC 被分为一个或多个“切片”。 每个切片都有自身的缓冲区,并且仅该切片内的端口才能使用该缓冲区。实际上,每个切片又被分为多个“信元”,这些信元表示缓冲区的各个部分。切片被划分为“池组”。每个池组分配有一定数量的信元,并且这些信元不会在单独的池组之间共享。每个池组都有一个或多个“池”,这些“池”代表单播或组播流量的服务类别 (CoS)。这有助于每个池组为其服务的流量类型保证缓冲区资源。
该图展示了各种型号的思科云扩展ASIC如何划分为多个切片。该图像还演示了每个片如何通过单元分配一定量的缓冲区。
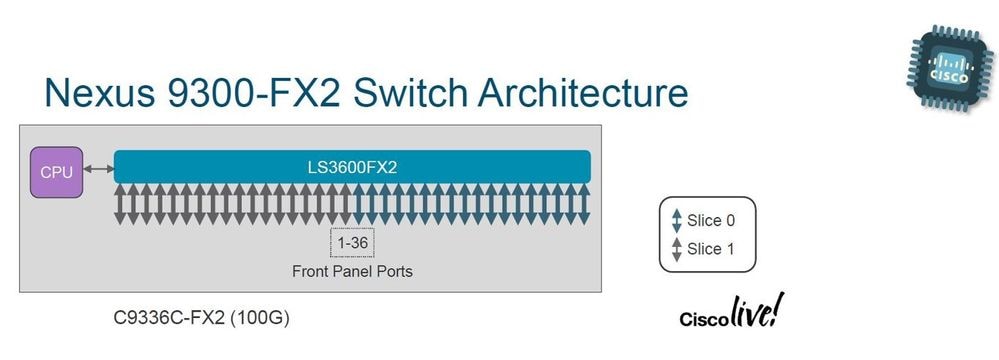
每个Nexus 9000系列交换机和Nexus 9500线卡型号都具有唯一的Cisco Cloud Scale ASIC数量和布局,这些数量和布局决定了前面板端口到ASIC的连接。图中显示了使用N9K-X9736C-FX线卡和N9K-C9336C-FX2交换机的两个示例。
N9K-C9736C-FX 线卡配备 4 个 Cisco Cloud Scale LS1800FX ASIC,其中每个 ASIC 一个切片。在内部,每个 ASIC 称为一个“信元”。 每个切片称为一个“实例”,并分配有一个从零开始的整数,以唯一地标识机箱内的该切片。这会导致以下置换:
- 信元 0 切片 0 称为实例 0
- 信元 1 切片 0 称为实例 1
- 信元 2 切片 0 称为实例 2
- 信元 3 切片 0 称为实例 3

N9K-C9336C-FX2 交换机配备一个 Cisco Cloud Scale LS3600FX2 ASIC,其中每个 ASIC 两个切片。在内部,每个 ASIC 称为一个“信元”。 每个切片称为一个“实例”,并分配有一个从零开始的整数,以唯一地标识机箱内的该切片。这会导致如下所示的排列:
- 信元 0 切片 0 称为实例 0
- 信元 0 切片 1 称为实例 1
每个线卡和交换机都具有不同的布局,会产生不同的实例编号。要围绕带宽密集型流量设计网络,您需要了解要使用的交换机或线卡布局。show interface hardware-mappings 命令可用于将每个前面板端口关联到信元 (ASIC) 和切片编号。在本示例中,带有N9K-X9736C-FX线卡的Nexus 9504交换机的接口Ethernet2/16插入机箱的插槽2中,并映射到单元1,片0。
switch# show interface hardware-mappings
Legends:
       SMod  - Source Mod. 0 is N/A
       Unit  - Unit on which port resides. N/A for port channels
       HPort - Hardware Port Number or Hardware Trunk Id:
       HName - Hardware port name. None means N/A
       FPort - Fabric facing port number. 255 means N/A
       NPort - Front panel port number
       VPort - Virtual Port Number. -1 means N/A
       Slice - Slice Number. N/A for BCM systems
       SPort - Port Number wrt Slice. N/A for BCM systems
       SrcId - Source Id Number. N/A for BCM systems
       MacIdx - Mac index. N/A for BCM systems
       MacSubPort - Mac sub port. N/A for BCM systems

-------------------------------------------------------------------------------------------------------
Name       Ifindex  Smod Unit HPort FPort NPort VPort Slice SPort SrcId MacId MacSP VIF  Block BlkSrcID
-------------------------------------------------------------------------------------------------------
Eth2/1     1a080000 5    0    16    255   0     -1    0     16    32    4     0     145  0     32
Eth2/2     1a080200 5    0    12    255   4     -1    0     12    24    3     0     149  0     24
Eth2/3     1a080400 5    0    8     255   8     -1    0     8     16    2     0     153  0     16
Eth2/4     1a080600 5    0    4     255   12    -1    0     4     8     1     0     157  0     8
Eth2/5     1a080800 5    0    0     255   16    -1    0     0     0     0     0     161  0     0
Eth2/6     1a080a00 5    0    56    255   20    -1    0     56    112   14    0     165  1     40
Eth2/7     1a080c00 5    0    52    255   24    -1    0     52    104   13    0     169  1     32
Eth2/8     1a080e00 6    1    16    255   28    -1    0     16    32    4     0     173  0     32
Eth2/9     1a081000 6    1    12    255   32    -1    0     12    24    3     0     177  0     24
Eth2/10    1a081200 6    1    8     255   36    -1    0     8     16    2     0     181  0     16
Eth2/11    1a081400 6    1    4     255   40    -1    0     4     8     1     0     185  0     8
Eth2/12    1a081600 6    1    0     255   44    -1    0     0     0     0     0     189  0     0
Eth2/13    1a081800 6    1    56    255   48    -1    0     56    112   14    0     193  1     40
Eth2/14    1a081a00 6    1    52    255   52    -1    0     52    104   13    0     197  1     32
Eth2/15    1a081c00 7    2    16    255   56    -1    0     16    32    4     0     201  0     32
Eth2/16    1a081e00 7    2    12    255   60    -1    0     12    24    3     0     205  0     24
Eth2/17    1a082000 7    2    8     255   64    -1    0     8     16    2     0     209  0     16
Eth2/18    1a082200 7    2    4     255   68    -1    0     4     8     1     0     213  0     8
Eth2/19    1a082400 7    2    0     255   72    -1    0     0     0     0     0     217  0     0
Eth2/20    1a082600 7    2    56    255   76    -1    0     56    112   14    0     221  1     40
Eth2/21    1a082800 7    2    52    255   80    -1    0     52    104   13    0     225  1     32
Eth2/22    1a082a00 8    3    16    255   84    -1    0     16    32    4     0     229  0     32
Eth2/23    1a082c00 8    3    12    255   88    -1    0     12    24    3     0     233  0     24
Eth2/24    1a082e00 8    3    8     255   92    -1    0     8     16    2     0     237  0     16
Eth2/25    1a083000 8    3    4     255   96    -1    0     4     8     1     0     241  0     8
Eth2/26    1a083200 8    3    0     255   100   -1    0     0     0     0     0     245  0     0
Eth2/27    1a083400 8    3    56    255   104   -1    0     56    112   14    0     249  1     40
Eth2/28    1a083600 8    3    52    255   108   -1    0     52    104   13    0     253  1     32
Eth2/29    1a083800 5    0    48    255   112   -1    0     48    96    12    0     257  1     24
Eth2/30    1a083a00 5    0    44    255   116   -1    0     44    88    11    0     261  1     16
Eth2/31    1a083c00 6    1    48    255   120   -1    0     48    96    12    0     265  1     24
Eth2/32    1a083e00 6    1    44    255   124   -1    0     44    88    11    0     269  1     16
Eth2/33    1a084000 7    2    48    255   128   -1    0     48    96    12    0     273  1     24
Eth2/34    1a084200 7    2    44    255   132   -1    0     44    88    11    0     277  1     16
Eth2/35    1a084400 8    3    48    255   136   -1    0     48    96    12    0     281  1     24
Eth2/36    1a084600 8    3    44    255   140   -1    0     44    88    11    0     285  1     16
计算多个 ASIC 和切片的实例 ID
在解读系统日志时,根据连续的信元和切片组合顺序计算实例 ID。 例如,如果Nexus 9500模块或Nexus 9300 TOR(架顶式)有两个单元(ASIC)和每个单元两个扇区,则实例ID为:
- 信元 0 切片 0 称为实例 0
- 信元 0 切片 1 称为实例 1
- 信元 1 切片 0 称为实例 2
- 信元 1 切片 1 称为实例 3
如果模块具有一个单元及四个扇区,则实例ID为:
- 信元 0 切片 0 称为实例 0
- 信元 0 切片 1 称为实例 1
- 信元 0 切片 2 称为实例 2
- 信元 0 切片 3 称为实例 3
了解超订用和输出丢弃数
连接到以太网络的接口一次只能传输一个数据包。当需要同时从以太网接口传出两个数据包时,以太网接口会传输一个数据包,同时缓冲另一个数据包。传输第一个数据包后,以太网接口将传输缓冲区中的第二个数据包。当需要从接口传出的流量总和超过接口带宽时,该接口被视为处于超订用状态。例如,如果总共有15 Gbps流量即时进入交换机并需要出口10 Gbps接口,则10 Gbps接口会超订用,因为它无法一次传输15 Gbps流量。
配备 Cloud Scale ASIC 的 Cisco Nexus 9000 系列交换机通过在与出口接口关联的 ASIC 切片的缓冲区内缓冲流量来处理此资源争用问题。如果需要从接口传出的流量总和在一段较长时间内超过接口带宽,则 ASIC 切片的缓冲区会开始填满需要从接口传出的数据包。
当ASIC分片的缓冲区达到90%的利用率时,交换机将生成类似于以下示例的系统日志:
%TAHUSD-SLOT2-4-BUFFER_THRESHOLD_EXCEEDED: Module 2 Instance 0 Pool-group buffer 90 percent threshold is exceeded!
当 ASIC 切片的缓冲区完全填满时,交换机会丢弃需要从接口传出的任何其他流量,直到缓冲区中有空间可用。当交换机丢弃此流量时,交换机会递增出口接口上的输出丢弃数计数器。
生成的系统日志和非零输出丢弃数计数器都会表明接口超订用。每个症状将在各小节中详细探讨。
了解 BUFFER_THRESHOLD_EXCEEDED 系统日志
BUFFER_THRESHOLD_EXCEEDED系统日志的示例:
%TAHUSD-SLOTX-4-BUFFER_THRESHOLD_EXCEEDED: Module X Instance Y Pool-group buffer Z percent threshold is exceeded!
此系统日志包含三个关键信息:
- 模块X:包含超订用接口的线路卡插槽。
- 实例Y:分配给包含超订用接口的ASIC和切片元组的实例编号。
- Pool-group buffer Z:生成系统日志之前受影响的池组缓冲区阈值。这是根据已使用的信元数除以总信元数得出的百分比,如连接到模块 X 时 show hardware internal buffer info pkt-stats 的输出中所观察到的那样。
了解输出丢弃接口计数器
Output Discards接口计数器指示必须已离开接口但由于ASIC片缓冲区已满且无法接受新数据包而无法丢弃的数据包数。show interface和show interface counters errors的输出中显示Output Discards计数器。
switch# show interface Ethernet1/1
Ethernet1/1 is up
admin state is up, Dedicated Interface
  Hardware: 1000/10000/25000/40000/50000/100000 Ethernet, address: 7cad.4f6d.f6d8 (bia 7cad.4f6d.f6d8)
  MTU 1500 bytes, BW 40000000 Kbit , DLY 10 usec
  reliability 255/255, txload 232/255, rxload 1/255
  Encapsulation ARPA, medium is broadcast
  Port mode is trunk
  full-duplex, 40 Gb/s, media type is 40G
  Beacon is turned off
  Auto-Negotiation is turned on  FEC mode is Auto
  Input flow-control is off, output flow-control is off
  Auto-mdix is turned off
  Rate mode is dedicated
  Switchport monitor is off
  EtherType is 0x8100
  EEE (efficient-ethernet) : n/a
    admin fec state is auto, oper fec state is off
  Last link flapped 03:16:50
  Last clearing of "show interface" counters never
  3 interface resets
  Load-Interval #1: 30 seconds
    30 seconds input rate 0 bits/sec, 0 packets/sec
    30 seconds output rate 36503585488 bits/sec, 3033870 packets/sec
    input rate 0 bps, 0 pps; output rate 36.50 Gbps, 3.03 Mpps
  Load-Interval #2: 5 minute (300 seconds)
    300 seconds input rate 32 bits/sec, 0 packets/sec
    300 seconds output rate 39094683384 bits/sec, 3249159 packets/sec
    input rate 32 bps, 0 pps; output rate 39.09 Gbps, 3.25 Mpps
  RX
    0 unicast packets  208 multicast packets  9 broadcast packets
    217 input packets  50912 bytes
    0 jumbo packets  0 storm suppression bytes
    0 runts  0 giants  0 CRC  0 no buffer
    0 input error  0 short frame  0 overrun   0 underrun  0 ignored
    0 watchdog  0 bad etype drop  0 bad proto drop  0 if down drop
    0 input with dribble  0 input discard
    0 Rx pause
  TX
    38298127762 unicast packets  6118 multicast packets  0 broadcast packets
    38298133880 output packets  57600384931480 bytes
    0 jumbo packets
    0 output error  0 collision  0 deferred  0 late collision
    0 lost carrier  0 no carrier  0 babble  57443534227 output discard       <<< Output discards due to oversubcription
    0 Tx pause

switch# show interface Ethernet1/1 counters errors

--------------------------------------------------------------------------------
Port          Align-Err    FCS-Err   Xmit-Err    Rcv-Err  UnderSize OutDiscards
--------------------------------------------------------------------------------
Eth1/1                0          0          0          0          0 57443534227

--------------------------------------------------------------------------------
Port         Single-Col  Multi-Col   Late-Col  Exces-Col  Carri-Sen       Runts
--------------------------------------------------------------------------------
Eth1/1                0          0          0          0          0           0

--------------------------------------------------------------------------------
Port          Giants SQETest-Err Deferred-Tx IntMacTx-Er IntMacRx-Er Symbol-Err
--------------------------------------------------------------------------------
Eth1/1             0          --           0           0           0          0

--------------------------------------------------------------------------------
Port         InDiscards
--------------------------------------------------------------------------------
Eth1/1                0
超订用场景示例
请考虑以下场景:两个IXIA流量生成器之间的流量通过机箱插槽1和2中插入了两个N9K-X9736C-FX线卡的Nexus 9504交换机。100 Gbps流量通过100 Gbps接口Ethernet1/1进入交换机,需要出口40 Gbps接口Ethernet2/2。因此,Ethernet2/2超订用。拓扑方案的示例:
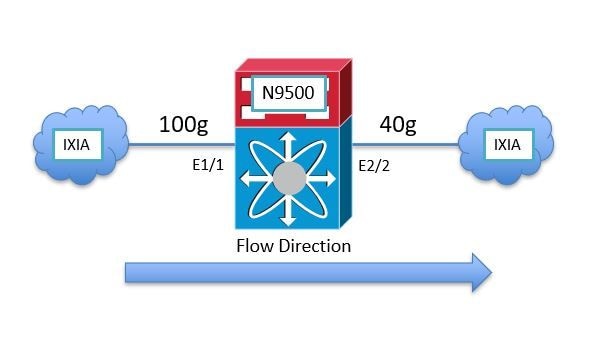
由于 Nexus 9000 Cloud Scale ASIC 使用共享内存出口缓冲区架构,因此必须检查出口接口 Ethernet2/2 的缓冲区以查看拥塞情况。在本例中,插槽 2 中插入的线卡为出口线卡,因此必须先使用 attach module 2 命令,然后再使用 show hardware internal tah buffer counters 命令查看内部硬件缓冲区。请注意信元 0 切片 0 池组和关联池的非零“占用丢包数”计数器,该计数器表示由于池组缓冲区被完全占用而丢弃的数据包数量。
switch# attach module 2
module-2# show hardware internal tah buffer counters

Unit: 0 Slice: 0
====================
|------------------------------------------------------------------------------------------------------------------|
|                                               Output Pool-Group drops                                            |
|                                Drop-PG      No-drop      CPU--PG      LCPU-PG      RCPU-PG      SPAN-PG          |
|------------------------------------------------------------------------------------------------------------------|
Occupancy drops                  51152554987        0            0            0            0            0       |
AQM drops                              0            0          N/A          N/A         N/A          N/A        |

|--------------------------------------------------------------------------------------------------------------------|
|                                                        Output UC Pool counters                                     |
|                               Pool 0     Pool 1     Pool 2     Pool 3     Pool 4     Pool 5     Pool 6     Pool 7  |
|--------------------------------------------------------------------------------------------------------------------|
Dynamic Threshold (cells)        93554      93554      93554      93554      93554      93554      93554      93554  |

Occupancy drops                 51152555398     0          0          0          0          0          0          0  |
AQM drops                            0          0          0          0          0          0          0          0  |

|--------------------------------------------------------------------------------------------------------------------|
|                                                        Output MC Pool counters                                     |
|                               Pool 0     Pool 1     Pool 2     Pool 3     Pool 4     Pool 5     Pool 6     Pool 7  |
|--------------------------------------------------------------------------------------------------------------------|
Dynamic Threshold (cells)        93554      93554      93554      93554      93554      93554      93554      93554  |
Dynamic Threshold (desc)         93554      93554      93554      93554      93554      93554      93554      93554  |
Dynamic Threshold (inq thr)      64035      64035      64035      64035      64035      64035      64035      64035  |

Occupancy drops                      0          0          0          0          0          0          0          0  |

|--------------+---------+---------+---------+---------+---------+--------+---------+---------+|
|                                     Additional counters                                      |
|--------------+---------+---------+---------+---------+---------+--------+---------+---------+|
          MEM cell drop reason                  :      0
          MEM descriptor drop reason            :      0
          OPG cell drop reason                  :      0
          OPG descriptor drop reason            :      0
          OPG CPU cell drop reason              :      0
          OPG CPU descriptor drop reason        :      0
          OPG SPAN cell drop reason             :      0
          OPG SPAN descriptor drop reason       :      0
          OPOOL cell drop reason                :      0
          OPOOL descriptor drop reason          :      0
          UC OQUEUE cell drop reason            : 51152556479
          MC OQUEUE cell drop reason            : 27573307
          OQUEUE descriptor drop reason         :      0
          MC OPOOL cell drop reason             :      0
          FWD DROP                              :     15
          SOD                                   :      0
          BMM BP                                :      0
          No Drop                               :      0
          Packets received                      : 87480806439
          TRUNC MTU                             :      0
          TRUNK BMM BP                          :      0
          VOQFC messages sent                   :      0
          SOD messages sent                     :      0
          SPAN desciptor drop                   :      0

Unit: 1 Slice: 0
====================
|------------------------------------------------------------------------------------------------------------------|
|                                               Output Pool-Group drops                                            |
|                                Drop-PG      No-drop      CPU--PG      LCPU-PG      RCPU-PG      SPAN-PG          |
|------------------------------------------------------------------------------------------------------------------|
Occupancy drops                        0            0            0            0            0            0       |
AQM drops                              0            0          N/A          N/A         N/A          N/A        |

|--------------------------------------------------------------------------------------------------------------------|
|                                                        Output UC Pool counters                                     |
|                               Pool 0     Pool 1     Pool 2     Pool 3     Pool 4     Pool 5     Pool 6     Pool 7  |
|--------------------------------------------------------------------------------------------------------------------|
Dynamic Threshold (cells)        93554      93554      93554      93554      93554      93554      93554      93554  |

Occupancy drops                      0          0          0          0          0          0          0          0  |
AQM drops                            0          0          0          0          0          0          0          0  |

|--------------------------------------------------------------------------------------------------------------------|
|                                                        Output MC Pool counters                                     |
|                               Pool 0     Pool 1     Pool 2     Pool 3     Pool 4     Pool 5     Pool 6     Pool 7  |
|--------------------------------------------------------------------------------------------------------------------|
Dynamic Threshold (cells)        93554      93554      93554      93554      93554      93554      93554      93554  |
Dynamic Threshold (desc)         93554      93554      93554      93554      93554      93554      93554      93554  |
Dynamic Threshold (inq thr)      64035      64035      64035      64035      64035      64035      64035      64035  |

Occupancy drops                      0          0          0          0          0          0          0          0  |

|--------------+---------+---------+---------+---------+---------+--------+---------+---------+|
|                                     Additional counters                                      |
|--------------+---------+---------+---------+---------+---------+--------+---------+---------+|
          MEM cell drop reason                  :      0
          MEM descriptor drop reason            :      0
          OPG cell drop reason                  :      0
          OPG descriptor drop reason            :      0
          OPG CPU cell drop reason              :      0
          OPG CPU descriptor drop reason        :      0
          OPG SPAN cell drop reason             :      0
          OPG SPAN descriptor drop reason       :      0
          OPOOL cell drop reason                :      0
          OPOOL descriptor drop reason          :      0
          UC OQUEUE cell drop reason            :      0
          MC OQUEUE cell drop reason            :      0
          OQUEUE descriptor drop reason         :      0
          MC OPOOL cell drop reason             :      0
          FWD DROP                              :      8
          SOD                                   :      0
          BMM BP                                :      0
          No Drop                               :      0
          Packets received                      : 45981341
          TRUNC MTU                             :      0
          TRUNK BMM BP                          :      0
          VOQFC messages sent                   :      0
          SOD messages sent                     :      0
          SPAN desciptor drop                   :      0
每个 ASIC 信元/切片元组都通过一个称为“实例”的唯一标识来表示。 show hardware internal buffer info pkt-stats 命令的输出显示有关每个实例的拥塞池组(缩写为“PG”)的详细信息。该命令还显示缓冲区中已使用信元的历史峰值/最大数量。
最后, 该命令显示具有缓冲流量的端口的 Cloud Scale ASIC 端口标识符的即时快照。此命令的示例:
switch# attach module 2
module-2# show hardware internal buffer info pkt-stats

Instance 0

============
|------------------------------------------------------------------------------------------------------------|
|                                   Output Pool-Group Buffer Utilization (cells/desc)                        |
|                                Drop-PG      No-drop      CPU--PG      LCPU-PG      RCPU-PG      SPAN-PG    |
|------------------------------------------------------------------------------------------------------------|
Total Instant Usage (cells)        59992            0            0            0            0            0       |
Remaining Instant Usage (cells)    33562            0         1500          250         1500         1500       |
Peak/Max Cells Used                90415            0          N/A          N/A          N/A          N/A       |
Switch Cells Count                 93554            0         1500          250         1500         1500       |

Total Instant Usage (desc)             0            0            0            0            0            0       |
Remaining Instant Usage (desc)     93554            0         1500          250         1500         1500       |
Switch Desc Count                  93554            0         1500          250         1500         1500       |

|--------------------------------------------------------------------------------------------------------------------|
|                                    Output UC Pool Buffer Utilization (cells/desc)                                  |
|                               Pool 0     Pool 1     Pool 2     Pool 3     Pool 4     Pool 5     Pool 6     Pool 7  |
|--------------------------------------------------------------------------------------------------------------------|
Total Instant Usage (cells)      60027          0          0          0          0          0          0          0  |
Total Instant Usage (desc)           0          0          0          0          0          0          0          0  |
Peak/Max Cells Used              62047          0          0          0          0          0          0          0  |

|--------------------------------------------------------------------------------------------------------------------|
|                                    Output MC Pool Buffer Utilization (cells/desc)                                  |
|                               Pool 0     Pool 1     Pool 2     Pool 3     Pool 4     Pool 5     Pool 6     Pool 7  |
|--------------------------------------------------------------------------------------------------------------------|
Total Instant Usage (cells)          0          0          0          0          0          0          0          0  |
Total Instant Usage (desc)           0          0          0          0          0          0          0          0  |
Total Instant Usage (inq cells)      0          0          0          0          0          0          0          0  |
Total Instant Usage (packets)        0          0          0          0          0          0          0          0  |
Peak/Max Cells Used              60399          0          0          0          0          0          0          0  |

|--------------------------------------------------------------------------|
|              Instant Buffer utilization per queue per port               |
|      Each line displays the number of cells/desc utilized for a given    |
|                     port for each QoS queue                              |
|             One cell represents approximately 416 bytes                  |

|--------------+---------+---------+---------+---------+---------+--------+---------+---------+|
|ASIC Port         Q7        Q6        Q5        Q4        Q3        Q2        Q1        Q0    |
|--------------+---------+---------+---------+---------+---------+--------+---------+---------+|
 [12]                                                                                               <<< ASIC Port 12 in Unit 0 Instance 0 is likely the congested egress interface
          UC->       0         0         0         0         0         0         0     59988   |
    MC cells->       0         0         0         0         0         0         0         0   |
    MC desc->        0         0         0         0         0         0         0         0   |
您将看到该命令的峰值变化。使用此命令可将系统日志与特定池组、池或端口中的潜在峰值关联。
switch# show hardware internal buffer info pkt-stats peak

slot  1
=======


Instance 0

============

|--------------+---------+---------+---------+---------+---------+|
|                     Pool-Group Peak counters                    |
|--------------+---------+---------+---------+---------+---------+|
          Drop PG       :           0
          No-drop PG    :           0

|--------------+---------+---------+---------+---------+---------+|
|                           Pool Peak counters                    |
|--------------+---------+---------+---------+---------+---------+|
          MC Pool 0     :           0
          MC Pool 1     :           0
          MC Pool 2     :           0
          MC Pool 3     :           0
          MC Pool 4     :           0
          MC Pool 5     :           0
          MC Pool 6     :           0
          MC Pool 7     :           0

          UC Pool 0     :           0
          UC Pool 1     :           0
          UC Pool 2     :           0
          UC Pool 3     :           0
          UC Pool 4     :           0
          UC Pool 5     :           0
          UC Pool 6     :           0
          UC Pool 7     :           0

|--------------+---------+---------+---------+---------+---------+|
|                           Port Peak counters                    |
|             classes mapped to count_0: 0 1 2 3 4 5 6 7
|             classes mapped to count_1: None
|--------------+---------+---------+---------+---------+---------+|
 [0]                                             <<< ASIC Port. This can be checked via "show interface hardware-mappings"
          count_0       :           0
          count_1       :           0
 [1]
          count_0       :           0
          count_1       :           0
show interface hardware-mappings 命令可用于将 Cloud Scale ASIC 端口标识符转换为前面板端口。在上述示例中,与切片/实例 0 上 ASIC 信元 0 关联的 ASIC 端口 12(由 show interface hardware-mappings 输出中的 SPort 列表示)有 59,988 个已占用信元,每个信元为 416 个字节。show interface hardware-mappings命令的一个示例将此接口映射到前面板端口Ethernet2/2。
switch# show interface hardware-mappings
Legends:
       SMod  - Source Mod. 0 is N/A
       Unit  - Unit on which port resides. N/A for port channels
       HPort - Hardware Port Number or Hardware Trunk Id:
       HName - Hardware port name. None means N/A
       FPort - Fabric facing port number. 255 means N/A
       NPort - Front panel port number
       VPort - Virtual Port Number. -1 means N/A
       Slice - Slice Number. N/A for BCM systems
       SPort - Port Number wrt Slice. N/A for BCM systems
       SrcId - Source Id Number. N/A for BCM systems
       MacIdx - Mac index. N/A for BCM systems
       MacSubPort - Mac sub port. N/A for BCM systems

-------------------------------------------------------------------------------------------------------
Name       Ifindex  Smod Unit HPortFPort NPort VPort Slice SPort SrcId MacId MacSP VIF  Block BlkSrcID
-------------------------------------------------------------------------------------------------------
Eth2/2     1a080200 5    0    12   255   4     -1    0     12    24    3     0     149  0     24
此外,使用show queuing interface命令和一个示例,会丢弃具有QoS队列的Ethernet2/2接口的超订用:
switch# show queuing interface Ethernet2/2


Egress Queuing for Ethernet2/2 [System]
------------------------------------------------------------------------------
QoS-Group# Bandwidth% PrioLevel                Shape                   QLimit
                                   Min          Max        Units
------------------------------------------------------------------------------
      7             -         1           -            -     -            9(D)
      6             0         -           -            -     -            9(D)
      5             0         -           -            -     -            9(D)
      4             0         -           -            -     -            9(D)
      3             0         -           -            -     -            9(D)
      2             0         -           -            -     -            9(D)
      1             0         -           -            -     -            9(D)
      0           100         -           -            -     -            9(D)
+-------------------------------------------------------------+
|                              QOS GROUP 0                    |
+-------------------------------------------------------------+
|                           |  Unicast       |Multicast       |
+-------------------------------------------------------------+
|                   Tx Pkts |     35593332351|        18407162|
|                   Tx Byts |  53532371857088|     27684371648|
| WRED/AFD & Tail Drop Pkts |     53390604466|        27573307|
| WRED/AFD & Tail Drop Byts |  80299469116864|       110293228|
|              Q Depth Byts |        24961664|               0|
|       WD & Tail Drop Pkts |     53390604466|        27573307|
+-------------------------------------------------------------+
|                              QOS GROUP 1                    |
+-------------------------------------------------------------+
|                           |  Unicast       |Multicast       |
+-------------------------------------------------------------+
|                   Tx Pkts |               0|               0|
|                   Tx Byts |               0|               0|
| WRED/AFD & Tail Drop Pkts |               0|               0|
| WRED/AFD & Tail Drop Byts |               0|               0|
|              Q Depth Byts |               0|               0|
|       WD & Tail Drop Pkts |               0|               0|
+-------------------------------------------------------------+
|                              QOS GROUP 2                    |
+-------------------------------------------------------------+
|                           |  Unicast       |Multicast       |
+-------------------------------------------------------------+
|                   Tx Pkts |               0|               0|
|                   Tx Byts |               0|               0|
| WRED/AFD & Tail Drop Pkts |               0|               0|
| WRED/AFD & Tail Drop Byts |               0|               0|
|              Q Depth Byts |               0|               0|
|       WD & Tail Drop Pkts |               0|               0|
+-------------------------------------------------------------+
|                              QOS GROUP 3                    |
+-------------------------------------------------------------+
|                           |  Unicast       |Multicast       |
+-------------------------------------------------------------+
|                   Tx Pkts |               0|               0|
|                   Tx Byts |               0|               0|
| WRED/AFD & Tail Drop Pkts |               0|               0|
| WRED/AFD & Tail Drop Byts |               0|               0|
|              Q Depth Byts |               0|               0|
|       WD & Tail Drop Pkts |               0|               0|
+-------------------------------------------------------------+
|                              QOS GROUP 4                    |
+-------------------------------------------------------------+
|                           |  Unicast       |Multicast       |
+-------------------------------------------------------------+
|                   Tx Pkts |               0|               0|
|                   Tx Byts |               0|               0|
| WRED/AFD & Tail Drop Pkts |               0|               0|
| WRED/AFD & Tail Drop Byts |               0|               0|
|              Q Depth Byts |               0|               0|
|       WD & Tail Drop Pkts |               0|               0|
+-------------------------------------------------------------+
|                              QOS GROUP 5                    |
+-------------------------------------------------------------+
|                           |  Unicast       |Multicast       |
+-------------------------------------------------------------+
|                   Tx Pkts |               0|               0|
|                   Tx Byts |               0|               0|
| WRED/AFD & Tail Drop Pkts |               0|               0|
| WRED/AFD & Tail Drop Byts |               0|               0|
|              Q Depth Byts |               0|               0|
|       WD & Tail Drop Pkts |               0|               0|
+-------------------------------------------------------------+
|                              QOS GROUP 6                    |
+-------------------------------------------------------------+
|                           |  Unicast       |Multicast       |
+-------------------------------------------------------------+
|                   Tx Pkts |               0|               0|
|                   Tx Byts |               0|               0|
| WRED/AFD & Tail Drop Pkts |               0|               0|
| WRED/AFD & Tail Drop Byts |               0|               0|
|              Q Depth Byts |               0|               0|
|       WD & Tail Drop Pkts |               0|               0|
+-------------------------------------------------------------+
|                              QOS GROUP 7                    |
+-------------------------------------------------------------+
|                           |  Unicast       |Multicast       |
+-------------------------------------------------------------+
|                   Tx Pkts |               0|               0|
|                   Tx Byts |               0|               0|
| WRED/AFD & Tail Drop Pkts |               0|               0|
| WRED/AFD & Tail Drop Byts |               0|               0|
|              Q Depth Byts |               0|               0|
|       WD & Tail Drop Pkts |               0|               0|
+-------------------------------------------------------------+
|                      CONTROL QOS GROUP                      |
+-------------------------------------------------------------+
|                           |  Unicast       |Multicast       |
+-------------------------------------------------------------+
|                   Tx Pkts |            5704|               0|
|                   Tx Byts |          725030|               0|
|            Tail Drop Pkts |               0|               0|
|            Tail Drop Byts |               0|               0|
+-------------------------------------------------------------+
|                         SPAN QOS GROUP                      |
+-------------------------------------------------------------+
|                           |  Unicast       |Multicast       |
+-------------------------------------------------------------+
|                   Tx Pkts |               0|               0|
|                   Tx Byts |               0|               0|
+-------------------------------------------------------------+

Per Slice Egress SPAN Statistics
---------------------------------------------------------------
         SPAN Copies Tail Drop Pkts                           0
         SPAN Input Queue Drop Pkts                           0
 SPAN Copies/Transit Tail Drop Pkts                           0
         SPAN Input Desc Drop  Pkts                           0
您可以使用show interface命令检验出口接口Ethernet2/2是否具有非零输出丢弃计数器。
switch# show interface Ethernet2/2
Ethernet2/2 is up
admin state is up, Dedicated Interface
  Hardware: 1000/10000/25000/40000/50000/100000 Ethernet, address: 7cad.4f6d.f6d8 (bia 7cad.4f6d.f6d8)
  MTU 1500 bytes, BW 40000000 Kbit , DLY 10 usec
  reliability 255/255, txload 232/255, rxload 1/255
  Encapsulation ARPA, medium is broadcast
  Port mode is trunk
  full-duplex, 40 Gb/s, media type is 40G
  Beacon is turned off
  Auto-Negotiation is turned on  FEC mode is Auto
  Input flow-control is off, output flow-control is off
  Auto-mdix is turned off
  Rate mode is dedicated
  Switchport monitor is off
  EtherType is 0x8100
  EEE (efficient-ethernet) : n/a
    admin fec state is auto, oper fec state is off
  Last link flapped 03:16:50
  Last clearing of "show interface" counters never
  3 interface resets
  Load-Interval #1: 30 seconds
    30 seconds input rate 0 bits/sec, 0 packets/sec
    30 seconds output rate 36503585488 bits/sec, 3033870 packets/sec
    input rate 0 bps, 0 pps; output rate 36.50 Gbps, 3.03 Mpps
  Load-Interval #2: 5 minute (300 seconds)
    300 seconds input rate 32 bits/sec, 0 packets/sec
    300 seconds output rate 39094683384 bits/sec, 3249159 packets/sec
    input rate 32 bps, 0 pps; output rate 39.09 Gbps, 3.25 Mpps
  RX
    0 unicast packets  208 multicast packets  9 broadcast packets
    217 input packets  50912 bytes
    0 jumbo packets  0 storm suppression bytes
    0 runts  0 giants  0 CRC  0 no buffer
    0 input error  0 short frame  0 overrun   0 underrun  0 ignored
    0 watchdog  0 bad etype drop  0 bad proto drop  0 if down drop
    0 input with dribble  0 input discard
    0 Rx pause
  TX
    38298127762 unicast packets  6118 multicast packets  0 broadcast packets
    38298133880 output packets  57600384931480 bytes
    0 jumbo packets
    0 output error  0 collision  0 deferred  0 late collision
    0 lost carrier  0 no carrier  0 babble  57443534227 output discard       <<< Output discards due to oversubcription
    0 Tx pause
后续步骤
如果您在配备 Cloud Scale ASIC 的 Nexus 9000 系列交换机上观察到输出丢弃,可以使用以下一种或多种方法解决问题:
- 如果遇到输出丢弃的接口是单个接口并且未捆绑到端口通道中,则可以升级该接口的带宽以帮助缓解拥塞。例如,如果拥塞的出口接口是10 Gbps接口,并且您升级至25 Gbps、40 Gbps接口或100 Gbps接口,则可帮助解决此问题。
- 根据出口接口的收发器外形,您可以升级收发器(可以从插入QSFP端口内CVR-QSFP-SFP10G的10 Gbps SFP+迁移到本地40 Gbps QSFP收发器)。
- 如果将拥塞的出口接口配置从10 Gbps端口迁移到25 Gbps、40 Gbps或100 Gbps端口,也可以完成此操作。
- 如果遇到输出丢弃的接口是单个接口并且未捆绑到端口通道中,则可以将拥塞接口和相同带宽的另一个接口一起配置为端口通道的成员,从而缓解拥塞。
- 如果遇到输出丢弃的接口是端口通道接口,则向端口通道添加成员可以增加整个端口通道的带宽,并改进多个大型流量的负载均衡散列处理。
- 验证网络中主机之间的拥塞流量是否涉及速度降低的接口(例如,通过40 Gbps接口进入交换机并通过10 Gbps接口流出交换机的流量)。 这可能成为导致网络拥塞的瓶颈。要消除此瓶颈,请将低速接口(例如10 Gbps)升级到高速接口(例如25 Gbps、40 Gbps等),这样可以缓解网络拥塞。
- 如果无法增加拥塞出口接口上的可用带宽,请验证端到端 QoS 并为网络应用适当的排队操作。
- 如果微突发是间歇性拥塞的潜在原因,请参阅本文档的监控微突发部分,了解有关如何配置微突发监控的信息。
Additional Information
本文档的这一部分进一步介绍了在遇到 BUFFER_THRESHOLD_EXCEEDED 系统日志、网络拥塞/超订用场景和增量输出丢弃接口计数器时可采取的后续步骤。
BUFFER_THRESHOLD_EXCEEDED 系统日志配置选项
您可以修改系统缓冲区状态轮询间隔,该间隔控制系统轮询 ASIC 切片缓冲区当前利用率的频率。这通过 hardware profile buffer info poll-interval 全局配置命令来完成。默认配置值为 5,000 毫秒。此配置可以全局修改,也可以按模块修改。下文显示了此配置命令的示例,其中该配置被修改为 1,000 毫秒的值。
switch# configure terminal
Enter configuration commands, one per line. End with CNTL/Z.
switch(config)# hardware profile buffer info poll-interval timer 1000
switch(config)# end
switch# show running-config | include hardware.profile.buffer
hardware profile buffer info poll-interval timer 1000
switch#
您可以修改端口出口缓冲区使用阈值,该阈值控制系统在什么情况下生成 BUFFER_THRESHOLD_EXCEEDED 系统日志以指示 ASIC 切片缓冲区利用率已超过配置的阈值。这通过 hardware profile buffer info port-threshold 全局配置命令来完成。默认配置值为 90%。此配置可以全局修改,也可以按模块修改。请参阅配置命令,将配置命令修改为值80%:
switch# configure terminal
Enter configuration commands, one per line. End with CNTL/Z.
switch(config)# hardware profile buffer info port-threshold threshold 80
switch(config)# end
switch# show running-config | include hardware.profile.buffer
hardware profile buffer info port-threshold threshold 80
switch#
您可以修改交换机生成的 BUFFER_THRESHOLD_EXCEEDED 系统日志之间的最小间隔。您还可以禁用BUFFER_THRESHOLD_EXCEEDED系统日志。这可通过 hardware profile buffer info syslog-interval timer 全局配置命令来完成。默认配置值为 120 秒。通过将该值设置为 0 秒,可以完全禁用系统日志。请参阅完全禁用系统日志的配置命令:
switch# configure terminal
Enter configuration commands, one per line. End with CNTL/Z.
switch(config)# hardware profile buffer info syslog-interval timer 0
switch(config)# end
switch# show running-config | include hardware.profile.buffer
hardware profile buffer info syslog-interval timer 0
switch#
针对网络拥塞场景收集的日志
除了本文档中列出的命令外,您还可以从受网络拥塞情况影响的交换机收集日志,以确定拥塞的出口接口。
- show tech-support details 命令的输出。
- show tech-support usd-all 命令的输出。
- show tech-support ipqos all 命令的输出。
- 使用插入了 Cisco Cloud Scale 线卡的 Nexus 9500 系列交换机时 show system internal interface counters peak module{x} 命令的输出,其中 {x} 是托管拥塞出口接口的模块的插槽编号。
监控微突发
如果拥塞或超订用发生在很短的时间间隔(微突发)内,则需要其他信息才能准确描述超订用对交换机的影响。
配备 Cisco Cloud Scale ASIC 的 Cisco Nexus 9000 系列交换机可以监控流量是否存在微突发,这些微突发可能会导致您所处的环境中出现暂时的网络拥塞和流量丢失。有关微爆发以及如何配置此功能的详细信息,请参阅文档:
- Cisco Nexus 9000 系列 NX-OS 服务质量配置指南版本 10.1(x) 中的“微突发监控”章节
- Cisco Nexus 9000 系列 NX-OS 服务质量配置指南版本 9.3(x) 中的“微突发监控”章节
- Cisco Nexus 9000 系列 NX-OS 服务质量配置指南版本 9.2(x) 中的“微突发监控”章节
- Cisco Nexus 9000 系列 NX-OS 服务质量配置指南版本 7.x 中的“微突发监控”章节
相关信息
修订历史记录
| 版本 | 发布日期 | 备注 |
|---|---|---|
7.0 |
28-May-2026
|
拼写、缩进和间距更新。 |
6.0 |
09-Nov-2023
|
Update(更新) |
5.0 |
04-Oct-2023
|
重新认证 |
3.0 |
21-Jan-2022
|
将“后续步骤”部分添加到文档。 |
2.0 |
03-Oct-2021
|
更新适用硬件部分以包括新硬件。 |
1.0 |
31-Aug-2021
|
初始版本 |
 反馈
反馈