了解Catalyst 9000交换机上的输出丢弃
下载选项
非歧视性语言
此产品的文档集力求使用非歧视性语言。在本文档集中,非歧视性语言是指不隐含针对年龄、残障、性别、种族身份、族群身份、性取向、社会经济地位和交叉性的歧视的语言。由于产品软件的用户界面中使用的硬编码语言、基于 RFP 文档使用的语言或引用的第三方产品使用的语言,文档中可能无法确保完全使用非歧视性语言。 深入了解思科如何使用包容性语言。
关于此翻译
思科采用人工翻译与机器翻译相结合的方式将此文档翻译成不同语言,希望全球的用户都能通过各自的语言得到支持性的内容。 请注意:即使是最好的机器翻译,其准确度也不及专业翻译人员的水平。 Cisco Systems, Inc. 对于翻译的准确性不承担任何责任,并建议您总是参考英文原始文档(已提供链接)。
简介
本文档介绍如何对基于UADP ASIC的Catalyst 9000系列平台上的高速接口上的输出丢弃进行故障排除。
先决条件
要求
Cisco 建议您了解以下主题:
- 标准QoS概念
- 模块化QoS命令行界面(CLI)
- Wireshark
使用的组件
本文档中的信息基于以下软件和硬件版本:
- UADP 2.0和UADP 3.0 ASIC类型
- Catalyst 9200
- Catalyst 9300
- Catalyst 9400
- Catalyst 9500
- Catalyst 9600
- Cisco IOS® XE 16.X或17.X软件
注意:有关在其他思科平台上启用这些功能所使用的命令,请参阅相应的配置指南。
本文档中的信息都是基于特定实验室环境中的设备编写的。本文档中使用的所有设备最初均采用原始(默认)配置。如果您的网络处于活动状态,请确保您了解所有命令的潜在影响。
背景信息
高速接口上的输出丢弃是任何网络环境中都会发生的问题,尤其是当它涉及支持10 Gbps或更高数据传输速率的接口时。当数据包在传送到网络之前被接口丢弃时,就会发生输出丢弃。
人们经常误解当低利用率时输出丢弃是如何解释接口利用率的:
- 当单个接口发出的流量过多时,该接口的缓冲区可能会被淹没,并出现输出丢弃。缓冲区过少的接口也会增加输出丢弃的概率。
- 接口速度和所连接设备的速度不匹配也可能导致输出丢弃。例如,如果一个10 Gbps接口连接到仅支持1 Gbps数据传输速率的设备,那么如果接口无法降低数据传输速率以匹配设备的功能,则它可能会丢弃数据包。
但是,在大多数情况下,输出丢弃是由耗尽端口缓冲区的微突发流量引起的:
- 微突发是指在非常短的时间内发送大量流量的现象,通常它仅持续几毫秒,并超过接口的可用带宽。
- 发生微突发时,网络设备需要缓冲流量,直到流量能够传输到网络中。如果超过缓冲区大小,数据包将被丢弃。
网络流量通常以链路的平均利用率来衡量(根据配置在30秒到5分钟之间测量)。 虽然此平均值显示流量稳定且相对均匀,但以毫秒级规模查看时,接口利用率通常非常繁忙。
图1.显示了高速接口上输出丢弃的根本原因的可视表示。
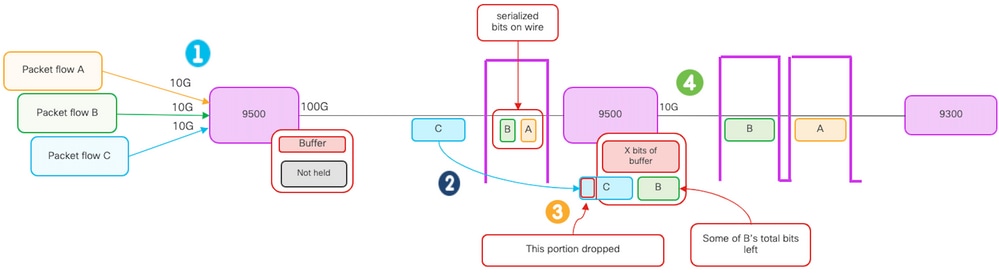
根据图示:
- 数据包流A、B和C代表数据流中的位组。
- 流A、B和C通过100G接口传输并在下一跳交换机接收。
- 观察A和部分B位成功转发到10G出口接口。
- 但是,当流量C到达时,交换机缓冲了流量B的一些比特,原因是无法以比特到达的速度将其出队。
- 缓冲区已满,无法容纳数据包C中的剩余B位和所有位。
- 如果入口分类器确定下一个帧中甚至一个比特都没有空间,它会丢弃整个数据包!
- 流A和部分B通过10G接口传输。
接口速度/带宽都有一些误称,这是因为:
- 带宽=数据(位)/时间
- 当位从10G > 100G > 10G传输时,它们不会“物理加速”
速度差是交错能力/每时间间隔的通道数/脉冲数、编码机制等,与介质(光/电子)的速度更快不同。
提示:在接口配置模式下使用load-interval <30-600>命令以秒为单位修改负载间隔延迟。(加载间隔代表交换机轮询接口计数器的频率)。
验证
对高速接口上的输出丢弃进行故障排除可能是一个复杂的过程,但有一些常规步骤可帮助确定和解决问题。
步骤1.确定受影响的接口:
- 首先缩小遇到输出丢弃的接口。
- 使用show interfaces | include is up|Total output drops命令输出或使用监控工具确定哪个接口面临问题。
步骤2.确定入站和出站接口:
- 要验证接口到ASIC的映射,请运行show platform software fed <switch|active> ifm mappings命令。
步骤3.检验缓冲区分配:
- 验证受影响接口的缓冲区分配和接口配置非常重要。
步骤4.使用Wireshark检验微喷孔:
- 高速接口上的输出丢弃通常是由流量微爆发引起的。
- 使用Wireshark等流量分析工具监控流量模式并识别任何潜在微爆发。
步骤5.考虑硬件升级:
- 如果上述步骤不能解决问题,则需要升级硬件(例如接口、设备或网络基础设施)以处理增加的流量。
确定受影响的接口
要识别出现输出丢弃的受影响接口,请使用show interfaces命令。
- 此命令提供关于每个接口的详细信息,其中包括有关输入和输出错误、丢弃的数据包和其他关键信息的统计信息。
要缩小接口列表的范围并快速识别受影响的接口,请使用show interfaces | include is up|Total output drops command to filter out interfaces down或admin down,并且仅显示处于活动状态且具有丢弃的接口。
- 例如,您可以使用此命令仅显示已发生输出丢弃的接口。
Cat9k(config)#show interfaces | in is up|Total output drops
HundredGigE1/0/1 is up, line protocol is up (connected)
Input queue: 0/2000/0/0 (size/max/drops/flushes); Total output drops: 54845
HundredGigE1/0/10 is up, line protocol is up (connected)
Input queue: 0/2000/0/0 (size/max/drops/flushes); Total output drops: 1540231
--snip--
提示:使用show interfaces命令并使用适当的条件过滤输出,以便快速轻松地识别受影响的接口。采取必要步骤解决此问题。
默认情况下,在Catalyst 9000系列交换机上,出口丢包以字节而不是数据包显示。必须确定发现的输出丢弃量是否具有实际影响或只是由瞬时突发流量引起的。
要计算接口上传输的总输出字节数被丢弃的百分比,请执行以下操作:
- 从接口收集总输出丢弃计数。
- 收集来自接口的总输出字节数。
- 计算输出丢弃的百分比。将总输出丢弃数除以总输出字节数并乘以100。
这提供了接口上丢弃的输出字节的百分比,可以帮助您确定是否存在需要解决的拥塞或缓冲区分配问题,或者输出丢弃是否由瞬时微总线流量引起。
使用showinterface <interface> 命令收集信息。
Cat9k#show interfaces twentyFiveGigE 1/0/41
TwentyFiveGigE1/0/41 is up, line protocol is up (connected)
  Hardware is Twenty Five Gigabit Ethernet, address is dc77.4c8a.4289 (bia dc77.4c8a.4289)
  MTU 1500 bytes, BW 25000000 Kbit/sec, DLY 10 usec,
     reliability 255/255, txload 3/255, rxload 1/255
  Encapsulation ARPA, loopback not set
  Keepalive set (10 sec)
  Full-duplex, 10Gb/s, link type is auto, media type is SFP-10GBase-AOC1M
  input flow-control is on, output flow-control is off
  ARP type: ARPA, ARP Timeout 04:00:00
  Last input 00:00:06, output 00:00:10, output hang never
  Last clearing of "show interface" counters 6w1d
  Input queue: 0/2000/0/0 (size/max/drops/flushes); Total output drops: 299040207
  Queueing strategy: Class-based queueing
  Output queue: 0/40 (size/max)
  30 second input rate 767000 bits/sec, 155 packets/sec
  30 second output rate 14603000 bits/sec, 1819 packets/sec
     931864194 packets input, 572335285416 bytes, 0 no buffer
     Received 933005 broadcasts (933005 multicasts)
     0 runts, 0 giants, 0 throttles
     0 input errors, 0 CRC, 0 frame, 0 overrun, 0 ignored
     0 watchdog, 0 multicast, 0 pause input
     0 input packets with dribble condition detected
     1067891106 packets output, 5930422327799 bytes, 0 underruns
--snip--
总输出丢弃数: 299040207
总输出字节数: 5930422327799
输出丢包百分比= 299040207/5930422327799 x 100 = 0.005%
在本示例中,总输出丢弃代表过去六周内(最后清除计数器6w1d)在该接口上传输的总字节数的0.005%。
- 数据包总数与丢弃的数量比较小,不会产生任何影响。
确定入站和出站接口
要更好地在Catalyst 9000系列交换机上分配软缓冲区并管理流量,请考虑选择不同ASIC中的入站和出站接口。
软缓冲区也称为动态缓冲区或共享缓冲区,是指动态分配的部分内存,用于在拥塞或高流量负载时临时存储数据包。

提示:有关Catalyst 9000系列交换机中缓冲区分配的详细信息,请参阅了解Catalyst 9000交换机上的队列缓冲区分配文档。
根据Catalyst 9000交换机特定型号的架构,必须注意的是,它们通常包含多个负责各种功能的ASIC。
要验证接口到ASIC的映射,可以运行以下命令:show platform software fed <switch|active> ifm mappings
此示例显示接口到ASIC的映射。接口范围TenGigabitEthernet1/0/1到TenGigabitEthernet1/0/24映射到ASIC 1,而其余接口映射到ASIC 0:
Cat9k#show platform software fed switch active ifm mappings
Interface                 IF_ID    Inst Asic Core Port SubPort Mac  Cntx LPN  GPN  Type Active
TenGigabitEthernet1/0/1   0x9        3   1   1    0      0      11   0    1    1    NIF  Y
TenGigabitEthernet1/0/2   0xa        3   1   1    1      0      10   1    2    2    NIF  Y
TenGigabitEthernet1/0/3   0xb        3   1   1    2      0      9    2    3    3    NIF  Y
TenGigabitEthernet1/0/4   0xc        3   1   1    3      0      8    3    4    4    NIF  Y
TenGigabitEthernet1/0/5   0xd        3   1   1    4      0      7    4    5    5    NIF  Y
TenGigabitEthernet1/0/6   0xe        3   1   1    5      0      6    5    6    6    NIF  Y
TenGigabitEthernet1/0/7   0xf        3   1   1    6      0      5    6    7    7    NIF  Y
TenGigabitEthernet1/0/8   0x10       3   1   1    7      0      4    7    8    8    NIF  Y
TenGigabitEthernet1/0/9   0x11       3   1   1    8      0      3    8    9    9    NIF  Y
TenGigabitEthernet1/0/10  0x12       3   1   1    9      0      2    9    10   10   NIF  Y
TenGigabitEthernet1/0/11  0x13       3   1   1    10     0      1    10   11   11   NIF  Y
TenGigabitEthernet1/0/12  0x14       3   1   1    11     0      0    11   12   12   NIF  Y
TenGigabitEthernet1/0/13  0x15       2   1   0    12     0      11   0    13   13   NIF  Y
TenGigabitEthernet1/0/14  0x16       2   1   0    13     0      10   1    14   14   NIF  Y
TenGigabitEthernet1/0/15  0x17       2   1   0    14     0      9    2    15   15   NIF  Y
TenGigabitEthernet1/0/16  0x18       2   1   0    15     0      8    3    16   16   NIF  Y
TenGigabitEthernet1/0/17  0x19       2   1   0    16     0      7    4    17   17   NIF  Y
TenGigabitEthernet1/0/18  0x1a       2   1   0    17     0      6    5    18   18   NIF  Y
TenGigabitEthernet1/0/19  0x1b       2   1   0    18     0      5    6    19   19   NIF  Y
TenGigabitEthernet1/0/20  0x1c       2   1   0    19     0      4    7    20   20   NIF  Y
TenGigabitEthernet1/0/21  0x1d       2   1   0    20     0      3    8    21   21   NIF  Y
TenGigabitEthernet1/0/22  0x1e       2   1   0    21     0      2    9    22   22   NIF  Y
TenGigabitEthernet1/0/23  0x1f       2   1   0    22     0      1    10   23   23   NIF  Y
TenGigabitEthernet1/0/24  0x20       2   1   0    23     0      0    11   24   24   NIF  Y
TenGigabitEthernet1/0/25  0x21       1   0   1    24     0      11   0    25   25   NIF  Y
TenGigabitEthernet1/0/26  0x22       1   0   1    25     0      10   1    26   26   NIF  Y
TenGigabitEthernet1/0/27  0x23       1   0   1    26     0      9    2    27   27   NIF  Y
TenGigabitEthernet1/0/28  0x24       1   0   1    27     0      8    3    28   28   NIF  Y
TenGigabitEthernet1/0/29  0x25       1   0   1    28     0      7    4    29   29   NIF  Y
TenGigabitEthernet1/0/30  0x26       1   0   1    29     0      6    5    30   30   NIF  Y
TenGigabitEthernet1/0/31  0x27       1   0   1    30     0      5    6    31   31   NIF  Y
TenGigabitEthernet1/0/32  0x28       1   0   1    31     0      4    7    32   32   NIF  Y
TenGigabitEthernet1/0/33  0x29       1   0   1    32     0      3    8    33   33   NIF  Y
TenGigabitEthernet1/0/34  0x2a       1   0   1    33     0      2    9    34   34   NIF  Y
TenGigabitEthernet1/0/35  0x2b       1   0   1    34     0      1    10   35   35   NIF  Y
TenGigabitEthernet1/0/36  0x2c       1   0   1    35     0      0    11   36   36   NIF  Y
TenGigabitEthernet1/0/37  0x2d       0   0   0    36     0      11   11   37   37   NIF  Y
TenGigabitEthernet1/0/38  0x2e       0   0   0    37     0      10   10   38   38   NIF  Y
TenGigabitEthernet1/0/39  0x2f       0   0   0    38     0      9    9    39   39   NIF  Y
TenGigabitEthernet1/0/40  0x30       0   0   0    39     0      8    8    40   40   NIF  Y
TenGigabitEthernet1/1/1   0x31       0   0   0    40     0      0    19   41   41   NIF  N
TenGigabitEthernet1/1/2   0x32       0   0   0    41     0      0    18   42   42   NIF  N
TenGigabitEthernet1/1/3   0x33       0   0   0    42     0      0    17   43   43   NIF  N
TenGigabitEthernet1/1/4   0x34       0   0   0    43     0      0    16   44   44   NIF  N
TenGigabitEthernet1/1/5   0x35       0   0   0    44     0      0    15   45   45   NIF  N
TenGigabitEthernet1/1/6   0x36       0   0   0    45     0      0    14   46   46   NIF  N
TenGigabitEthernet1/1/7   0x37       0   0   0    46     0      0    13   47   47   NIF  N
TenGigabitEthernet1/1/8   0x38       0   0   0    47     0      0    12   48   48   NIF  N
FortyGigabitEthernet1/1/1 0x39       0   0   0    48     0      4    4    49   49   NIF  N
FortyGigabitEthernet1/1/2 0x3a       0   0   0    49     0      0    0    50   50   NIF  N
缓冲分配
缓冲区分配是避免输出丢弃的一个重要因素,因为缓冲区用于临时存储因拥塞或其他变量而无法转发的流量。如果没有足够的可用缓冲区,流量就会被丢弃,从而导致网络性能下降和潜在的中断。通过此验证,您可以确保交换机有足够的缓冲区空间来处理高流量负载。
使用show platform hardware fed switch active qos queue stats interface <interface>命令可以查看接口上的每个队列统计信息,包括排队到缓冲区中的字节数量,以及由于缺少可用缓冲区而丢弃的字节数量。
在本例中:
- 队列0到4当前保存已排队的流量。在此接口上接收的流量会临时存储在缓冲区中,直到可以传输。
- 只有队列2遇到丢弃或丢弃的流量(24010607字节)。
Cat9k#show platform hardware fed active qos queue stats interface twentyFiveGigE 1/0/41
----------------------------------------------------------------------------------------------
AQM Global counters
GlobalHardLimit: 16257   |   GlobalHardBufCount: 0
GlobalSoftLimit: 39039   |   GlobalSoftBufCount: 0

----------------------------------------------------------------------------------------------
High Watermark Soft Buffers:  Port Monitor Disabled
----------------------------------------------------------------------------------------------
Asic:0 Core:0 DATA Port:8 Hardware Enqueue Counters
----------------------------------------------------------------------------------------------
 Q Buffers          Enqueue-TH0          Enqueue-TH1          Enqueue-TH2             Qpolicer
   (Count)              (Bytes)              (Bytes)              (Bytes)              (Bytes)
-- ------- -------------------- -------------------- -------------------- --------------------
 0       0                    0             40588200              9368282                    0
 1       0                    0             23584521               789524                    0
 2       0                    0                    0         110307150901                    0
 3       0                    0                    0            487852543                    0
 4       0                    0                    0              5483512                    0
 5       0                    0                    0                    0                    0
 6       0                    0                    0                    0                    0
 7       0                    0                    0                    0
Asic:0 Core:0 DATA Port:8 Hardware Drop Counters
--------------------------------------------------------------------------------------------------------------------------------
 Q             Drop-TH0             Drop-TH1             Drop-TH2             SBufDrop              QebDrop         QpolicerDrop
                (Bytes)              (Bytes)              (Bytes)              (Bytes)              (Bytes)              (Bytes)
-- -------------------- -------------------- -------------------- -------------------- -------------------- --------------------
 0                    0                    0                    0                    0                    0                    0
 1                    0                    0                    0                    0                    0                    0
 2                    0                    0             24010607 <-- (drops on Q2)  0                    0                    0
 3                    0                    0                    0                    0                    0                    0
 4                    0                    0                    0                    0                    0                    0
 5                    0                    0                    0                    0                    0                    0
 6                    0                    0                    0                    0                    0                    0
 7                    0                    0                    0                    0                    0                    0
故障排除
修改缓冲区分配
要增加接口使用的软缓冲区的值,请在全局配置模式下使用qos queue-softmax-multipliercommand指定范围为100到4800的值。默认值为 100。
- 此命令可提高单个端口队列吸收微爆发的能力。
- 此命令会增加端口队列阈值,以便端口队列可以占用共享池中的更多缓冲单元。
此配置适用于所有接口:
- 缓冲区分配本身假设交换机上的所有端口不会同时发生微爆发。
- 如果微爆发发生在随机时刻,则共享缓冲区可以专门提供额外的缓冲区单元来吸收它们。
在全局配置模式下使用qos queue-softmax-multiplier<100 4800>命令修改软缓冲区分配。如果将此值配置为可用的最大值,则可为交换机提供消除或减少输出丢弃的最大可能性。这是普遍推荐的最佳实践,可尽可能避免丢弃。
Cat9k(config)#qos queue-softmax-multiplier ?
<100-4800> multiplier(%)
使用show platform hardware fed active qos queue config interface <interface>命令确定Catalyst 9000系列上的软缓冲区分配。
此示例显示分配在Catalyst 9500上已协商为10Gbps速度的接口上的默认软缓冲区。
Cat9k#show platform hardware fed active qos queue config interface twentyFiveGigE 1/0/41
Asic:0 Core:0 DATA Port:8 GPN:141 LinkSpeed:0x12
AFD:Disabled FlatAFD:Disabled QoSMap:0 HW Queues: 64 - 71
  DrainFast:Disabled PortSoftStart:5 - 4320 BufferSharing:Disabled
   DTS  Hardmax  Softmax   PortSMin  GlblSMin  PortStEnd   QEnable
  ----- --------  --------  --------  --------  ---------  -------
 0   1  6   480   8  1920  16   960   0     0   3  5760      En <-- 1920 is the total soft buffers allocated to queue 0 on interface twentyFiveGigE 1/0/41
 1   1  5     0  11  2880  16  1440   8   720   3  5760      En <-- 2880 is the total soft buffers allocated to queue 1 on interface twentyFiveGigE 1/0/41
 2   1  5     0   6     0   0     0   0     0   3  5760      En
 3   1  5     0   6     0   0     0   0     0   3  5760      En
 4   1  5     0   6     0   0     0   0     0   3  5760      En
 5   1  5     0   6     0   0     0   0     0   3  5760      En
 6   1  5     0   6     0   0     0   0     0   3  5760      En
 7   1  5     0   6     0   0     0   0     0   3  5760      En
 Priority   Shaped/shared   weight  shaping_step  sharpedWeight
 --------   -------------   ------  ------------   -------------
 0      0     Shared            50           0           0
 1      0     Shared            75           0           0
 2      0     Shared         10000           0           0
 3      0     Shared         10000           0           0
 4      0     Shared         10000           0           0
 5      0     Shared         10000           0           0
 6      0     Shared         10000           0           0
 7      0     Shared         10000           0           0
 Port       Port            Port    Port
 Priority   Shaped/shared   weight  shaping_step
 --------   -------------   ------  ------------
        2     Shaped          1023        1023
  QPolicer     Refresh Credit   Max Credit  Interval Idx
 -----------   --------------   ----------  ------------
 0 Disabled                 0            0           0
 1 Disabled                 0            0           0
 2 Disabled                 0            0           0
 3 Disabled                 0            0           0
 4 Disabled                 0            0           0
 5 Disabled                 0            0           0
 6 Disabled                 0            0           0
 7 Disabled                 0            0           0

   Weight0 Max_Th0 Min_Th0 Weigth1 Max_Th1 Min_Th1  Weight2 Max_Th2 Min_Th2
   ------- ------- ------- ------- ------- -------  ------- ------- ------
 0       0    1912       0       0    2137       0       0    2400       0 <-- Thresholds values in queue 0 on interface twentyFiveGigE 1/0/41
 1       0    2295       0       0    2565       0       0    2880       0 <-- Thresholds values in queue 1 on interface twentyFiveGigE 1/0/41
 2       0       0       0       0       0       0       0       0       0
 3       0       0       0       0       0       0       0       0       0
 4       0       0       0       0       0       0       0       0       0
 5       0       0       0       0       0       0       0       0       0
 6       0       0       0       0       0       0       0       0       0
 7       0       0       0       0       0       0       0       0       0
此示例显示已配置了4800倍数的Catalyst 9500上协商为10Gbps速度的接口上分配的软缓冲区。
Cat9k#show platform hardware fed active qos queue config interface twentyFiveGigE 1/0/41
Asic:0 Core:0 DATA Port:8 GPN:141 LinkSpeed:0x12
AFD:Disabled FlatAFD:Disabled QoSMap:0 HW Queues: 64 - 71
  DrainFast:Disabled PortSoftStart:4 - 42000 BufferSharing:Disabled
   DTS  Hardmax  Softmax   PortSMin  GlblSMin  PortStEnd   QEnable
  ----- --------  --------  --------  --------  ---------  -------
 0   1  6   480  10 42000   1  1312   0     0   4 42000      En <-- 42000 is the total soft buffers allocated to queue 0 on interface twentyFiveGigE 1/0/41
 1   1  5     0  10 42000   1  1312   1  1312   4 42000      En <-- 42000 is the total soft buffers allocated to queue 1 on interface twentyFiveGigE 1/0/41
 2   1  5     0   6     0   0     0   0     0   4 42000      En
 3   1  5     0   6     0   0     0   0     0   4 42000      En
 4   1  5     0   6     0   0     0   0     0   4 42000      En
 5   1  5     0   6     0   0     0   0     0   4 42000      En
 6   1  5     0   6     0   0     0   0     0   4 42000      En
 7   1  5     0   6     0   0     0   0     0   4 42000      En
 Priority   Shaped/shared   weight  shaping_step  sharpedWeight
 --------   -------------   ------  ------------   -------------
 0      0     Shared            50           0           0
 1      0     Shared            75           0           0
 2      0     Shared         10000           0           0
 3      0     Shared         10000           0           0
 4      0     Shared         10000           0           0
 5      0     Shared         10000           0           0
 6      0     Shared         10000           0           0
 7      0     Shared         10000           0           0
 Port       Port            Port    Port
 Priority   Shaped/shared   weight  shaping_step
 --------   -------------   ------  ------------
        2     Shaped          1023        1023
  QPolicer     Refresh Credit   Max Credit  Interval Idx
 -----------   --------------   ----------  ------------
 0 Disabled                 0            0           0
 1 Disabled                 0            0           0
 2 Disabled                 0            0           0
 3 Disabled                 0            0           0
 4 Disabled                 0            0           0
 5 Disabled                 0            0           0
 6 Disabled                 0            0           0
 7 Disabled                 0            0           0

   Weight0 Max_Th0 Min_Th0 Weigth1 Max_Th1 Min_Th1  Weight2 Max_Th2 Min_Th2
   ------- ------- ------- ------- ------- -------  ------- ------- ------
 0       0   33851       0       0   37833       0       0   42480       0 <-- Thresholds values in queue 0 on interface twentyFiveGigE 1/0/41
 1       0   33468       0       0   37406       0       0   42000       0 <-- Thresholds values in queue 1 on interface twentyFiveGigE 1/0/41
 2       0       0       0       0       0       0       0       0       0
 3       0       0       0       0       0       0       0       0       0
 4       0       0       0       0       0       0       0       0       0
 5       0       0       0       0       0       0       0       0       0
 6       0       0       0       0       0       0       0       0       0
7 0 0 0 0 0 0 0 0 0注意:软缓冲区的分配不尽相同。分配可能与以上输出不匹配。分配输出有所不同,具体取决于所用的特定平台、应用的QoS策略以及所讨论接口的协商运行速度。
修改每队列缓冲区
在无法使用SoftMax乘数的情况下或者尝试微调缓冲区以适应流量量变曲线的情况下,可以使用每队列缓冲区修改。
- 要按接口修改交换机上的队列缓冲区分配,必须使用策略映射。
- 在大多数情况下,可以修改接口的当前策略映射并根据类更改缓冲区。
在本示例接口中,twentyFiveGigE 1/0/1出现输出丢弃。如应用到此接口的命令输出出口policy-map所示。
使用show platform hardware fed switch active qos queue stats interface <interface>命令可以查看接口上的每个队列统计信息,包括排队到缓冲区中的字节数以及由于缺少可用缓冲区而丢弃的字节数。
Cat9k#show platform hardware fed active qos queue stats interface twentyFiveGigE 1/0/1
----------------------------------------------------------------------------------------------
AQM Global counters
GlobalHardLimit: 16257   |   GlobalHardBufCount: 0
GlobalSoftLimit: 39039   |   GlobalSoftBufCount: 0

----------------------------------------------------------------------------------------------
High Watermark Soft Buffers:  Port Monitor Disabled
----------------------------------------------------------------------------------------------
Asic:0 Core:0 DATA Port:8 Hardware Enqueue Counters
----------------------------------------------------------------------------------------------
 Q Buffers          Enqueue-TH0          Enqueue-TH1          Enqueue-TH2             Qpolicer
   (Count)              (Bytes)              (Bytes)              (Bytes)              (Bytes)
-- ------- -------------------- -------------------- -------------------- --------------------
 0       0                    0                    0                   82                    0
 1       0                    0                    0                 7517                    0
 2       0                    0                    0         110307150901                    0
 3       0                    0                    0           7174010710                    0
 4       0                    0                    0                    0                    0
 5       0                    0                    0                    0                    0
 6       0                    0                    0                    0                    0
 7       0                    0                    0                    0
Asic:0 Core:0 DATA Port:8 Hardware Drop Counters
--------------------------------------------------------------------------------------------------------------------------------
 Q             Drop-TH0             Drop-TH1             Drop-TH2             SBufDrop              QebDrop         QpolicerDrop
                (Bytes)              (Bytes)              (Bytes)              (Bytes)              (Bytes)              (Bytes)
-- -------------------- -------------------- -------------------- -------------------- -------------------- --------------------
 0                    0                    0                    0                    0                    0                    0
 1                    0                    0                    0                    0                    0                    0
 2                    0                    0             24010607                    0                    0                    0
 3                    0                    0             20071103                    0                    0                    0
 4                    0                    0                    0                    0                    0                    0
 5                    0                    0                    0                    0                    0                    0
 6                    0                    0                    0                    0                    0                    0
7 0 0 0 0 0 0 为了缓解此接口上的输出丢弃,根据入队计数器,Q0到Q1的入队速率非常低,因此不需要像Q2和Q3那么多的缓冲区。建议的操作是将更多缓冲区分配给队列2和队列3,因为与任何其他队列相比,这些队列具有更高的入队流量。
- 要修改缓冲区分配,可以在应用于接口twentyFiveGigE 1/0/1的策略映射中使用queue-buffers ratio <0-100>配置。

注意:如果在策略中的每个类上配置此命令,则最多必须为100。但是,如果只配置了一个类,则系统将从其他队列中平均减去缓冲区。
本示例显示如何在策略映射上配置queue-buffers ratio。
Cat9k(config)#policy-map test
Cat9k(config-pmap)# class Voice
Cat9k(config-pmap-c)# priority level 1
Cat9k(config-pmap-c)# queue-buffers ratio 5
Cat9k(config-pmap-c)# class Video
Cat9k(config-pmap-c)# bandwidth remaining percent 50
Cat9k(config-pmap-c)# queue-buffers ratio 15
Cat9k(config-pmap-c)# class BuisnessCritical
Cat9k(config-pmap-c)# bandwidth remaining percent 30
Cat9k(config-pmap-c)# queue-buffers ratio 40           <-- Queue 3
Cat9k(config-pmap-c)# class class-default
Cat9k(config-pmap-c)# bandwidth remaining percent 20
Cat9k(config-pmap-c)# queue-buffers ratio 40           <-- Queue 4
从Cisco IOS XE 17.2.1版本中,基于UADP 3.0(Catalyst 9500高性能和Catalyst 9600)的交换机可以配置为在同一ASIC内的两个核心之间共享活动队列管理(AQM)缓冲。
- 配置有缓冲区共享的端口使用任何可用的AQM缓冲区,而不管AQM缓冲区映射到哪个核心。这有助于管理将饱和单个AQM核心的缓冲区的更高突发流量。
- 您可以在全局配置模式下使用qos share-buffer命令启用此功能。
- 您可以使用show platform hardware fed active qos queue config interface命令检查该功能。这是影响整个系统的全局配置。
您可以使用命令的no形式no qos share-buffer禁用缓冲区共享。
Cat9k(config)#qos share-buffer
Cat9k(config)#end
使用Wireshark分析输出丢包
要验证网络中是否存在微爆发,您可以使用数据包捕获工具(如Wireshark):
- Wireshark可捕获数据包,并允许您实时或捕获后分析网络流量。
-
要确定Wireshark出现丢弃时会发生哪些微爆发,请在受影响的接口上开始数据包捕获,并反复检查接口,直到出现输出丢弃。
- 捕获完成后,在Wireshark中打开捕获文件,查找流量高的时段以及流量低或没有流量的时段。这些可能是微爆发。
要有效地捕获和分析接口上的输出丢弃,请使用以下建议:
- 不得使用EPC(嵌入式数据包捕获)。EPC将所有流量限制为最多每秒1000个数据包(pps),这可能会使数据失效。
- 建议使用标识输出丢弃的接口的仅TX SPAN方法。
- 使用SPAN时,源端口和目的端口必须具有相同的速度,或者目的端口必须比源端口具有更高的速度。这可确保SPAN会话不会因端口速度不匹配而造成额外的网络拥塞或丢包。
- 当输出丢弃正在主动增加时,收集SPAN会话非常重要。这可确保您捕获相关流量并识别微突发的根本原因。如果在丢弃发生后收集SPAN会话,则无法捕获相关流量。
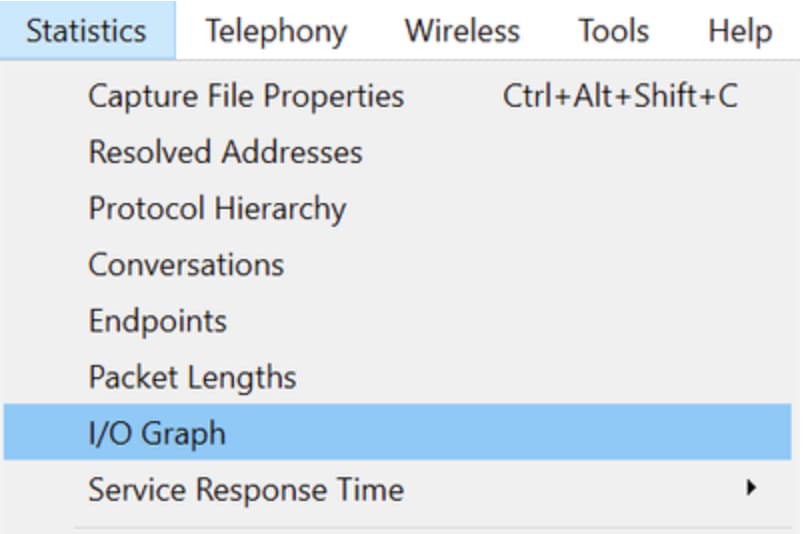
要确认这些高流量时段是否确实是微爆发,请使用Wireshark I/O图形功能。由于I/O图形显示随时间变化的网络流量的图形表示,因此更易于识别微爆发。要创建I/O图形,请转至统计信息> I/O图形:
注意:为了演示此过程,我们使用在1 Gbps接口上捕获的数据包。但是,排除任何高速接口上的输出丢弃故障时的步骤相同。
图2.选择I/O图形。
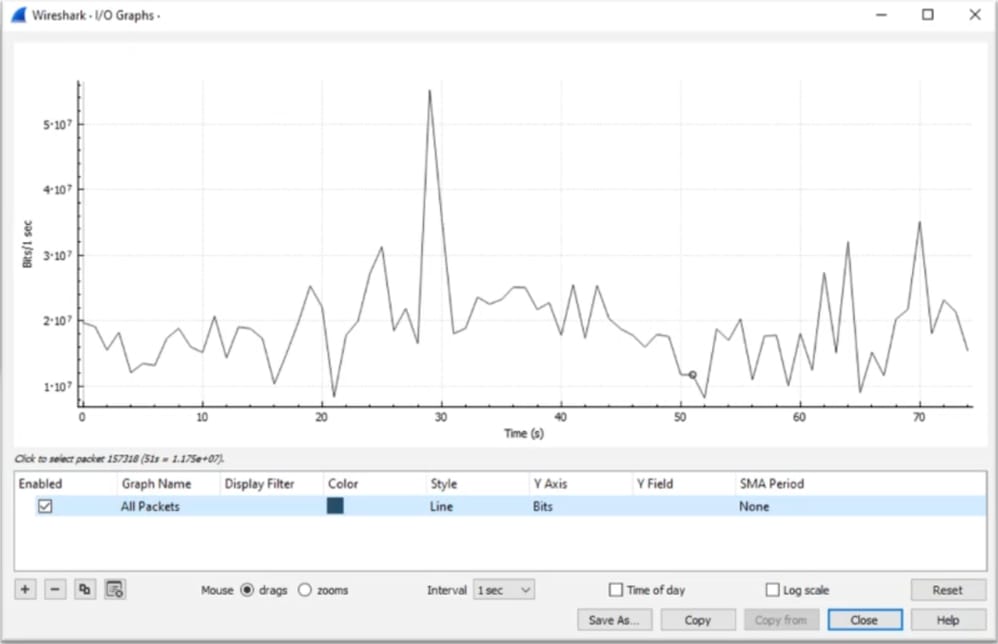
下图显示一条线,表示一段时间内传输的数据量。查找图中的峰值,指示高流量时段。如果在这些峰值之后是流量较低或没有流量的时段,则您可能已经识别出微爆发。
图3.显示数据包捕获的I/O图。
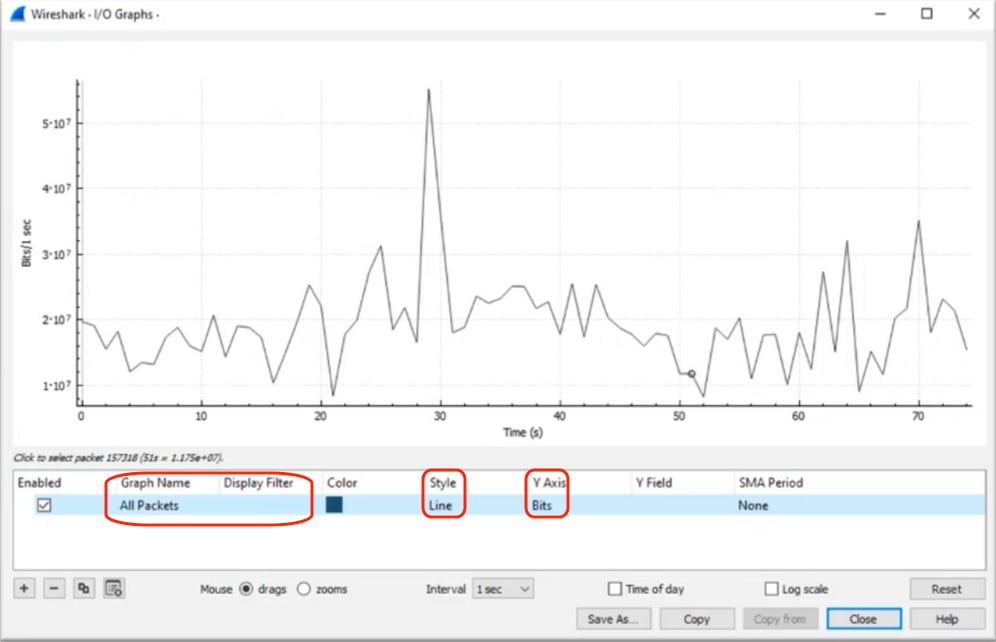
必须确保选择所有数据包而不应用显示过滤器。此外,选择Line Graph选项,并将Y轴设置为Bits,以正确分析流量。
图4.显示如何选择Line Graph选项并将Y轴设置为Bits。
当您分析大型数据包捕获时,确定您感兴趣的特定时间段至关重要。例如,在此场景中,可以观察到30秒附近存在大量流量。
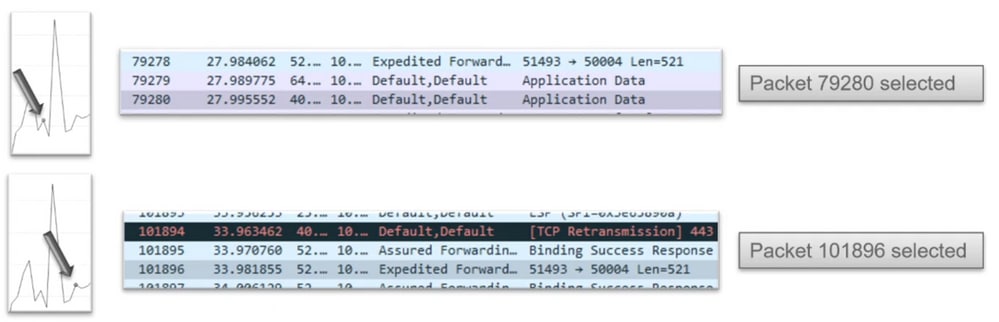
点击I/O图中峰值的峰值会导致Wireshark在后台选择该数据包。在我们的场景中,选择数据包79280和101896以创建数据包捕获的一个子集,以便在怀疑存在微爆发的时间戳内工作。
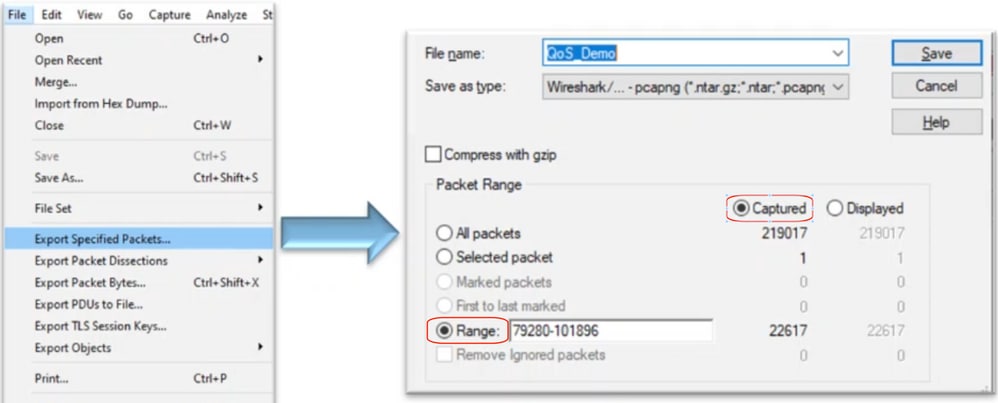
图5.显示如何创建数据包捕获的一个子集,该子集侧重于可疑的微突发状态时间戳。
要将选定的第一个和最后一个数据包导出到新文件,请确保选择Range和Captured单选按钮。
图6.显示如何导出和保存数据包捕获的子集。
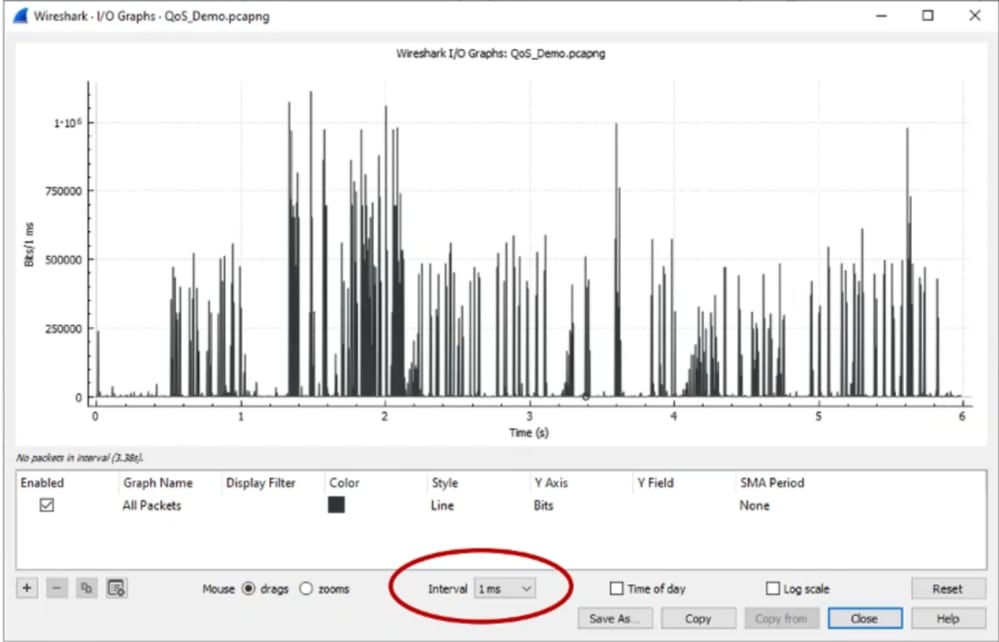
保存文件后,将其打开并导航回I/O图形。确保间隔设置为1ms,以绘制以毫秒为单位看到的峰值。
图7.显示数据包捕获的导出子集的I/O图。
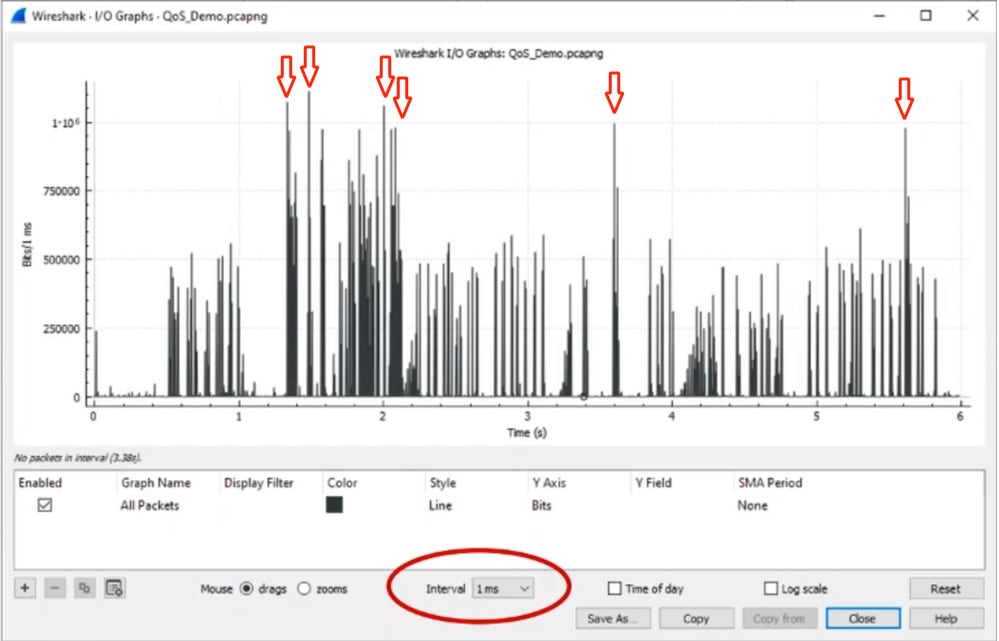
在显示图形时,重要的是要标识代表以线速传输整毫秒流量的时段的峰值,这会导致缓冲区被填满,并且可能会在何处生成输出丢弃。例如,在1 Gbps接口上,这相当于每毫秒1,000,000位。
点击代表潜在微爆的峰值点。它有助于识别导致输出丢弃的数据包。然后可以进一步分析此数据包,以确定微突发的根本原因并采取纠正措施。
图8.显示如何识别I/O图中的潜在微爆发流量。

警告:在高速接口上使用Wireshark或任何其他数据包捕获工具时,必须注意这一限制。高速接口(如40G和100G)会生成大量网络流量,这可能会占用系统用于捕获数据包的资源。因此,这可能会导致数据包在捕获过程中被丢弃,并可能影响捕获数据的准确性和完整性。
替代方法
如果已经耗尽分配给队列的资源并且仍然遇到丢弃,则需要考虑其他选项来管理拥塞。这些包括:
- 升级接口速度。您可以从1G移动到10G、从10G移动到25G或40G,以增加出口带宽并减少超订用率。
- 将平台更改为具有更大的每个队列/每个接口缓冲区的平台。
- 调整应用设置以减小导致输出丢弃的突发的大小。
- 使用排队调度程序优先一类流量优先于另一类流量。此方法优先保护更重要的流量,而对于不太重要的流量则以丢弃增加为代价。
- 实施拥塞管理算法(如加权随机早期丢弃(WRED)或加权尾部丢弃(WTD)),以便更早丢弃流量。WRED或WTD阈值可能导致突发流量较早的下降,从而自动缩短终端客户端的传输窗口。这允许其他突发性较小的流量遇到拥塞减少的情况,从而确保在高拥塞期间为不同流量类别分配最小的缓冲区。
- 管制离已知高带宽应用源最近的流量(例如数据备份),以减少网络中突发的频率和严重性。这样,位于网络其他位置的源和目标之间的低带宽区域就有了更多机会有效地管理突发流量和正常网络流量。
- 使用Port-channel。但是,必须注意的是,由于散列,可能会有多个流定向到单个成员,这可能会导致持续丢弃。
需要注意的是,其中一些选项需要更多涉及的配置(例如流量工程),但可以显着缓解网络拥塞和输出丢弃。
相关信息
修订历史记录
| 版本 | 发布日期 | 备注 |
|---|---|---|
3.0 |
12-Aug-2025
|
初始版本、缩写标题、修改的Alt Text和作出风格上的更改。在故障排除说明中添加了步骤。 |
2.0 |
15-Jul-2024
|
初始版本、缩写标题、修改的Alt Text和作出风格上的更改。 |
1.0 |
07-Jun-2023
|
初始版本 |
由思科工程师提供
- 莱昂纳多·佩纳·达维拉
- 安布罗斯·泰勒
- 克里斯·加布里埃尔森
 反馈
反馈