WAAS - NFS AO故障排除
章节:排除NFS AO故障
本文介绍如何排除NFS AO故障。
主要文章
了解WAAS架构和流量
初步WAAS故障排除
故障排除优化
应用加速故障排除
排除CIFS AO故障
排除HTTP AO故障
排除EPM AO故障
排除MAPI AO故障
排除NFS AO故障
SSL AO故障排除
视频AO故障排除
排除通用AO故障
排除过载情况故障
排除WCCP故障
AppNav故障排除
排除磁盘和硬件故障
串行内联集群故障排除
vWAAS故障排除
排除WAAS Express故障
排除NAM集成故障
目录
NFS加速器故障排除
NFS加速器可优化NFSv3流量。其他NFS版本未由NFS AO优化。
您可以使用show accelerator和show license命令验证常规AO配置和状态,如排除应用加速故障文章中所述。NFS加速器操作需要企业许可证。
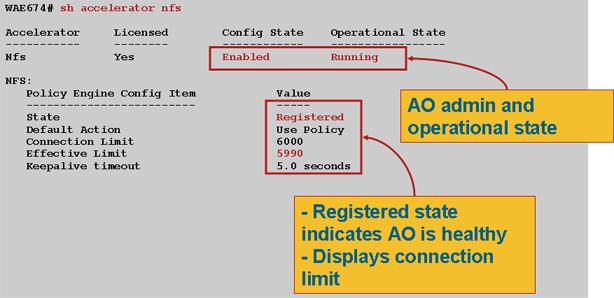
接下来,使用show accelerator nfs命令验证特定于NFS AO的状态,如图1所示。您希望看到NFS AO已启用、运行和注册,并且显示连接限制。如果配置状态为启用,但操作状态为关闭,则表示许可问题。
- 图1.检验NFS加速器状态
使用show running-config命令验证NFS流量策略是否已正确配置。您希望看到文件系统应用程序分类器NFS操作的加速nfs ,并且希望看到为NFS分类器列出的适当匹配条件,如下所示:
WAE674# sh run | include NFS
      name File-System classifier NFS action optimize full accelerate nfs       <-------------
WAE674# sh run | begin NFS
...skipping
   classifier NFS
      match dst port eq 2049                                                    <-------------
   exit
使用show statistics connection optimized nfs命令检查WAAS设备是否正在建立优化的NFS连接。验证NFS连接的Accel列中是否显示“N”,这表示已使用NFS AO。
WAE674# sh stat conn opt nfs
D:DRE,L:LZ,T:TCP Optimization,
C:CIFS,E:EPM,G:GENERIC,H:HTTP,M:MAPI,N:NFS,S:SSL,V:VIDEO,

ConnID  Local IP:Port         Remote IP:Port        PeerID             Accelerator
582     10.56.94.101:33606    10.56.94.80:2049      0:1a:64:d3:2f:b8   NTDL         <-----Look for "N"
使用show statistics accelerator nfs命令验证以下内容:
- NFS流量是NFSv3。查看Total RPC Calls per NFS Version(每NFS版本的RPC调用总数)字段。该字段的输出是一个包含5个值的数组,您希望看到大部分NFSv3流量,该流量在第4个计数器中报告。其他阵列位置的高数字表示其他NFS版本。
- NFS流量未加密。查看Total RPC Calls per Authentication Flavor字段。该字段的输出是一个包含4个值的数组,您希望看到大多数未加密的流量,这对应于前3个计数器。最后一个计数器中的高数字表示加密的NFS流量。另请选中Total RPC Calls with Unknown Authentication Flavor字段,在该字段中,您希望看到0或小数,因为这些连接未优化。
- NFS连接是异步的。验证Percentage of Requests Served Locally(本地服务的请求百分比)字段是否为非零。
WAE# sh statistics accelerator nfs

NFS:
  Global Statistics
  -----------------
  Time Accelerator was started:                                      Fri Oct 23
16:40:06 2009
  Time Statistics were Last Reset/Cleared:                           Fri Oct 23
16:40:06 2009
  Total Handled Connections:                                         170
  Total Optimized Connections:                                       170
  Total Connections Handed-off with Compression Policies Unchanged:  0
  Total Dropped Connections:                                         0
  Current Active Connections:                                        0
  Current Pending Connections:                                       0
  Maximum Active Connections:                                        13
  Total RPC Calls per Authentication Flavor:                         65
298544    0         0                                                          <----Should see 0 or few in last field
  Total RPC Calls with Unknown Authentication Flavor:                0         <----Should see 0 or few
  Total RPC Calls per NFS Version:                                   0
0         0         298609    0                                                <----Should see 0 or few in first two and last fields
  Total RPC Calls with Unknown NFS Version:                          0         <----Should see 0 or few
  Total Requests:                                                    298609
  Total Local Replies:                                               191713
  Percentage of Requests Served Locally:                             64        <----Should be nonzero
  Percentage of Requests Served Remotely:                            36
  Average Time to Generate Local READ Reply (ms):                    15
  Average Time to Generate Local WRITE Reply (ms):                   0
  Average Time to Generate Local GETATTR Reply (ms):                 0
  Average Time to Generate Local Reply (ms):                         0
  Average Time to Receive Remote Reply (ms):                         10
  Meta-Data Cache Access Count:                                      206017
  Meta-Data Cache Hit Count:                                         191673
  Remaining Number Of Entries in Meta-Data Cache:                    128926
  Meta-Data Cache Hit Ratio:                                         93
您可以使用show statistics connection optimized nfs detail命令查看NFS连接统计信息,如下所示:
WAE674# show stat conn opt nfs detail
Connection Id:            1916
   Peer Id:                  00:14:5e:84:24:5f
   Connection Type:          EXTERNAL CLIENT
   Start Time:               Thu Jun 25 07:09:09 2009
   Source IP Address:        10.10.10.20
   Source Port Number:       928
   Destination IP Address:   10.10.100.102
   Destination Port Number:  2049
   Application Name:         File-System                                  <-----Should see File-System
   Classifier Name:          NFS                                          <-----Should see NFS
   Map Name:                 basic
   Directed Mode:            FALSE
   Preposition Flow:         FALSE
   Policy Details:
          Configured:        TCP_OPTIMIZE + DRE + LZ
             Derived:        TCP_OPTIMIZE + DRE + LZ
                Peer:        TCP_OPTIMIZE + DRE + LZ
          Negotiated:        TCP_OPTIMIZE + DRE + LZ
             Applied:        TCP_OPTIMIZE + DRE + LZ
   Accelerator Details:
               Configured:   NFS                                          <-----Should see NFS configured
                  Derived:   NFS
                  Applied:   NFS                                          <-----Should see NFS applied
                     Hist:   None
                                               Original            Optimized
                                   -------------------- --------------------
   Bytes Read:                                     5120                 4639
   Bytes Written:                                 28136                 1407
. . .

NFS : 1916

   Time Statistics were Last Reset/Cleared:                           Thu Jun 25
 07:09:09 2009
   Total Bytes Read:                                                  5120
28136
   Total Bytes Written:                                               28136
5120
   Bit Flags for I/O state:                                           19
   Histogram of Buffers Read From Local Endpoint:                     31
1         0         0         0
   Total NFS Requests:                                                32
   Total Replies Served Locally:                                      4
   Percentage of Requests Served Locally:                             12
   Percentage of Requests Served Remotely:                            88
   Average Time to Generate Local READ Reply (ms):                    0
   Average Time to Generate Local WRITE Reply (ms):                   0
   Average Time to Generate Local GETATTR Reply (ms):                 0
   Average Time to Generate Local Reply (ms):                         0
   Average Time to Receive Remote Reply (ms):                         103
   Total RPC Procedure Calls:                                         0
9         0         10        7         0         4         1         0
0         0         0         0         0         0         0         0
1         0         0         0         0
. . .

 Total Unknown RPC Procedure Calls:                                    0
  Total Write RPCs Using Stable-how Enumerated Values:               0
0         1
  Total WRITE RPCs with Invalid Stable-how Value:                    0
  Bytes Buffered for READ Purpose:                                   0
  Start Time of Session:                                             Thu Jun 25
07:09:09 2009

  Meta-Data Cache Access Count:                                      9
  Meta-Data Cache Hit Count:                                         4
  Remaining Number Of Entries in Meta-Data Cache:                    1000
  Meta-Data Cache Hit Ratio:                                         44
  Current number of entries in Meta-Data Cache:                      0
. . .
NFS AO日志记录
以下日志文件可用于排除NFS AO问题:
- 事务日志文件:/local1/logs/tfo/working.log(和/local1/logs/tfo/tfo_log_*.txt)
- 调试日志文件:/local1/errorlog/nfsao-errorlog.current(和nfsao-errorlog.*)
为便于调试,您应首先设置ACL,将数据包限制到一台主机。
WAE674(config)# ip access-list extended 150 permit tcp host 10.10.10.10 any
WAE674(config)# ip access-list extended 150 permit tcp any host 10.10.10.10
要启用事务记录,请按如下方式使用transaction-logs配置命令:
wae(config)# transaction-logs flow enable
wae(config)# transaction-logs flow access-list 150
可以使用type-tail命令查看事务日志文件的结尾。
要设置并启用NFS AO的调试日志记录,请使用以下命令。
NOTE:调试日志记录占用大量CPU资源,并且可以生成大量输出。在生产环境中谨慎、谨慎地使用它。
您可以按如下方式启用详细的日志记录到磁盘:
WAE674(config)# logging disk enable
WAE674(config)# logging disk priority detail
您可以为ACL中的连接启用调试日志记录,如下所示:
WAE674# debug connection access-list 150
NFS AO调试的选项如下:
WAE674# debug accelerator nfs ?
  all               enable all accelerator debugs
  async-write       enable async write optimization debugs
  attributes-cache  enable attributes-cache optimization debugs
  nfs-v3            enable NFSv3 layer debugs
  read-ahead        enable read ahead optimization debugs
  rpc               enable RPC layer debugs
  shell             enable shell (infra) debugs
  utils             enable utils debugs
您可以为NFS连接启用调试日志记录,然后显示调试错误日志的结尾,如下所示:
WAE674# debug accelerator nfs all
WAE674# type-tail errorlog/nfsao-errorlog.current follow
 反馈
反馈