Begrijp Nexus 9000 TAHUSD-buffersyslog en congestie
Inhoud
Inleiding
Dit document beschrijft wachtrijen en bufferen op switches uit de Cisco Nexus 9000-serie die zijn uitgerust met een Cisco Scale ASIC waarop NX-OS-software wordt uitgevoerd.
Voorwaarden
Vereisten
Cisco raadt u aan de basisprincipes van Ethernet-switching op gedeelde mediumnetwerken en de noodzaak van wachtrijen / buffering in deze netwerken te begrijpen. Cisco raadt u ook aan de basisprincipes van Quality of Service (QoS) en buffering op Cisco Nexus-switches te begrijpen. Raadpleeg de documentatie voor meer informatie:
- Cisco Nexus 9000 Series NX-OS Quality of Service Configuration Guide, versie 10.1(x)
- Cisco Nexus 9000 Series NX-OS Quality of Service Configuration Guide, versie 9.3(x)
- Cisco Nexus 9000 Series NX-OS Quality of Service Configuration Guide, versie 9.2(x)
- Cisco Nexus 9000 Series NX-OS Configuratiegids voor de kwaliteit van de service, release 7.x
Gebruikte componenten
De informatie in dit document is gebaseerd op Cisco Nexus 9000-serie switches met de Cloud Scale ASIC met NX-OS software release 9.3(8).
De procedure in dit document is alleen van toepassing op de volgende Nexus 9200/9300-hardware:
- Nexus 9200/9300 Vaste Switches
- N9K-C92160YC-X
- N9K-C92300YC
- N9K-C92304QC
- N9K-C92348GC-X
- N9K-C9236C
- N9K-C9272Q
- N9K-C9332C
- N9K-C9364C
- N9K-C93108TC-EX
- N9K-C93108TC-EX-24
- N9K-C93180LC-EX
- N9K-C93180YC-EX
- N9K-C93180YC-EX-24
- N9K-C93108TC-FX
- N9K-C93108TC-FX-24
- N9K-C93180YC-FX
- N9K-C93180YC-FX-24
- N9K-C9348GC-FXP
- N9K-C93240YC-FX2
- N9K-C93216TC-FX2
- N9K-C9336C-FX2
- N9K-C9336C-FX2-E
- N9K-C93360YC-FX2
- N9K-C93180YC-FX3
- N9K-C93108TC-FX3P
- N9K-C93180YC-FX3S
- N9K-C9316D-GX
- N9K-C93600CD-GX
- N9K-C9364C-GX
- N9K-C9364D-GX2A
- N9K-C9332D-GX2B
- Nexus 9500 modulaire Switch lijn kaarten
- N9K-X97160YC-EX
- N9K-X9732C-EX
- N9K-X9736C-EX
- N9K-X97284YC-FX
- N9K-X9732C-FX
- N9K-X9788TC-FX
- N9K-X9716D-GX
De informatie in dit document is gebaseerd op de apparaten in een specifieke laboratoriumomgeving. Alle apparaten die in dit document worden beschreven, hadden een opgeschoonde (standaard)configuratie. Als uw netwerk live is, moet u zorgen dat u de potentiële impact van elke opdracht begrijpt.
Achtergrondinformatie
In dit document worden de wachtrijen en buffering beschreven voor Cisco Nexus 9000 Series-switches die zijn uitgerust met Cisco Cloud Scale ASIC met NX-OS-software.
Cisco Nexus 9000 Cloud Scale ASIC Buffering Architecture begrijpen
Cisco Nexus 9000-serie switches met de Cisco Cloud Scale ASIC (Application-Specific Integrated Circuit) implementeren een "shared-memory"-regresbufferarchitectuur. Een ASIC is onderverdeeld in een of meer "plakjes". Elk segment heeft zijn eigen buffer en alleen poorten binnen dat segment kunnen die buffer gebruiken. Fysiek is elke plak verdeeld in "cellen", die delen van de buffer vertegenwoordigen. Segmenten worden verdeeld in "pool-groepen". Een bepaald aantal cellen wordt toegewezen aan elke poolgroep en ze worden niet gedeeld tussen afzonderlijke poolgroepen. Elke pool-groep heeft een of meer "pools", die een klasse van service (CoS) vertegenwoordigen voor unicast- of multicastverkeer. Dit helpt elke pool-groep bufferbronnen te garanderen voor de soorten verkeer die de pool-groep dient.
De afbeelding laat zien hoe verschillende modellen van Cisco Cloud Scale ASIC zijn verdeeld in segmenten. De afbeelding laat ook zien hoe elk segment een bepaalde hoeveelheid buffer toewijst via cellen.
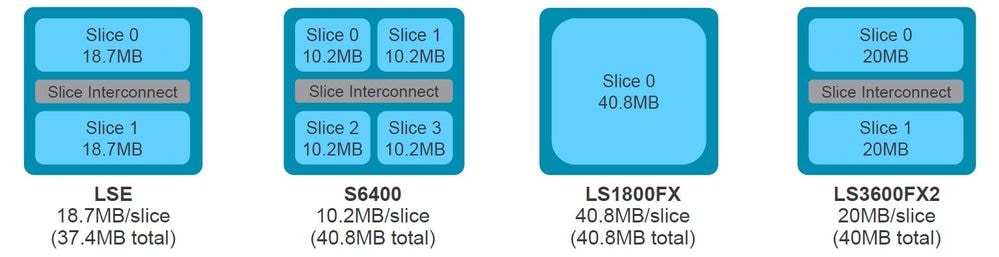
Elk model Nexus 9000 Series-switch en Nexus 9500-lijnkaart heeft een uniek aantal en een unieke lay-out van Cisco Cloud Scale ASIC's die de poort-naar-ASIC-verbindingen op het voorpaneel bepalen. In de afbeelding worden twee voorbeelden getoond die de N9K-X9736C-FX-lijnkaart en de N9K-C9336C-FX2-switch gebruiken.
De N9K-C9736C-FX-lijnkaart heeft 4 Cisco Cloud Scale LS1800FX ASIC's met één slice per ASIC. Intern wordt elke ASIC aangeduid als een "eenheid". Elk segment wordt een "instantie" genoemd en krijgt een op nul gebaseerd geheel getal toegewezen dat dat segment binnen het chassis op unieke wijze identificeert. Dit resulteert in de volgende permutaties:
- Eenheid 0, segment 0 wordt instantie 0 genoemd
- Eenheid 1, segment 0 wordt aangeduid als instantie 1
- Eenheid 2, segment 0 wordt aangeduid als instantie 2
- Eenheid 3, segment 0 wordt aangeduid als instantie 3

De N9K-C9336C-FX2-switch heeft één Cisco Cloud Scale LS3600FX2 ASIC met twee segmenten per ASIC. Intern wordt elke ASIC aangeduid als een "eenheid". Elk segment wordt een "instantie" genoemd en krijgt een op nul gebaseerd geheel getal toegewezen dat dat segment binnen het chassis op unieke wijze identificeert. Dit resulteert in de hier getoonde permutaties:
- Eenheid 0, segment 0 wordt instantie 0 genoemd
- Eenheid 0, segment 1 wordt aangeduid als instantie 1
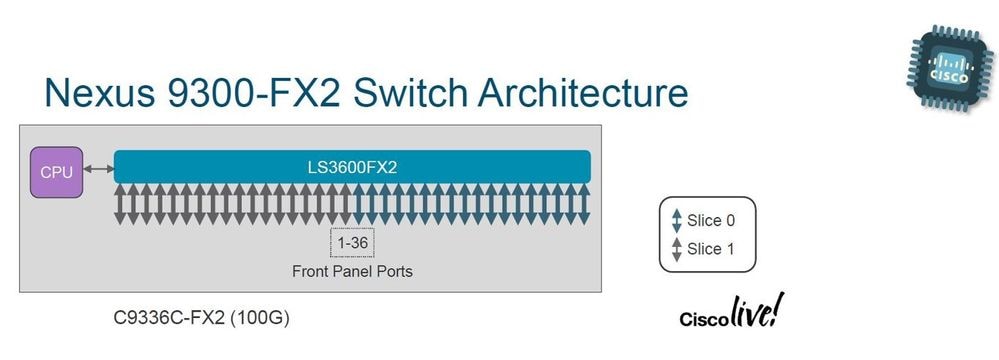
Elke lijnkaart en switch heeft een andere lay-out en resulteert in verschillende instantienummers. Om uw netwerk te ontwerpen rond bandbreedte-intensieve verkeersstromen, moet u de lay-out van de switch of lijnkaart begrijpen om mee te werken. Met de opdracht hardware-toewijzingen voor de interface weergeven kunt u elke poort op het voorpaneel correleren met een eenheid (ASIC) en een segmentnummer. In dit voorbeeld wordt de ethernetinterface 2/16 van een Nexus 9504-switch met een N9K-X9736C-FX-lijnkaart in sleuf 2 van het chassis geplaatst en toegewezen aan eenheid 1, segment 0.
switch# show interface hardware-mappings
Legends:
       SMod  - Source Mod. 0 is N/A
       Unit  - Unit on which port resides. N/A for port channels
       HPort - Hardware Port Number or Hardware Trunk Id:
       HName - Hardware port name. None means N/A
       FPort - Fabric facing port number. 255 means N/A
       NPort - Front panel port number
       VPort - Virtual Port Number. -1 means N/A
       Slice - Slice Number. N/A for BCM systems
       SPort - Port Number wrt Slice. N/A for BCM systems
       SrcId - Source Id Number. N/A for BCM systems
       MacIdx - Mac index. N/A for BCM systems
       MacSubPort - Mac sub port. N/A for BCM systems

-------------------------------------------------------------------------------------------------------
Name       Ifindex  Smod Unit HPort FPort NPort VPort Slice SPort SrcId MacId MacSP VIF  Block BlkSrcID
-------------------------------------------------------------------------------------------------------
Eth2/1     1a080000 5    0    16    255   0     -1    0     16    32    4     0     145  0     32
Eth2/2     1a080200 5    0    12    255   4     -1    0     12    24    3     0     149  0     24
Eth2/3     1a080400 5    0    8     255   8     -1    0     8     16    2     0     153  0     16
Eth2/4     1a080600 5    0    4     255   12    -1    0     4     8     1     0     157  0     8
Eth2/5     1a080800 5    0    0     255   16    -1    0     0     0     0     0     161  0     0
Eth2/6     1a080a00 5    0    56    255   20    -1    0     56    112   14    0     165  1     40
Eth2/7     1a080c00 5    0    52    255   24    -1    0     52    104   13    0     169  1     32
Eth2/8     1a080e00 6    1    16    255   28    -1    0     16    32    4     0     173  0     32
Eth2/9     1a081000 6    1    12    255   32    -1    0     12    24    3     0     177  0     24
Eth2/10    1a081200 6    1    8     255   36    -1    0     8     16    2     0     181  0     16
Eth2/11    1a081400 6    1    4     255   40    -1    0     4     8     1     0     185  0     8
Eth2/12    1a081600 6    1    0     255   44    -1    0     0     0     0     0     189  0     0
Eth2/13    1a081800 6    1    56    255   48    -1    0     56    112   14    0     193  1     40
Eth2/14    1a081a00 6    1    52    255   52    -1    0     52    104   13    0     197  1     32
Eth2/15    1a081c00 7    2    16    255   56    -1    0     16    32    4     0     201  0     32
Eth2/16    1a081e00 7    2    12    255   60    -1    0     12    24    3     0     205  0     24
Eth2/17    1a082000 7    2    8     255   64    -1    0     8     16    2     0     209  0     16
Eth2/18    1a082200 7    2    4     255   68    -1    0     4     8     1     0     213  0     8
Eth2/19    1a082400 7    2    0     255   72    -1    0     0     0     0     0     217  0     0
Eth2/20    1a082600 7    2    56    255   76    -1    0     56    112   14    0     221  1     40
Eth2/21    1a082800 7    2    52    255   80    -1    0     52    104   13    0     225  1     32
Eth2/22    1a082a00 8    3    16    255   84    -1    0     16    32    4     0     229  0     32
Eth2/23    1a082c00 8    3    12    255   88    -1    0     12    24    3     0     233  0     24
Eth2/24    1a082e00 8    3    8     255   92    -1    0     8     16    2     0     237  0     16
Eth2/25    1a083000 8    3    4     255   96    -1    0     4     8     1     0     241  0     8
Eth2/26    1a083200 8    3    0     255   100   -1    0     0     0     0     0     245  0     0
Eth2/27    1a083400 8    3    56    255   104   -1    0     56    112   14    0     249  1     40
Eth2/28    1a083600 8    3    52    255   108   -1    0     52    104   13    0     253  1     32
Eth2/29    1a083800 5    0    48    255   112   -1    0     48    96    12    0     257  1     24
Eth2/30    1a083a00 5    0    44    255   116   -1    0     44    88    11    0     261  1     16
Eth2/31    1a083c00 6    1    48    255   120   -1    0     48    96    12    0     265  1     24
Eth2/32    1a083e00 6    1    44    255   124   -1    0     44    88    11    0     269  1     16
Eth2/33    1a084000 7    2    48    255   128   -1    0     48    96    12    0     273  1     24
Eth2/34    1a084200 7    2    44    255   132   -1    0     44    88    11    0     277  1     16
Eth2/35    1a084400 8    3    48    255   136   -1    0     48    96    12    0     281  1     24
Eth2/36    1a084600 8    3    44    255   140   -1    0     44    88    11    0     285  1     16
Instance ID voor meerdere ASIC's en segmenten berekenen
Bij het interpreteren van de syslog wordt de instantie-ID berekend op basis van de aaneengesloten eenheid- en segmentcombinatievolgorde. Als een Nexus 9500-module of een Nexus 9300 TOR (Top-of-Rack) bijvoorbeeld twee eenheden (ASIC's) en twee segmenten per eenheid heeft, zijn de instantie-ID's:
- Eenheid 0, segment 0 wordt aangeduid als instantie 0
- Eenheid 0, segment 1 wordt aangeduid als instantie 1
- Eenheid 1, segment 0 wordt aangeduid als instantie 2
- Eenheid 1, segment 1 wordt aangeduid als instantie 3
Als een module één eenheid en vier segmenten heeft, zijn de instantie-id's:
- Eenheid 0, segment 0 wordt aangeduid als instantie 0
- Eenheid 0, segment 1 wordt aangeduid als instantie 1
- Eenheid 0, segment 2 wordt aangeduid als instantie 2
- Eenheid 0, segment 3 wordt aangeduid als instantie 3
Inzicht in overinschrijving en teruggooi van uitvoer
Interfaces die op een Ethernet-netwerk zijn aangesloten, kunnen slechts één pakket tegelijk verzenden. Wanneer twee pakketten tegelijkertijd een Ethernet-interface moeten verlaten, verzendt de Ethernet-interface één pakket terwijl het andere pakket wordt gebufferd. Zodra het eerste pakket is verzonden, verzendt de Ethernet-interface het tweede pakket vanuit de buffer. Wanneer de totale som van het verkeer dat moet uitstappen, een interface de interfacebandbreedte overschrijdt, wordt de interface als overtekend beschouwd. Als bijvoorbeeld in totaal 15 Gbps aan verkeer onmiddellijk de switch binnenkomt en een 10 Gbps-interface moet verlaten, wordt de 10 Gbps-interface overtekend omdat deze niet tegelijkertijd 15 Gbps aan verkeer kan verzenden.
Een Cisco Nexus 9000 Series-switch met een Cloud Scale ASIC behandelt deze bronnenbetwisting door verkeer te bufferen binnen de buffers van de ASIC-slice die aan de uitgang-interface zijn gekoppeld. Als de totale hoeveelheid verkeer die een interface moet verlaten de interfacebandbreedte voor een langere periode overschrijdt, beginnen de buffers van de ASIC-slice te vullen met pakketten die de interface moeten verlaten.
Wanneer de buffers van de ASIC-slice 90% gebruik bereiken, genereert de switch een syslog vergelijkbaar met dit voorbeeld:
%TAHUSD-SLOT2-4-BUFFER_THRESHOLD_EXCEEDED: Module 2 Instance 0 Pool-group buffer 90 percent threshold is exceeded!
Wanneer de buffers van de ASIC-slice volledig vol raken, laat de switch extra verkeer vallen dat de interface moet verlaten totdat de ruimte in de buffers vrij wordt. Wanneer de switch dit verkeer laat vallen, verhoogt de switch de waarde van de uitgang voor de afdankteller.
De gegenereerde syslog en niet-nul Output Discards teller zijn beide symptomen van een oversubscribed interface. Elk symptoom wordt nader onderzocht in de subsecties.
De BUFFER_THRESHOLD_OVERSCHREDEN syslog begrijpen
Een voorbeeld van de BUFFER_THRESHOLD_OVERSCHREDEN syslog:
%TAHUSD-SLOTX-4-BUFFER_THRESHOLD_EXCEEDED: Module X Instance Y Pool-group buffer Z percent threshold is exceeded!
Deze syslog bevat drie belangrijke informatie:
- Module X: De sleuf van de lijnkaart die de oversubscribed interface bevat.
- Instantie Y: Het instantienummer dat is toegewezen aan de ASIC- en slice-tuple die de oversubscribed-interface bevatten.
- Groepsbuffer Z: De bufferdrempel van de getroffen groep voordat de syslog wordt gegenereerd. Dit is een percentage afgeleid door de gebruikte cellen gedeeld door de totale cellen zoals waargenomen in de uitvoer van tonen interne buffer info pkt-stats wanneer gekoppeld aan Module X.
Begrijp de output discards interface teller
De interfaceteller voor de uitvoer van Discards geeft het aantal pakketten aan dat is gevallen en dat de interface moet zijn gedegradeerd, maar dat niet is gelukt omdat de ASIC-segmentbuffer vol was en geen nieuwe pakketten kon accepteren. De Output Discards-teller is zichtbaar in de uitvoer van de show-interface en toont fouten in de interfacetellers.
switch# show interface Ethernet1/1
Ethernet1/1 is up
admin state is up, Dedicated Interface
  Hardware: 1000/10000/25000/40000/50000/100000 Ethernet, address: 7cad.4f6d.f6d8 (bia 7cad.4f6d.f6d8)
  MTU 1500 bytes, BW 40000000 Kbit , DLY 10 usec
  reliability 255/255, txload 232/255, rxload 1/255
  Encapsulation ARPA, medium is broadcast
  Port mode is trunk
  full-duplex, 40 Gb/s, media type is 40G
  Beacon is turned off
  Auto-Negotiation is turned on  FEC mode is Auto
  Input flow-control is off, output flow-control is off
  Auto-mdix is turned off
  Rate mode is dedicated
  Switchport monitor is off
  EtherType is 0x8100
  EEE (efficient-ethernet) : n/a
    admin fec state is auto, oper fec state is off
  Last link flapped 03:16:50
  Last clearing of "show interface" counters never
  3 interface resets
  Load-Interval #1: 30 seconds
    30 seconds input rate 0 bits/sec, 0 packets/sec
    30 seconds output rate 36503585488 bits/sec, 3033870 packets/sec
    input rate 0 bps, 0 pps; output rate 36.50 Gbps, 3.03 Mpps
  Load-Interval #2: 5 minute (300 seconds)
    300 seconds input rate 32 bits/sec, 0 packets/sec
    300 seconds output rate 39094683384 bits/sec, 3249159 packets/sec
    input rate 32 bps, 0 pps; output rate 39.09 Gbps, 3.25 Mpps
  RX
    0 unicast packets  208 multicast packets  9 broadcast packets
    217 input packets  50912 bytes
    0 jumbo packets  0 storm suppression bytes
    0 runts  0 giants  0 CRC  0 no buffer
    0 input error  0 short frame  0 overrun   0 underrun  0 ignored
    0 watchdog  0 bad etype drop  0 bad proto drop  0 if down drop
    0 input with dribble  0 input discard
    0 Rx pause
  TX
    38298127762 unicast packets  6118 multicast packets  0 broadcast packets
    38298133880 output packets  57600384931480 bytes
    0 jumbo packets
    0 output error  0 collision  0 deferred  0 late collision
    0 lost carrier  0 no carrier  0 babble  57443534227 output discard       <<< Output discards due to oversubcription
    0 Tx pause

switch# show interface Ethernet1/1 counters errors

--------------------------------------------------------------------------------
Port          Align-Err    FCS-Err   Xmit-Err    Rcv-Err  UnderSize OutDiscards
--------------------------------------------------------------------------------
Eth1/1                0          0          0          0          0 57443534227

--------------------------------------------------------------------------------
Port         Single-Col  Multi-Col   Late-Col  Exces-Col  Carri-Sen       Runts
--------------------------------------------------------------------------------
Eth1/1                0          0          0          0          0           0

--------------------------------------------------------------------------------
Port          Giants SQETest-Err Deferred-Tx IntMacTx-Er IntMacRx-Er Symbol-Err
--------------------------------------------------------------------------------
Eth1/1             0          --           0           0           0          0

--------------------------------------------------------------------------------
Port         InDiscards
--------------------------------------------------------------------------------
Eth1/1                0
Voorbeeld scenario voor overinschrijving
Neem dit scenario, waarbij verkeer tussen twee IXIA-verkeersgeneratoren een Nexus 9504-switch doorkruist met twee N9K-X9736C-FX-lijnkaarten in sleuven 1 en 2 van het chassis. 100 Gbps verkeer komt de switch binnen via 100 Gbps Ethernet1/1 en moet 40 Gbps Ethernet2/2-interface verlaten. Daarom is Ethernet2/2 oversubscribed. Een voorbeeld van een topologiescenario:
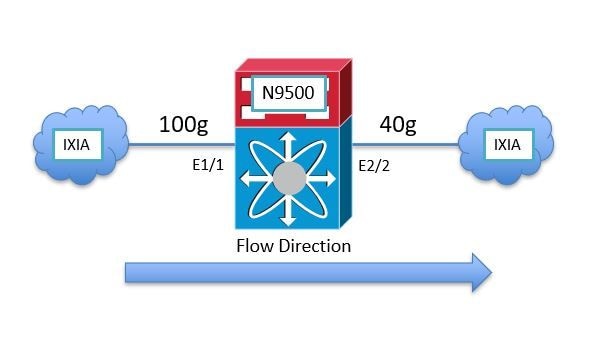
Aangezien de Nexus 9000 Cloud Scale ASIC gebruikmaakt van een shared-memory egress buffer architectuur, moet u de buffer van de egress interface Ethernet2/2 controleren om de congestie te zien. In dit voorbeeld is de lijnkaart die in sleuf 2 is geplaatst de uitgang-lijnkaart, dus u moet de opdracht module 2 koppelen gebruiken voordat u de interne hardwarebuffer bekijkt met de opdracht interne tah-buffertellers tonen. Let op de niet-nul "Bezettingsdalingen"-teller voor de pool-groep van Unit 0, Slice 0 en bijbehorende pools, die het aantal pakketten aangeven dat is gevallen omdat de buffer van de pool-groep volledig bezet is.
switch# attach module 2
module-2# show hardware internal tah buffer counters

Unit: 0 Slice: 0
====================
|------------------------------------------------------------------------------------------------------------------|
|                                               Output Pool-Group drops                                            |
|                                Drop-PG      No-drop      CPU--PG      LCPU-PG      RCPU-PG      SPAN-PG          |
|------------------------------------------------------------------------------------------------------------------|
Occupancy drops                  51152554987        0            0            0            0            0       |
AQM drops                              0            0          N/A          N/A         N/A          N/A        |

|--------------------------------------------------------------------------------------------------------------------|
|                                                        Output UC Pool counters                                     |
|                               Pool 0     Pool 1     Pool 2     Pool 3     Pool 4     Pool 5     Pool 6     Pool 7  |
|--------------------------------------------------------------------------------------------------------------------|
Dynamic Threshold (cells)        93554      93554      93554      93554      93554      93554      93554      93554  |

Occupancy drops                 51152555398     0          0          0          0          0          0          0  |
AQM drops                            0          0          0          0          0          0          0          0  |

|--------------------------------------------------------------------------------------------------------------------|
|                                                        Output MC Pool counters                                     |
|                               Pool 0     Pool 1     Pool 2     Pool 3     Pool 4     Pool 5     Pool 6     Pool 7  |
|--------------------------------------------------------------------------------------------------------------------|
Dynamic Threshold (cells)        93554      93554      93554      93554      93554      93554      93554      93554  |
Dynamic Threshold (desc)         93554      93554      93554      93554      93554      93554      93554      93554  |
Dynamic Threshold (inq thr)      64035      64035      64035      64035      64035      64035      64035      64035  |

Occupancy drops                      0          0          0          0          0          0          0          0  |

|--------------+---------+---------+---------+---------+---------+--------+---------+---------+|
|                                     Additional counters                                      |
|--------------+---------+---------+---------+---------+---------+--------+---------+---------+|
          MEM cell drop reason                  :      0
          MEM descriptor drop reason            :      0
          OPG cell drop reason                  :      0
          OPG descriptor drop reason            :      0
          OPG CPU cell drop reason              :      0
          OPG CPU descriptor drop reason        :      0
          OPG SPAN cell drop reason             :      0
          OPG SPAN descriptor drop reason       :      0
          OPOOL cell drop reason                :      0
          OPOOL descriptor drop reason          :      0
          UC OQUEUE cell drop reason            : 51152556479
          MC OQUEUE cell drop reason            : 27573307
          OQUEUE descriptor drop reason         :      0
          MC OPOOL cell drop reason             :      0
          FWD DROP                              :     15
          SOD                                   :      0
          BMM BP                                :      0
          No Drop                               :      0
          Packets received                      : 87480806439
          TRUNC MTU                             :      0
          TRUNK BMM BP                          :      0
          VOQFC messages sent                   :      0
          SOD messages sent                     :      0
          SPAN desciptor drop                   :      0

Unit: 1 Slice: 0
====================
|------------------------------------------------------------------------------------------------------------------|
|                                               Output Pool-Group drops                                            |
|                                Drop-PG      No-drop      CPU--PG      LCPU-PG      RCPU-PG      SPAN-PG          |
|------------------------------------------------------------------------------------------------------------------|
Occupancy drops                        0            0            0            0            0            0       |
AQM drops                              0            0          N/A          N/A         N/A          N/A        |

|--------------------------------------------------------------------------------------------------------------------|
|                                                        Output UC Pool counters                                     |
|                               Pool 0     Pool 1     Pool 2     Pool 3     Pool 4     Pool 5     Pool 6     Pool 7  |
|--------------------------------------------------------------------------------------------------------------------|
Dynamic Threshold (cells)        93554      93554      93554      93554      93554      93554      93554      93554  |

Occupancy drops                      0          0          0          0          0          0          0          0  |
AQM drops                            0          0          0          0          0          0          0          0  |

|--------------------------------------------------------------------------------------------------------------------|
|                                                        Output MC Pool counters                                     |
|                               Pool 0     Pool 1     Pool 2     Pool 3     Pool 4     Pool 5     Pool 6     Pool 7  |
|--------------------------------------------------------------------------------------------------------------------|
Dynamic Threshold (cells)        93554      93554      93554      93554      93554      93554      93554      93554  |
Dynamic Threshold (desc)         93554      93554      93554      93554      93554      93554      93554      93554  |
Dynamic Threshold (inq thr)      64035      64035      64035      64035      64035      64035      64035      64035  |

Occupancy drops                      0          0          0          0          0          0          0          0  |

|--------------+---------+---------+---------+---------+---------+--------+---------+---------+|
|                                     Additional counters                                      |
|--------------+---------+---------+---------+---------+---------+--------+---------+---------+|
          MEM cell drop reason                  :      0
          MEM descriptor drop reason            :      0
          OPG cell drop reason                  :      0
          OPG descriptor drop reason            :      0
          OPG CPU cell drop reason              :      0
          OPG CPU descriptor drop reason        :      0
          OPG SPAN cell drop reason             :      0
          OPG SPAN descriptor drop reason       :      0
          OPOOL cell drop reason                :      0
          OPOOL descriptor drop reason          :      0
          UC OQUEUE cell drop reason            :      0
          MC OQUEUE cell drop reason            :      0
          OQUEUE descriptor drop reason         :      0
          MC OPOOL cell drop reason             :      0
          FWD DROP                              :      8
          SOD                                   :      0
          BMM BP                                :      0
          No Drop                               :      0
          Packets received                      : 45981341
          TRUNC MTU                             :      0
          TRUNK BMM BP                          :      0
          VOQFC messages sent                   :      0
          SOD messages sent                     :      0
          SPAN desciptor drop                   :      0
Elke ASIC-eenheid/segmenttupel wordt weergegeven door middel van een unieke geïdentificeerde eenheid die een "instantie" wordt genoemd. De uitvoer van de opdracht Toon interne bufferinfo pkt-stats geeft gedetailleerde informatie weer over de overbelaste groep (afgekort als "PG") voor elke instantie. De opdracht geeft ook de historische piek/het maximale aantal cellen in de buffer weer die zijn gebruikt.
Ten slotte toont de opdracht een momentopname van de ASIC-poortidentificatiecodes van Cloud Scale van poorten met gebufferd verkeer. Een voorbeeld van deze opdracht:
switch# attach module 2
module-2# show hardware internal buffer info pkt-stats

Instance 0

============
|------------------------------------------------------------------------------------------------------------|
|                                   Output Pool-Group Buffer Utilization (cells/desc)                        |
|                                Drop-PG      No-drop      CPU--PG      LCPU-PG      RCPU-PG      SPAN-PG    |
|------------------------------------------------------------------------------------------------------------|
Total Instant Usage (cells)        59992            0            0            0            0            0       |
Remaining Instant Usage (cells)    33562            0         1500          250         1500         1500       |
Peak/Max Cells Used                90415            0          N/A          N/A          N/A          N/A       |
Switch Cells Count                 93554            0         1500          250         1500         1500       |

Total Instant Usage (desc)             0            0            0            0            0            0       |
Remaining Instant Usage (desc)     93554            0         1500          250         1500         1500       |
Switch Desc Count                  93554            0         1500          250         1500         1500       |

|--------------------------------------------------------------------------------------------------------------------|
|                                    Output UC Pool Buffer Utilization (cells/desc)                                  |
|                               Pool 0     Pool 1     Pool 2     Pool 3     Pool 4     Pool 5     Pool 6     Pool 7  |
|--------------------------------------------------------------------------------------------------------------------|
Total Instant Usage (cells)      60027          0          0          0          0          0          0          0  |
Total Instant Usage (desc)           0          0          0          0          0          0          0          0  |
Peak/Max Cells Used              62047          0          0          0          0          0          0          0  |

|--------------------------------------------------------------------------------------------------------------------|
|                                    Output MC Pool Buffer Utilization (cells/desc)                                  |
|                               Pool 0     Pool 1     Pool 2     Pool 3     Pool 4     Pool 5     Pool 6     Pool 7  |
|--------------------------------------------------------------------------------------------------------------------|
Total Instant Usage (cells)          0          0          0          0          0          0          0          0  |
Total Instant Usage (desc)           0          0          0          0          0          0          0          0  |
Total Instant Usage (inq cells)      0          0          0          0          0          0          0          0  |
Total Instant Usage (packets)        0          0          0          0          0          0          0          0  |
Peak/Max Cells Used              60399          0          0          0          0          0          0          0  |

|--------------------------------------------------------------------------|
|              Instant Buffer utilization per queue per port               |
|      Each line displays the number of cells/desc utilized for a given    |
|                     port for each QoS queue                              |
|             One cell represents approximately 416 bytes                  |

|--------------+---------+---------+---------+---------+---------+--------+---------+---------+|
|ASIC Port         Q7        Q6        Q5        Q4        Q3        Q2        Q1        Q0    |
|--------------+---------+---------+---------+---------+---------+--------+---------+---------+|
 [12]                                                                                               <<< ASIC Port 12 in Unit 0 Instance 0 is likely the congested egress interface
          UC->       0         0         0         0         0         0         0     59988   |
    MC cells->       0         0         0         0         0         0         0         0   |
    MC desc->        0         0         0         0         0         0         0         0   |
U ziet de piekvariatie van het commando. Gebruik deze opdracht om de syslog te koppelen aan een potentiële spike in een bepaalde groep, pool of poort.
switch# show hardware internal buffer info pkt-stats peak

slot  1
=======


Instance 0

============

|--------------+---------+---------+---------+---------+---------+|
|                     Pool-Group Peak counters                    |
|--------------+---------+---------+---------+---------+---------+|
          Drop PG       :           0
          No-drop PG    :           0

|--------------+---------+---------+---------+---------+---------+|
|                           Pool Peak counters                    |
|--------------+---------+---------+---------+---------+---------+|
          MC Pool 0     :           0
          MC Pool 1     :           0
          MC Pool 2     :           0
          MC Pool 3     :           0
          MC Pool 4     :           0
          MC Pool 5     :           0
          MC Pool 6     :           0
          MC Pool 7     :           0

          UC Pool 0     :           0
          UC Pool 1     :           0
          UC Pool 2     :           0
          UC Pool 3     :           0
          UC Pool 4     :           0
          UC Pool 5     :           0
          UC Pool 6     :           0
          UC Pool 7     :           0

|--------------+---------+---------+---------+---------+---------+|
|                           Port Peak counters                    |
|             classes mapped to count_0: 0 1 2 3 4 5 6 7
|             classes mapped to count_1: None
|--------------+---------+---------+---------+---------+---------+|
 [0]                                             <<< ASIC Port. This can be checked via "show interface hardware-mappings"
          count_0       :           0
          count_1       :           0
 [1]
          count_0       :           0
          count_1       :           0
De opdracht hardware-mappings van de interface weergeven kan worden gebruikt om de ASIC-poortidentificatie voor de cloud scale te vertalen naar een poort op het voorpaneel. In het bovengenoemde voorbeeld heeft ASIC-poort 12 (vertegenwoordigd door de SPort-kolom in de uitvoer van hardware-toewijzingen voor de showinterface) die is gekoppeld aan ASIC Unit 0 op Slice/Instance 0 59.988 bezette cellen van elk 416 bytes. Een voorbeeld van de opdracht show interface hardware-mappings wijst deze interface toe aan de poort Ethernet2/2 op het voorpaneel.
switch# show interface hardware-mappings
Legends:
       SMod  - Source Mod. 0 is N/A
       Unit  - Unit on which port resides. N/A for port channels
       HPort - Hardware Port Number or Hardware Trunk Id:
       HName - Hardware port name. None means N/A
       FPort - Fabric facing port number. 255 means N/A
       NPort - Front panel port number
       VPort - Virtual Port Number. -1 means N/A
       Slice - Slice Number. N/A for BCM systems
       SPort - Port Number wrt Slice. N/A for BCM systems
       SrcId - Source Id Number. N/A for BCM systems
       MacIdx - Mac index. N/A for BCM systems
       MacSubPort - Mac sub port. N/A for BCM systems

-------------------------------------------------------------------------------------------------------
Name       Ifindex  Smod Unit HPortFPort NPort VPort Slice SPort SrcId MacId MacSP VIF  Block BlkSrcID
-------------------------------------------------------------------------------------------------------
Eth2/2     1a080200 5    0    12   255   4     -1    0     12    24    3     0     149  0     24
Bovendien neemt de overinschrijving van interface Ethernet2/2 met QoS-wachtrijen af met de opdracht show queuing interface en een voorbeeld:
switch# show queuing interface Ethernet2/2


Egress Queuing for Ethernet2/2 [System]
------------------------------------------------------------------------------
QoS-Group# Bandwidth% PrioLevel                Shape                   QLimit
                                   Min          Max        Units
------------------------------------------------------------------------------
      7             -         1           -            -     -            9(D)
      6             0         -           -            -     -            9(D)
      5             0         -           -            -     -            9(D)
      4             0         -           -            -     -            9(D)
      3             0         -           -            -     -            9(D)
      2             0         -           -            -     -            9(D)
      1             0         -           -            -     -            9(D)
      0           100         -           -            -     -            9(D)
+-------------------------------------------------------------+
|                              QOS GROUP 0                    |
+-------------------------------------------------------------+
|                           |  Unicast       |Multicast       |
+-------------------------------------------------------------+
|                   Tx Pkts |     35593332351|        18407162|
|                   Tx Byts |  53532371857088|     27684371648|
| WRED/AFD & Tail Drop Pkts |     53390604466|        27573307|
| WRED/AFD & Tail Drop Byts |  80299469116864|       110293228|
|              Q Depth Byts |        24961664|               0|
|       WD & Tail Drop Pkts |     53390604466|        27573307|
+-------------------------------------------------------------+
|                              QOS GROUP 1                    |
+-------------------------------------------------------------+
|                           |  Unicast       |Multicast       |
+-------------------------------------------------------------+
|                   Tx Pkts |               0|               0|
|                   Tx Byts |               0|               0|
| WRED/AFD & Tail Drop Pkts |               0|               0|
| WRED/AFD & Tail Drop Byts |               0|               0|
|              Q Depth Byts |               0|               0|
|       WD & Tail Drop Pkts |               0|               0|
+-------------------------------------------------------------+
|                              QOS GROUP 2                    |
+-------------------------------------------------------------+
|                           |  Unicast       |Multicast       |
+-------------------------------------------------------------+
|                   Tx Pkts |               0|               0|
|                   Tx Byts |               0|               0|
| WRED/AFD & Tail Drop Pkts |               0|               0|
| WRED/AFD & Tail Drop Byts |               0|               0|
|              Q Depth Byts |               0|               0|
|       WD & Tail Drop Pkts |               0|               0|
+-------------------------------------------------------------+
|                              QOS GROUP 3                    |
+-------------------------------------------------------------+
|                           |  Unicast       |Multicast       |
+-------------------------------------------------------------+
|                   Tx Pkts |               0|               0|
|                   Tx Byts |               0|               0|
| WRED/AFD & Tail Drop Pkts |               0|               0|
| WRED/AFD & Tail Drop Byts |               0|               0|
|              Q Depth Byts |               0|               0|
|       WD & Tail Drop Pkts |               0|               0|
+-------------------------------------------------------------+
|                              QOS GROUP 4                    |
+-------------------------------------------------------------+
|                           |  Unicast       |Multicast       |
+-------------------------------------------------------------+
|                   Tx Pkts |               0|               0|
|                   Tx Byts |               0|               0|
| WRED/AFD & Tail Drop Pkts |               0|               0|
| WRED/AFD & Tail Drop Byts |               0|               0|
|              Q Depth Byts |               0|               0|
|       WD & Tail Drop Pkts |               0|               0|
+-------------------------------------------------------------+
|                              QOS GROUP 5                    |
+-------------------------------------------------------------+
|                           |  Unicast       |Multicast       |
+-------------------------------------------------------------+
|                   Tx Pkts |               0|               0|
|                   Tx Byts |               0|               0|
| WRED/AFD & Tail Drop Pkts |               0|               0|
| WRED/AFD & Tail Drop Byts |               0|               0|
|              Q Depth Byts |               0|               0|
|       WD & Tail Drop Pkts |               0|               0|
+-------------------------------------------------------------+
|                              QOS GROUP 6                    |
+-------------------------------------------------------------+
|                           |  Unicast       |Multicast       |
+-------------------------------------------------------------+
|                   Tx Pkts |               0|               0|
|                   Tx Byts |               0|               0|
| WRED/AFD & Tail Drop Pkts |               0|               0|
| WRED/AFD & Tail Drop Byts |               0|               0|
|              Q Depth Byts |               0|               0|
|       WD & Tail Drop Pkts |               0|               0|
+-------------------------------------------------------------+
|                              QOS GROUP 7                    |
+-------------------------------------------------------------+
|                           |  Unicast       |Multicast       |
+-------------------------------------------------------------+
|                   Tx Pkts |               0|               0|
|                   Tx Byts |               0|               0|
| WRED/AFD & Tail Drop Pkts |               0|               0|
| WRED/AFD & Tail Drop Byts |               0|               0|
|              Q Depth Byts |               0|               0|
|       WD & Tail Drop Pkts |               0|               0|
+-------------------------------------------------------------+
|                      CONTROL QOS GROUP                      |
+-------------------------------------------------------------+
|                           |  Unicast       |Multicast       |
+-------------------------------------------------------------+
|                   Tx Pkts |            5704|               0|
|                   Tx Byts |          725030|               0|
|            Tail Drop Pkts |               0|               0|
|            Tail Drop Byts |               0|               0|
+-------------------------------------------------------------+
|                         SPAN QOS GROUP                      |
+-------------------------------------------------------------+
|                           |  Unicast       |Multicast       |
+-------------------------------------------------------------+
|                   Tx Pkts |               0|               0|
|                   Tx Byts |               0|               0|
+-------------------------------------------------------------+

Per Slice Egress SPAN Statistics
---------------------------------------------------------------
         SPAN Copies Tail Drop Pkts                           0
         SPAN Input Queue Drop Pkts                           0
 SPAN Copies/Transit Tail Drop Pkts                           0
         SPAN Input Desc Drop  Pkts                           0
U kunt controleren of de uitgang-interface Ethernet2/2 een niet-nul-uitvoer-weggooiteller heeft met de opdracht interface tonen.
switch# show interface Ethernet2/2
Ethernet2/2 is up
admin state is up, Dedicated Interface
  Hardware: 1000/10000/25000/40000/50000/100000 Ethernet, address: 7cad.4f6d.f6d8 (bia 7cad.4f6d.f6d8)
  MTU 1500 bytes, BW 40000000 Kbit , DLY 10 usec
  reliability 255/255, txload 232/255, rxload 1/255
  Encapsulation ARPA, medium is broadcast
  Port mode is trunk
  full-duplex, 40 Gb/s, media type is 40G
  Beacon is turned off
  Auto-Negotiation is turned on  FEC mode is Auto
  Input flow-control is off, output flow-control is off
  Auto-mdix is turned off
  Rate mode is dedicated
  Switchport monitor is off
  EtherType is 0x8100
  EEE (efficient-ethernet) : n/a
    admin fec state is auto, oper fec state is off
  Last link flapped 03:16:50
  Last clearing of "show interface" counters never
  3 interface resets
  Load-Interval #1: 30 seconds
    30 seconds input rate 0 bits/sec, 0 packets/sec
    30 seconds output rate 36503585488 bits/sec, 3033870 packets/sec
    input rate 0 bps, 0 pps; output rate 36.50 Gbps, 3.03 Mpps
  Load-Interval #2: 5 minute (300 seconds)
    300 seconds input rate 32 bits/sec, 0 packets/sec
    300 seconds output rate 39094683384 bits/sec, 3249159 packets/sec
    input rate 32 bps, 0 pps; output rate 39.09 Gbps, 3.25 Mpps
  RX
    0 unicast packets  208 multicast packets  9 broadcast packets
    217 input packets  50912 bytes
    0 jumbo packets  0 storm suppression bytes
    0 runts  0 giants  0 CRC  0 no buffer
    0 input error  0 short frame  0 overrun   0 underrun  0 ignored
    0 watchdog  0 bad etype drop  0 bad proto drop  0 if down drop
    0 input with dribble  0 input discard
    0 Rx pause
  TX
    38298127762 unicast packets  6118 multicast packets  0 broadcast packets
    38298133880 output packets  57600384931480 bytes
    0 jumbo packets
    0 output error  0 collision  0 deferred  0 late collision
    0 lost carrier  0 no carrier  0 babble  57443534227 output discard       <<< Output discards due to oversubcription
    0 Tx pause
Volgende stappen
Als u teruggooi van uitvoer op een Nexus 9000-serie switch met een Cloud Scale ASIC waarneemt, kunt u het probleem oplossen met een of meer van de methoden hier:
- Als de interface die output teruggooi ervaart een enkele interface is en niet is gebundeld in een poortkanaal, dan kunt u de bandbreedte van de interface upgraden om congestie te helpen verlichten. Als een overbelaste interface bijvoorbeeld een 10 Gbps-interface is en als u een upgrade uitvoert naar een 25 Gbps-, 40 Gbps- of 100 Gbps-interface, kan dit het probleem helpen oplossen.
- Op basis van de transceiver-vormfactor van de uitgang-interface kunt u de transceiver upgraden (u kunt migreren van een 10 Gbps SFP+ geplaatst in een CVR-QSFP-SFP10G in een QSFP-poort naar een native 40 Gbps QSFP-transceiver).
- Dit kan ook worden gedaan als u de configuratie van de verstopte uitgang-interface migreert van een 10 Gbps-poort naar een 25 Gbps-, 40 Gbps- of 100 Gbps-poort.
- Als de interface die output teruggooi ervaart een enkele interface is en niet is gebundeld in een poortkanaal, dan kunt u de overbelaste interface configureren om lid te zijn van een poortkanaal naast een andere interface met dezelfde bandbreedte en de congestie te verlichten.
- Als de interface die uitvoer teruggooi ervaart een poort-kanaal interface is, dan als je leden toevoegt aan het poort-kanaal kan het de bandbreedte van het totale poort-kanaal verhogen en de load-balanced hashing verbeteren voor meerdere grote verkeersstromen.
- Valideren of overbelaste verkeersstromen tussen hosts in uw netwerk interfaces omvatten die sneller worden (bijvoorbeeld verkeer dat een switch binnendringt via een 40 Gbps-interface en een switch verlaat via een 10 Gbps-interface). Dit kan een bottleneck zijn die netwerkcongestie veroorzaakt. Om dit knelpunt weg te werken, moet u de interface met lagere snelheid (bijvoorbeeld 10 Gbps) upgraden naar een interface met hogere snelheid (bijvoorbeeld 25 Gbps, 40 Gbps, enzovoort) en dit verlicht de netwerkcongestie.
- Als u de beschikbare bandbreedte op de overbelaste uitgang-interface niet kunt verhogen, valideert u End-to-End QoS en past u de juiste wachtrijacties toe voor uw netwerk.
- Als micro-uitbarstingen een mogelijke oorzaak zijn van intermitterende congestie, raadpleeg dan het gedeelte Monitoring Micro-Bursts van dit document voor informatie over het configureren van micro-burst-monitoring.
Aanvullende informatie
Dit gedeelte van het document bevat aanvullende informatie over de volgende stappen die u moet nemen wanneer u de BUFFER_THRESHOLD_OVERSCHREDEN syslog, netwerkcongestie/overabonnementscenario's en incrementele uitvoer-weggooiinterfacetellers tegenkomt.
BUFFER_THRESHOLD_OVERSCHREDEN Syslog-configuratieopties
U kunt het pollinginterval voor de systeembufferstatus wijzigen, waarmee wordt bepaald hoe vaak het systeem het huidige gebruik van ASIC-segmentbuffers polst. Dit wordt gedaan met de opdracht Hardwareprofielbuffer info poll-interval globale configuratie. De standaardconfiguratiewaarde is 5.000 milliseconden. Deze configuratie kan globaal of per module worden gewijzigd. Een voorbeeld van deze configuratie commando wordt hier getoond, waar het wordt gewijzigd tot een waarde van 1.000 milliseconden.
switch# configure terminal
Enter configuration commands, one per line. End with CNTL/Z.
switch(config)# hardware profile buffer info poll-interval timer 1000
switch(config)# end
switch# show running-config | include hardware.profile.buffer
hardware profile buffer info poll-interval timer 1000
switch#
U kunt de drempelwaarde voor het gebruik van de poortuitgang-buffer wijzigen. Deze waarde bepaalt wanneer het systeem de SYSLOG BUFFER_THRESHOLD_EXCEEDED genereert en geeft aan dat het gebruik van de ASIC-segmentbuffer de geconfigureerde drempelwaarde heeft overschreden. Dit wordt gedaan met de opdracht Hardwareprofielbuffer info Port-threshold globale configuratie. De standaardconfiguratiewaarde is 90%. Deze configuratie kan globaal of per module worden gewijzigd. Raadpleeg de configuratieopdracht waar deze is gewijzigd tot de waarde van 80%:
switch# configure terminal
Enter configuration commands, one per line. End with CNTL/Z.
switch(config)# hardware profile buffer info port-threshold threshold 80
switch(config)# end
switch# show running-config | include hardware.profile.buffer
hardware profile buffer info port-threshold threshold 80
switch#
U kunt het minimuminterval tussen de door de switch gegenereerde BUFFER_THRESHOLD_EXCEEDED-syslogs wijzigen. U kunt ook de syslog BUFFER_THRESHOLD_OVERSCHREDEN uitschakelen. Dit wordt gedaan met de opdracht Syslog-interval timer global configuration (globale configuratie) voor de bufferinformatie van het hardwareprofiel. De standaardconfiguratiewaarde is 120 seconden. De syslog kan volledig worden uitgeschakeld door de waarde in te stellen op 0 seconden. Raadpleeg de configuratieopdracht waarbij de syslog volledig is uitgeschakeld:
switch# configure terminal
Enter configuration commands, one per line. End with CNTL/Z.
switch(config)# hardware profile buffer info syslog-interval timer 0
switch(config)# end
switch# show running-config | include hardware.profile.buffer
hardware profile buffer info syslog-interval timer 0
switch#
Logboeken verzamelen voor netwerkcongestiescenario's
U kunt logboeken verzamelen van een switch die wordt getroffen door een netwerkcongestiescenario om naast de opdrachten in dit document ook een overbelaste uitgang-interface te identificeren.
- De uitvoer van het commando show tech-support details.
- De uitvoer van de show tech-support usd-all opdracht.
- De uitvoer van de show tech-support ipqos all command.
- Wanneer u werkt met een Nexus 9500-reeks switch met Cisco Cloud Scale-lijnkaarten ingevoegd, wordt de uitvoer van de piekmodule van de interne interfacetellers van het systeem weergeven {x}, waarbij {x} het sleufnummer is van de module die de overbelaste uitgang-interface host.
Bewaking van microbursts
Wanneer congestie of overinschrijving in zeer korte intervallen plaatsvindt (een microburst), is aanvullende informatie nodig om een accurate weergave te krijgen van hoe de overinschrijving de switch beïnvloedt.
Cisco Nexus 9000-serie switches die zijn uitgerust met de Cisco Cloud Scale ASIC kunnen het verkeer controleren op microbursts die tijdelijke netwerkcongestie en verkeersverlies in uw omgeving kunnen veroorzaken. Zie de documentatie voor gedetailleerde informatie over micro-bursts en hoe u deze functie kunt configureren:
- "Micro-Burst Monitoring" hoofdstuk van de Cisco Nexus 9000 Series NX-OS Quality of Service Configuration Guide, release 10.1(x)
- "Micro-Burst Monitoring" hoofdstuk van de Cisco Nexus 9000 Series NX-OS Quality of Service Configuration Guide, versie 9.3(x)
- "Micro-Burst Monitoring" hoofdstuk van de Cisco Nexus 9000 Series NX-OS Quality of Service Configuration Guide, versie 9.2(x)
- "Micro-Burst Monitoring" hoofdstuk van de Cisco Nexus 9000 Series NX-OS Quality of Service Configuration Guide, release 7.x
Gerelateerde informatie
Revisiegeschiedenis
| Revisie | Publicatiedatum | Opmerkingen |
|---|---|---|
7.0 |
28-May-2026
|
Updates over spelling, inspringing en spatiëring. |
6.0 |
09-Nov-2023
|
bijwerken |
5.0 |
04-Oct-2023
|
hercertificering |
3.0 |
21-Jan-2022
|
Voeg de sectie "Volgende stappen" toe aan het document. |
2.0 |
03-Oct-2021
|
Bijwerken van het gedeelte Toepasselijke hardware om nieuwe hardware toe te voegen. |
1.0 |
31-Aug-2021
|
Eerste vrijgave |

 Feedback
Contact Cisco
- Een ondersteuningscase openen

- (Vereist een Cisco-servicecontract)