Switch(config)#ip nbar custom MYDOMAIN composite server-name *mydomain.com id 13
Catalyst 9000 シリーズ スイッチでの NetFlow、AVC、ETA の設定と確認
ダウンロード オプション
Updated: 2025 年 11 月 13 日
Document ID:218311
偏向のない言語
この製品のドキュメントセットは、偏向のない言語を使用するように配慮されています。このドキュメントセットでの偏向のない言語とは、年齢、障害、性別、人種的アイデンティティ、民族的アイデンティティ、性的指向、社会経済的地位、およびインターセクショナリティに基づく差別を意味しない言語として定義されています。製品ソフトウェアのユーザインターフェイスにハードコードされている言語、RFP のドキュメントに基づいて使用されている言語、または参照されているサードパーティ製品で使用されている言語によりドキュメントに例外が存在する場合があります。シスコのインクルーシブ ランゲージの取り組みの詳細は、こちらをご覧ください。
翻訳について
シスコは世界中のユーザにそれぞれの言語でサポート コンテンツを提供するために、機械と人による翻訳を組み合わせて、本ドキュメントを翻訳しています。ただし、最高度の機械翻訳であっても、専門家による翻訳のような正確性は確保されません。シスコは、これら翻訳の正確性について法的責任を負いません。原典である英語版(リンクからアクセス可能)もあわせて参照することを推奨します。
内容
はじめに
このドキュメントでは、NetFlow、Application Visibility and Control(AVC)、暗号化トラフィック分析(ETA)の設定方法と検証方法について説明します。
前提条件
要件
次の項目に関する知識があることが推奨されます。
- NetFlow
- AVC
- ETA
使用するコンポーネント
このドキュメントの情報は、Cisco IOS® XEソフトウェア16.12.4が稼働するCatalyst 9300スイッチに基づくものです。
このドキュメントの情報は、特定のラボ環境にあるデバイスに基づいて作成されました。このドキュメントで使用するすべてのデバイスは、クリアな(デフォルト)設定で作業を開始しています。本稼働中のネットワークでは、各コマンドによって起こる可能性がある影響を十分確認してください。
関連製品
このドキュメントは、次のバージョンのハードウェアとソフトウェアにも使用できます。
- 9200(NetFlowとAVCのみをサポート)
- 9300(NetFlow、AVC、およびETAをサポート)
- 9400(NetFlow、AVC、およびETAをサポート)
- 9500(NetFlowとAVCのみをサポート)
- 9600(NetFlowとAVCのみをサポート)
- Cisco IOS XE 16.12以降
背景説明
- Flexible NetFlowは、データを収集および測定して、ネットワーク内のすべてのルータまたはスイッチをテレメトリのソースにするための次世代のフローテクノロジーです。
- Flexible NetFlowにより、非常にきめ細かく正確なトラフィック測定と高レベルの集約されたトラフィック収集が可能になります。
- Flexible NetFlowはフローを使用して、アカウンティング、ネットワークモニタリング、およびネットワーク計画の統計情報を提供します。
- フローとは、送信元インターフェイスに到達する単方向のパケットストリームであり、キーの値は同じです。キーは、パケット内のフィールドの識別値です。フローレコードを使用してフローを作成し、フローに一意のキーを定義します。
注:プラットフォーム(fed)コマンドは異なる場合があります。コマンドは、show platform fed <active|standby>とshow platform fed switch <active|standby>のいずれかです。 例に示されている構文が解析できない場合は、バリアント型を試してください。
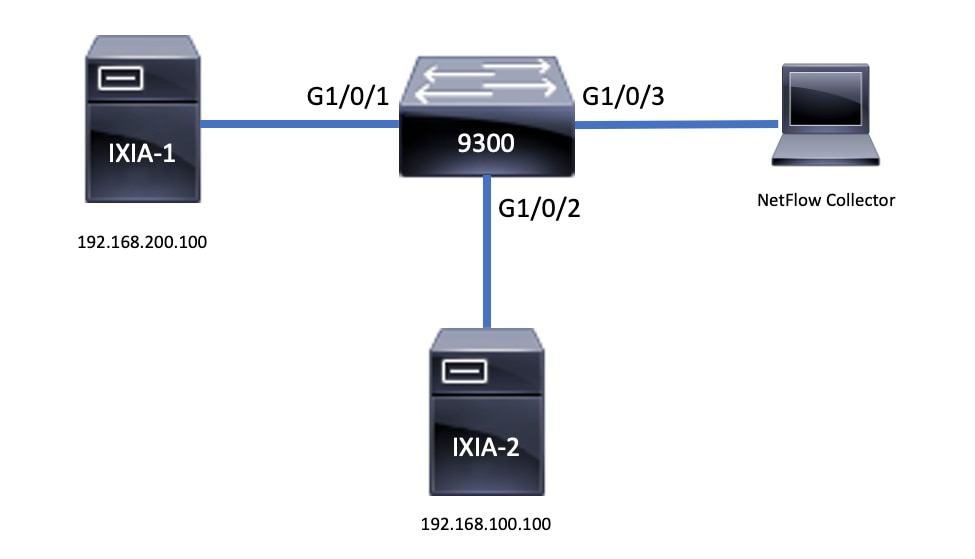
ネットワーク図
設定
コンポーネント
NetFlowの設定は、3つの主要なコンポーネントで構成されており、これらを組み合わせて使用することで、トラフィック分析とデータエクスポートを実行できます。
フローレコード
- レコードは、キーフィールドと非キーフィールドを組み合わせたものです。Flexible NetFlowレコードはFlexible NetFlowフローモニタに割り当てられ、フローデータの保存に使用されるキャッシュを定義します。
- Flexible NetFlowには、トラフィックの監視に使用できる複数の定義済みレコードが含まれています。
- また、Flexible NetFlowでは、キーフィールドと非キーフィールドを指定してFlexible NetFlowフローモニタキャッシュのカスタムレコードを定義し、特定の要件に合わせてデータ収集をカスタマイズできます。
例に示すように、フローレコードの設定の詳細は次のとおりです。
flow record TAC-RECORD-IN
match flow direction
match ipv4 source address
match interface input
match ipv4 destination address
match ipv4 protocol
collect counter packets long
collect counter bytes long
collect timestamp absolute last
collect transport tcp flags

flow record TAC-RECORD-OUT
match flow direction
match interface output
match ipv4 source address
match ipv4 destination address
match ipv4 protocol
collect counter packets long
collect counter bytes long
collect timestamp absolute last
collect transport tcp flags
フローエクスポータ
- フローエクスポータは、フローモニタのキャッシュ内のデータをリモートシステム(NetFlowコレクタとして機能するサーバ)にエクスポートして、分析と保存を行うために使用されます。
- フローエクスポータは、フローモニタにデータエクスポート機能を提供するためにフローモニタに割り当てられます。
例に示すように、フローエクスポータの設定の詳細は次のとおりです。
flow exporter TAC-EXPORT
destination 192.168.69.2
source Vlan69
フローモニタ
- フローモニタは、ネットワークトラフィックのモニタリングを実行するためにインターフェイスに適用されるFlexible NetFlowコンポーネントです。
- フローデータはネットワークトラフィックから収集され、プロセスの実行中にフローモニタのキャッシュに追加されます。このプロセスは、フローレコードのキーフィールドと非キーフィールドに基づいています。
例に示すように、フローモニタの設定の詳細は次のとおりです。
flow monitor TAC-MONITOR-IN
exporter TAC-EXPORT
record TAC-RECORD-IN

flow monitor TAC-MONITOR-OUT
exporter TAC-EXPORT
record TAC-RECORD-OUT

Switch#show run int g1/0/1
Building configuration...

Current configuration : 185 bytes
!
interface GigabitEthernet1/0/1
switchport access vlan 42
switchport mode access
ip flow monitor TAC-MONITOR-IN input
ip flow monitor TAC-MONITOR-OUT output
load-interval 30
end
フローサンプラ(オプション)
- フローサンプラは、ルータの設定で個別のコンポーネントとして作成されます。
- フローサンプラは、分析用に選択されるパケットの数を制限し、Flexible NetFlowを使用するデバイスの負荷を軽減します。
- フローサンプラは、分析用に選択されるパケット数の制限によって実現されるFlexible NetFlowを使用するデバイスの負荷を軽減するために使用されます。
- フローサンプラは、ルータのパフォーマンスの精度を交換します。フローモニタで分析されるパケット数が減少すると、フローモニタのキャッシュに保存されている情報の精度に影響が出る可能性があります。
例に示すように、フローサンプラの設定例は次のとおりです。
sampler SAMPLE-TAC
description Sample at 50%
mode random 1 out-of 2

Switch(config)#interface GigabitEthernet1/0/1
Switch(config-if)#ip flow monitor TAC-MONITOR-IN sampler SAMPLE-TAC input
Switch(config-if)#end
制約事項
- Flexible NetFlowを完全に使用するには、Cisco DNA Addonライセンスが必要です。それ以外の場合は、Sampled NetFlowのみを使用できます。
- フローエクスポータは送信元として管理ポートを使用できません。
これは包括的なリストではありません。適切なプラットフォームとコードの設定ガイドを参照してください。
確認
プラットフォームに依存しない検証
設定を確認し、必要なNetFlowコンポーネントが存在することを確認します。
- フローレコード
- フローエクスポータ
- フローモニタ
- フローサンプラ(オプション)
ヒント:フローレコード、フローエクスポータ、およびフローモニタの出力を1つのコマンドで表示するには、show running-config flow monitor <flow monitor name> expandを実行します。
例に示すように、フローモニタは入力方向とその関連コンポーネントに関連付けられています。
Switch#show running-config flow monitor TAC-MONITOR-IN expand
Current configuration:
!
flow record TAC-RECORD-IN
 match ipv4 protocol
 match ipv4 source address
 match ipv4 destination address
 match interface input
 match flow direction
 collect transport tcp flags
 collect counter bytes long
 collect counter packets long
 collect timestamp absolute last
!
flow exporter TAC-EXPORT
 destination 192.168.69.2
 source Vlan69
!
flow monitor TAC-MONITOR-IN
 exporter TAC-EXPORT
 record TAC-RECORD-IN
!
この例に示すように、フローモニタは出力方向とその関連コンポーネントに関連付けられています。
Switch#show run flow monitor TAC-MONITOR-OUT expand
Current configuration:
!
flow record TAC-RECORD-OUT
 match ipv4 protocol
 match ipv4 source address
 match ipv4 destination address
 match interface output
 match flow direction
 collect transport tcp flags
 collect counter bytes long
 collect counter packets long
 collect timestamp absolute last
!
flow exporter TAC-EXPORT
 destination 192.168.69.2
 source Vlan69
!
flow monitor TAC-MONITOR-OUT
 exporter TAC-EXPORT
 record TAC-RECORD-OUT
!
show flow monitor <flow monitor name> statisticsコマンドを実行します。次の出力は、データが記録されていることを確認するのに役立ちます。
Switch#show flow monitor TAC-MONITOR-IN statistics
  Cache type:                               Normal (Platform cache)
  Cache size:                                10000
  Current entries:                               1

  Flows added:                                   1
  Flows aged:                                    0
show flow monitor <flow monitor name> cachetoコマンドを実行して、NetFlowキャッシュに出力があることを確認します。
Switch#show flow monitor TAC-MONITOR-IN cache
  Cache type:                               Normal (Platform cache)
  Cache size:                                10000
  Current entries:                               1

  Flows added:                                   1
  Flows aged:                                    0

IPV4 SOURCE ADDRESS:       192.168.200.100
IPV4 DESTINATION ADDRESS:  192.168.100.100
INTERFACE INPUT:           Gi1/0/1
FLOW DIRECTION:            Input
IP PROTOCOL:               17
tcp flags:                 0x00
counter bytes long:        4606617470
counter packets long:      25311085
timestamp abs last:        22:44:48.579
show flow exporter <exporter name> statisticsコマンドを実行して、エクスポータがパケットを送信したことを確認します。
Switch#show flow exporter TAC-EXPORT statistics
Flow Exporter TAC-EXPORT:
  Packet send statistics (last cleared 00:08:38 ago):
    Successfully sent:         2                     (24 bytes)

  Client send statistics:
    Client: Flow Monitor TAC-MONITOR-IN
      Records added:           0
      Bytes added:             12
        - sent:                12

    Client: Flow Monitor TAC-MONITOR-OUT
      Records added:           0
      Bytes added:             12
        - sent:                12
プラットフォーム依存の検証
NetFlow初期化:NFLパーティションテーブル
- NetFlowパーティションは、方向(入力と出力)ごとに16のパーティションを使用して、異なる機能用に初期化されます。
- NetFlowパーティションテーブル設定はグローバルバンク割り当てに分割され、さらに入力フローバンクと出力フローバンクに分割されます。
キーフィールド
- パーティションの数
- パーティションの有効ステータス
- パーティション制限
- 現在のパーティションの使用状況
NetFlowパーティションテーブルを表示するには、コマンドshow platform software fed switch active|standby|member| fnf sw-table-sizes asic <asic number> shadow 0を実行します。
注:作成されるフローは、作成時にスイッチとASICコアに固有です。スイッチ番号(アクティブ、スタンバイなど)を適宜指定する必要があります。入力されるASIC番号はそれぞれのインターフェイスに結び付けられています。show platform software fed switch active|standby|member ifm mappingsを使用して、インターフェイスに対応するASICを判別します。shadowオプションの場合は、常に0を使用してください。
Switch#show platform software fed switch active fnf sw-table-sizes asic 0 shadow 0

---------------------------------
     Global Bank Allocation
---------------------------------
Ingress Banks : Bank 0 Bank 1
Egress Banks  : Bank 2 Bank 3
---------------------------------
    Global flow table Info                                   <--- Provides the number of entries used per direction
INGRESS    usedBankEntry           0  usedOvfTcamEntry     0
 EGRESS    usedBankEntry           0  usedOvfTcamEntry     0
---------------------------------
    Flows Statistics
INGRESS    TotalSeen=0 MaxEntries=0 MaxOverflow=0
EGRESS     TotalSeen=0 MaxEntries=0 MaxOverflow=0

---------------------------------
       Partition Table
---------------------------------
## Dir  Limit  CurrFlowCount  OverFlowCount  MonitoringEnabled
 0 ING      0          0               0           0
 1 ING  16640          0               0           1          <-- Current flow count in hardware
 2 ING      0          0               0           0
 3 ING  16640          0               0           0
 4 ING      0          0               0           0
 5 ING   8192          0               0           1
 6 ING      0          0               0           0
 7 ING      0          0               0           0
 8 ING      0          0               0           0
 9 ING      0          0               0           0
10 ING      0          0               0           0
11 ING      0          0               0           0
12 ING      0          0               0           0
13 ING      0          0               0           0
14 ING      0          0               0           0
15 ING      0          0               0           0
 0 EGR      0          0               0           0
 1 EGR  16640          0               0           1          <-- Current flow count in hardware
 2 EGR      0          0               0           0
 3 EGR  16640          0               0           0
 4 EGR      0          0               0           0
 5 EGR   8192          0               0           1
 6 EGR      0          0               0           0
 7 EGR      0          0               0           0
 8 EGR      0          0               0           0
 9 EGR      0          0               0           0
10 EGR      0          0               0           0
11 EGR      0          0               0           0
12 EGR      0          0               0           0
13 EGR      0          0               0           0
14 EGR      0          0               0           0
15 EGR      0          0               0           0
フローモニタ
フローモニタの設定には、次のものが含まれます。
1. NetFlow ACL設定。これにより、ACL TCAMテーブル内にエントリが作成されます。
ACL TCAMエントリは次の要素で構成されます。
- 一致するキーの検索
- NetFlowルックアップに使用される結果パラメータ。次のパラメータが含まれます。
- プロファイルID
- NetFlow ID
2. フローマスク設定。これにより、NflLookupTableおよびNflFlowMaskTableにエントリが作成されます。
- NetFlow ACLの結果パラメータによってインデックス付けされ、NetFlowルックアップのフローマスクを検索
NetFlow ACL
NetFlow ACL設定を表示するには、コマンドshow platform hardware fed switch active fwd-asic resource tcam table nfl_acl asic <asic number>を実行します。
ヒント:ポートACL(PACL)がある場合は、インターフェイスがマッピングされているASIC上にエントリが作成されます。ルータACL(RACL)の場合、エントリはすべてのASICに存在します。
- この出力には、4ビット値のNFCMD0とNFCMD1があります。プロファイルIDを計算するには、値を2進数に変換します。
- この出力では、NFCMD0は1、NFCMD1は2です。2進数に変換すると、000100010のようになります。
- Cisco IOS XE 16.12以降では、合計8ビット以内の最初の4ビットがプロファイルID、7番目のビットがルックアップが有効であることを示します。したがって、この例では00010010のプロファイルIDは1です。
- Cisco IOS XE 16.11以前のバージョンのコードでは、合計8ビットのうち、最初の6ビットがプロファイルID、7番目のビットがルックアップが有効であることを示します。したがって、この例では00010010のプロファイルIDは4です。
Switch#show platform hardware fed switch active fwd-asic resource tcam table nfl_acl asic 0
Printing entries for region INGRESS_NFL_ACL_CONTROL (308) type 6 asic 0
========================================================
Printing entries for region INGRESS_NFL_ACL_GACL (309) type 6 asic 0
========================================================
Printing entries for region INGRESS_NFL_ACL_PACL (310) type 6 asic 0
========================================================
TAQ-2 Index-32 (A:0,C:0) Valid StartF-1 StartA-1 SkipF-0 SkipA-0
Input IPv4 NFL PACL

Labels  Port   Vlan   L3If   Group
M:      00ff   0000   0000   0000
V:      0001   0000   0000   0000

   vcuResults l3Len l3Pro l3Tos SrcAddr  DstAddr  mtrid vrfid  SH
M:  00000000   0000  00    00  00000000 00000000  00   0000   0000
V:  00000000   0000  00    00  00000000 00000000  00   0000   0000

   RMAC RA MEn IPOPT MF NFF DF SO DPT TM DSEn  l3m
M:  0    0  0    0    0  0   0  0  0   0  0  0
V:  0    0  0    0    0  0   0  0  0   0  0  0

   SrcPort DstPortIITypeCode TCPFlags TTL ISBM QosLabel ReQOS S_P2P D_P2P
M:  0000    0000              00    00    0000    00      0     0     0
V:  0000    0000              00    00    0000    00      0     0     0

   SgEn SgLabel    AuthBehaviorTag  l2srcMiss  l2dstMiss ipTtl SgaclDeny
M:  0    000000    0  0   0 0     0
V:  0    000000    0  0   0 0     0

NFCMD0 NFCMD1 SMPLR LKP1 LKP2 PID QOSPRI MQLBL MPLPRO LUT0PRI CPUCOPY
     1      2     0    1    0   0      0     0      0 0x0000f       0
Start/Skip Word: 0x00000003
Start Feature, Terminate

-----------------------------------------
Printing entries for region INGRESS_NFL_ACL_VACL (311) type 6 asic 0
========================================================
Printing entries for region INGRESS_NFL_ACL_RACL (312) type 6 asic 0
========================================================
Printing entries for region INGRESS_NFL_ACL_SSID (313) type 6 asic 0
========================================================
Printing entries for region INGRESS_NFL_CATCHALL (314) type 6 asic 0
========================================================
TAQ-2 Index-224 (A:0,C:0) Valid StartF-1 StartA-1 SkipF-0 SkipA-0
Input IPv4 NFL RACL

Labels  Port   Vlan   L3If   Group
M:      0000   0000   0000   0000
V:      0000   0000   0000   0000

   vcuResults l3Len l3Pro l3Tos SrcAddr  DstAddr  mtrid vrfid  SH
M:  00000000   0000  00    00  00000000 00000000  00   0000   0000
V:  00000000   0000  00    00  00000000 00000000  00   0000   0000

   RMAC RA MEn IPOPT MF NFF DF SO DPT TM DSEn  l3m
M:  0    0  0    0    0  0   0  0  0   0  0  0
V:  0    0  0    0    0  0   0  0  0   0  0  0

   SrcPort DstPortIITypeCode TCPFlags TTL ISBM QosLabel ReQOS S_P2P D_P2P
M:  0000    0000              00    00    0000    00      0     0     0
V:  0000    0000              00    00    0000    00      0     0     0

   SgEn SgLabel    AuthBehaviorTag  l2srcMiss  l2dstMiss ipTtl SgaclDeny
M:  0    000000    0  0   0 0     0
V:  0    000000    0  0   0 0     0

NFCMD0 NFCMD1 SMPLR LKP1 LKP2 PID QOSPRI MQLBL MPLPRO LUT0PRI CPUCOPY
     0      0     0    0    0   0      0     0      0 0x00000       0
Start/Skip Word: 0x00000003
Start Feature, Terminate

-----------------------------------------
TAQ-2 Index-225 (A:0,C:0) Valid StartF-0 StartA-0 SkipF-0 SkipA-0
Input IPv4 NFL PACL

Labels  Port   Vlan   L3If   Group
M:      0000   0000   0000   0000
V:      0000   0000   0000   0000

   vcuResults l3Len l3Pro l3Tos SrcAddr  DstAddr  mtrid vrfid  SH
M:  00000000   0000  00    00  00000000 00000000  00   0000   0000
V:  00000000   0000  00    00  00000000 00000000  00   0000   0000

   RMAC RA MEn IPOPT MF NFF DF SO DPT TM DSEn  l3m
M:  0    0  0    0    0  0   0  0  0   0  0  0
V:  0    0  0    0    0  0   0  0  0   0  0  0

   SrcPort DstPortIITypeCode TCPFlags TTL ISBM QosLabel ReQOS S_P2P D_P2P
M:  0000    0000              00    00    0000    00      0     0     0
V:  0000    0000              00    00    0000    00      0     0     0

   SgEn SgLabel    AuthBehaviorTag  l2srcMiss  l2dstMiss ipTtl SgaclDeny
M:  0    000000    0  0   0 0     0
V:  0    000000    0  0   0 0     0

NFCMD0 NFCMD1 SMPLR LKP1 LKP2 PID QOSPRI MQLBL MPLPRO LUT0PRI CPUCOPY
     0      0     0    0    0   0      0     0      0 0x00000       0
Start/Skip Word: 0x00000000
No Start, Terminate

-----------------------------------------
TAQ-2 Index-226 (A:0,C:0) Valid StartF-0 StartA-0 SkipF-0 SkipA-0
Input IPv6 NFL PACL

Labels  Port   Vlan   L3If   Group
Mask    0x0000 0x0000 0x0000 0x0000
Value   0x0000 0x0000 0x0000 0x0000

vcuResult dstAddr0 dstAddr1 dstAddr2 dstAddr3 srcAddr0
00000000  00000000 00000000 00000000 00000000 00000000
00000000  00000000 00000000 00000000 00000000 00000000

srcAddr1 srcAddr2 srcAddr3 TC HL l3Len fLabel vrfId toUs
00000000 00000000 00000000 00 00  0000  00000  000   0
00000000 00000000 00000000 00 00  0000  00000  000   0

l3Pro mtrId AE FE RE HE MF NFF SO IPOPT RA MEn RMAC DPT TMP l3m
 00    00   0  0  0  0  0   0  0    0   0   0   0    0   0    0
 00    00   0  0  0  0  0   0  0    0   0   0   0    0   0    0

DSE srcPort dstPortIITypeCode tcpFlags IIPresent cZId dstZId
 0   0000    0000      00      00     00     00
 0   0000    0000      00      00     00     00

v6RT AH ESP mREn ReQOS QosLabel PRole VRole  AuthBehaviorTag
M: 0   0   0    0    0      00         0     0 0
V: 0   0   0    0    0      00         0     0 0

   SgEn SgLabel
M:  0    000000
V:  0    000000

NFCMD0 NFCMD1 SMPLR LKP1 LKP2 PID QOSPRI MQLBL MPLPRO LUT0PRI CPUCOPY
     0      0     0    0    0   0      0     0      0 0x00000       0
Start/Skip Word: 0x00000000
No Start, Terminate

-----------------------------------------
TAQ-2 Index-228 (A:0,C:0) Valid StartF-0 StartA-0 SkipF-0 SkipA-0
conversion to string vmr l2p not supported
-----------------------------------------
TAQ-2 Index-230 (A:0,C:0) Valid StartF-0 StartA-0 SkipF-0 SkipA-0
Input MAC NFL PACL

Labels  Port   Vlan   L3If   Group
M:      0000   0000   0000   0000
V:      0000   0000   0000   0000

   arpSrcHwAddr  arpDestHwAddr  arpSrcIpAddr  arpTargetIp  arpOperation
M: 000000000000  000000000000   00000000       00000000     0000
V: 000000000000  000000000000   00000000       00000000     0000


   TRUST  SNOOP  SVALID  DVALID
M:    0     0      0      0
V:    0     0      0      0


   arpHardwareLength  arpHardwareType  arpProtocolLength  arpProtocolType
M:   00000000          00000000            00000000          00000000
V:   00000000          00000000            00000000          00000000


   VlanId l2Encap l2Protocol cosCFI   srcMAC      dstMAC    ISBM  QosLabel
M:  000    0        0000     0     000000000000 000000000000 00     00
V:  000    0        0000     0     000000000000 000000000000 00     00


  ReQOS isSnap  isLLC  AuthBehaviorTag
M:  0     0      0       0
V:  0     0      0        0

NFCMD0 NFCMD1 SMPLR LKP1 LKP2 PID QOSPRI MQLBL MPLPRO LUT0PRI CPUCOPY
     0      0     0    0    0   0      0     0      0 0x00000       0
Start/Skip Word: 0x00000000
No Start, Terminate

-----------------------------------------
フローマスク
show platform software fed switch active|standby|member fnf fmask-entry asic <asic number> entry 1 コマンドを実行し、フローマスクがハードウェアにインストールされていることを確認します。主なフィールドのリストの数も、ここで確認できます。
Switch#show platform software fed switch active fnf fmask-entry asic 1 entry 1

---------------------------------
mask0_valid : 1
Mask hdl0   : 1
Profile ID  : 0
Feature 0   : 148
Fmsk0 RefCnt: 1
Mask M1     :
[511:256] => :00000000 00000000 00000000 00000000 00000000 00000000 00000000 00000000
[255:000] => :FFFFFFFF 00000000 FFFFFFFF 03FF0000 00000000 00FF0000 00000000 C00000FF

Mask M2     :

Key Map     :

Source   Field-Id   Size   NumPFields   Pfields
 002       090       04        01       (0 1 1 1)
 002       091       04        01       (0 1 1 0)
 002       000       01        01       (0 1 0 7)
 000       056       08        01       (0 0 2 4)
 001       011       11        04       (0 0 0 1) (0 0 0 0) (0 1 0 6) (0 0 2 0)
 000       067       32        01       (0 1 12 0)
 000       068       32        01       (0 1 12 2)
フロー統計およびタイムスタンプオフロードデータ
コマンドshow platform software fed switch active fnf flow-record asic <asic number> start-index <index number> num-flows <number of flows> を実行し、タイムスタンプだけでなく、netflowの統計情報も表示します。
Switch#show platform software fed switch active fnf flow-record asic 1 start-index 1 num-flows 1
1 flows starting at 1 for asic 1:-------------------------------------------------
Idx 996 :
{90, ALR_INGRESS_NET_FLOW_ACL_LOOKUP_TYPE1 = 0x01}
{91, ALR_INGRESS_NET_FLOW_ACL_LOOKUP_TYPE2 = 0x01}
{0, ALR_INGRESS_NFL_SPECIAL1 = 0x00}
{56, PHF_INGRESS_L3_PROTOCOL = 0x11}
{11 PAD-UNK = 0x0000}
{67, PHF_INGRESS_IPV4_DEST_ADDRESS = 0xc0a86464}
{68, PHF_INGRESS_IPV4_SRC_ADDRESS = 0xc0a8c864}
FirstSeen = 0x4b2f, LastSeen = 0x4c59, sysUptime = 0x4c9d
PKT Count = 0x000000000102d5df, L2ByteCount = 0x00000000ca371638


Switch#show platform software fed switch active fnf flow-record asic 1 start-index 1 num-flows 1
1 flows starting at 1 for asic 1:-------------------------------------------------
Idx 996 :
{90, ALR_INGRESS_NET_FLOW_ACL_LOOKUP_TYPE1 = 0x01}
{91, ALR_INGRESS_NET_FLOW_ACL_LOOKUP_TYPE2 = 0x01}
{0, ALR_INGRESS_NFL_SPECIAL1 = 0x00}
{56, PHF_INGRESS_L3_PROTOCOL = 0x11}
{11 PAD-UNK = 0x0000}
{67, PHF_INGRESS_IPV4_DEST_ADDRESS = 0xc0a86464}
{68, PHF_INGRESS_IPV4_SRC_ADDRESS = 0xc0a8c864}
FirstSeen = 0x4b2f, LastSeen = 0x4c5b, sysUptime = 0x4c9f
PKT Count = 0x0000000001050682, L2ByteCount = 0x00000000cbed1590
アプリケーションの可視性と制御(AVC)
背景説明
- Application Visibility and Control(AVC)は、Network-Based Recognition Version 2(NBAR2)、NetFlow V9、および各種のレポートと管理ツール(Cisco Prime)を利用するソリューションで、ディープパケットインスペクション(DPI)によってアプリケーションを分類します。
- AVCは、スタンドアロンスイッチまたはスイッチスタックの有線アクセスポートで設定できます。
- AVCは、シスコのワイヤレスコントローラで使用して、DPIに基づいてアプリケーションを特定し、特定のDSCP値でマーキングすることもできます。また、アプリケーションやクライアントに関する帯域幅の使用状況など、さまざまなワイヤレスパフォーマンスメトリックも収集できます。
パフォーマンスと拡張性
パフォーマンス:各スイッチメンバーは、500接続/秒(CPS)を50 %未満のCPU使用率で処理できます。このレートを超えると、AVCサービスは保証されません。
拡張性:24個のアクセスポートあたり最大5,000個の双方向フロー(アクセスポートあたり約200個のフロー)を処理できます。
有線AVCの制限
- AVCと暗号化トラフィック分析(ETA)を同じインターフェイスで同時に設定することはできません。
- パケット分類は、ユニキャストIPv4(TCP/UDP)トラフィックに対してのみサポートされています。
- NBARベースのQoSポリシー設定は、有線物理ポートでのみサポートされます。これには、レイヤ2アクセスポートとトランクポート、およびレイヤ3ルーテッドポートが含まれます。
- NBARベースのQoSポリシー設定は、ポートチャネルメンバー、スイッチ仮想インターフェイス(SVI)、またはサブインターフェイスではサポートされません。
- NBAR2ベースの分類子(一致プロトコル)は、マーキングとポリシングのQoSアクションのみをサポートします。
- 一致プロトコルはすべてのポリシーで255の異なるプロトコルに制限されています(8ビットハードウェアの制限)。
注:これはすべての制限を網羅したリストではありません。ご使用のプラットフォームとコードのバージョンに該当するAVC設定ガイドを参照してください。
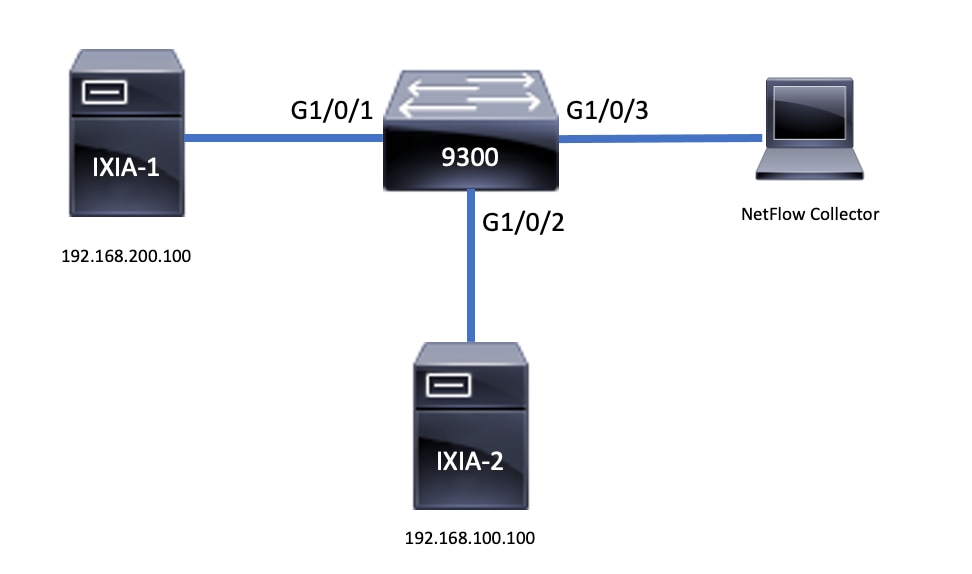
ネットワーク図
コンポーネント
AVCの設定は、ソリューションを構成する3つの主要なコンポーネントで構成されます。
可視性:プロトコル検出
- プロトコル検出は、インターフェイス単位、方向、およびアプリケーションのバイト/パケット統計を提供するNBARによって実現されます。
- 特定のインターフェイスに対して、インターフェイス設定
ip nbar protocol-discoveryを使用してプロトコルディスカバリを有効にします。
出力に示されているように、プロトコルディスカバリを有効にする方法は次のとおりです。
Switch(config)#interface fi4/0/5
Switch(config-if)#ip nbar protocol-discovery
Switch(config-if)#exit

Switch#show run int fi4/0/5
Building configuration...

Current configuration : 70 bytes
!
interface FiveGigabitEthernet4/0/5
ip nbar protocol-discovery
end
制御:アプリケーションベースのQoS
IPアドレスとUDP/TCPポートで一致する従来のQoSと比較すると、AVCはアプリケーションベースのQoSによってより細かい制御を実現します。これにより、アプリケーションで一致させることができ、マーキングやポリシングなどのQoSアクションによってより細かい制御が可能になります。
- アクションは、集約されたトラフィックに対して実行されます(フローごとではありません)。
- アプリケーションベースのQoSは、クラスマップの作成、プロトコルの照合、ポリシーマップの作成によって実現されます。
- アプリケーションベースのQoSポリシーはインターフェイスに適用されます。
出力に示されているように、アプリケーションベースのQoSの設定例は次のとおりです。
Switch(config)#class-map WEBEX
Switch(config-cmap)#match protocol webex-media
Switch(config)#end

Switch(config)#policy-map WEBEX
Switch(config-pmap)#class WEBEX
Switch(config-pmap-c)#set dscp af41
Switch(config)#end

Switch(config)#interface fi4/0/5
Switch(config-if)#service-policy input WEBEX
Switch(config)#end

Switch#show run int fi4/0/5
Building configuration...

Current configuration : 98 bytes
!
interface FiveGigabitEthernet4/0/5
service-policy input WEBEX
ip nbar protocol-discovery
end
アプリケーションベースのFlexible NetFlow
有線AVC FNFは、従来の双方向フローレコードと新しい方向性フローレコードの2種類の定義済みフローレコードをサポートします。
双方向フローレコードにより、クライアント/サーバアプリケーションの統計情報を追跡します。
出力に示すように、双方向フローレコードの設定例。
Switch(config)#flow record BIDIR-1
Switch(config-flow-record)#match ipv4 version
Switch(config-flow-record)#match ipv4 protocol
Switch(config-flow-record)#match application name
Switch(config-flow-record)#match connection client ipv4 address
Switch(config-flow-record)#match connection server ipv4 address
Switch(config-flow-record)#match connection server transport port
Switch(config-flow-record)#match flow observation point
Switch(config-flow-record)#collect flow direction
Switch(config-flow-record)#collect connection initiator
Switch(config-flow-record)#collect connection new-connections
Switch(config-flow-record)#collect connection client counter packets long
Switch(config-flow-record)#connection client counter bytes network long
Switch(config-flow-record)#collect connection server counter packets long
Switch(config-flow-record)#connection server counter bytes network long
Switch(config-flow-record)#collect timestamp absolute first
Switch(config-flow-record)#collect timestamp absolute last
Switch(config-flow-record)#end

Switch#show flow record BIDIR-1
flow record BIDIR-1:
Description: User defined
No. of users: 0
Total field space: 78 bytes
Fields:
match ipv4 version
match ipv4 protocol
match application name
match connection client ipv4 address
match connection server ipv4 address
match connection server transport port
match flow observation point
collect flow direction
collect timestamp absolute first
collect timestamp absolute last
collect connection initiator
collect connection new-connections
collect connection server counter packets long
collect connection client counter packets long
collect connection server counter bytes network long
collect connection client counter bytes network long
ディレクショナルレコードは、入出力のアプリケーション統計です。
出力に示されているように、入力方向レコードと出力方向レコードの設定例は次のとおりです。
注:コマンドmatch interface inputは入力インターフェイスへの一致を指定します。コマンドmatch interface outputは、出力インターフェイスへの一致を指定します。AVCをサポートするには、match application nameコマンドが必須です。
Switch(config)#flow record APP-IN
Switch(config-flow-record)#match ipv4 version
Switch(config-flow-record)#match ipv4 protocol
Switch(config-flow-record)#match ipv4 source address
Switch(config-flow-record)#match ipv4 destination address
Switch(config-flow-record)#match transport source-port
Switch(config-flow-record)#match transport destination-port
Switch(config-flow-record)#match interface input
Switch(config-flow-record)#match application name
Switch(config-flow-record)#collect interface output
Switch(config-flow-record)#collect counter bytes long
Switch(config-flow-record)#collect counter packets long
Switch(config-flow-record)#collect timestamp absolute first
Switch(config-flow-record)#collect timestamp absolute last
Switch(config-flow-record)#end

Switch#show flow record APP-IN
flow record APP-IN:
Description: User defined
No. of users: 0
Total field space: 58 bytes
Fields:
match ipv4 version
match ipv4 protocol
match ipv4 source address
match ipv4 destination address
match transport source-port
match transport destination-port
match interface input
match application name
collect interface output
collect counter bytes long
collect counter packets long
collect timestamp absolute first
collect timestamp absolute last

Switch(config)#flow record APP-OUT
Switch(config-flow-record)#match ipv4 version
Switch(config-flow-record)#match ipv4 protocol
Switch(config-flow-record)#match ipv4 source address
Switch(config-flow-record)#match ipv4 destination address
Switch(config-flow-record)#match transport source-port
Switch(config-flow-record)#match transport destination-port
Switch(config-flow-record)#match interface output
Switch(config-flow-record)#match application name
Switch(config-flow-record)#collect interface input
Switch(config-flow-record)#collect counter bytes long
Switch(config-flow-record)#collect counter packets long
Switch(config-flow-record)#collect timestamp absolute first
Switch(config-flow-record)#collect timestamp absolute last
Switch(config-flow-record)#end

Switch#show flow record APP-OUT
flow record APP-OUT:
Description: User defined
No. of users: 0
Total field space: 58 bytes
Fields:
match ipv4 version
match ipv4 protocol
match ipv4 source address
match ipv4 destination address
match transport source-port
match transport destination-port
match interface output
match application name
collect interface input
collect counter bytes long
collect counter packets long
collect timestamp absolute first
collect timestamp absolute last
フローエクスポータ
エクスポートパラメータを定義するフローエクスポータを作成します。
出力に示されているように、フローエクスポータの設定例は次のとおりです。
Switch(config)#flow exporter AVC
Switch(config-flow-exporter)#destination 192.168.69.2
Switch(config-flow-exporter)#source vlan69
Switch(config-flow-exporter)#end

Switch#show run flow exporter AVC
Current configuration:
!
flow exporter AVC
destination 192.168.69.2
source Vlan69
!
フローモニタ
flow monitorを作成して、フローレコードに関連付けます。
出力に示されているように、フローモニタの設定例は次のとおりです。
Switch(config)#flow monitor AVC-MONITOR
Switch(config-flow-monitor)#record APP-OUT
Switch(config-flow-monitor)#exporter AVC
Switch(config-flow-monitor)#end

Switch#show run flow monitor AVC-MONITOR
Current configuration:
!
flow monitor AVC-MONITOR
exporter AVC
record APP-OUT
フローモニタのインターフェイスへの関連付け
事前定義されたレコードが異なる最大2つの異なるAVCモニタをインターフェイスに同時に接続できます。
出力に示されているように、フローモニタの設定例は次のとおりです。
Switch(config)#interface fi4/0/5
Switch(config-if)#ip flow monitor AVC-MONITOR out
Switch(config-if)#end

Switch#show run interface fi4/0/5
Building configuration...
Current configuration : 134 bytes
!
interface FiveGigabitEthernet4/0/5
ip flow monitor AVC-MONITOR output
service-policy input WEBEX
ip nbar protocol-discovery
end
NBAR2
NBAR2ダイナミックヒットレスプロトコルパックアップグレード
プロトコルパックは、デバイスのシスコソフトウェアを交換することなく、デバイスのNBAR2プロトコルサポートを更新するソフトウェアパッケージです。プロトコルパックには、コンパイルされ、パックされたNBAR2によって正式にサポートされているアプリケーションに関する情報が含まれています。 アプリケーションごとに、プロトコルパックにはアプリケーションシグニチャとアプリケーション属性に関する情報が含まれます。各ソフトウェアリリースには、組み込みのプロトコルパックがバンドルされています。
- NBAR2は、トラフィックやサービスを中断することなく、またデバイスのソフトウェアイメージを変更することなく、プロトコルパケットを更新する方法を提供します。
- NBAR2プロトコルパケットは、NBAR2 Protocol Pack LibraryにあるCisco Software Centerからダウンロードできます。
NBAR2プロトコルパックアップグレード
新しいプロトコルパックをインストールする前に、プロトコルパケットをすべてのスイッチのフラッシュにコピーする必要があります。 新しいプロトコルパックをロードするには、コマンドip nbar protocol-pack flash:<Pack Name>を使用します。
NBAR2のアップグレードを行うためにスイッチをリロードする必要はありません。
出力に示されているように、NBAR2 Protocol Packをロードする方法の設定例は次のとおりです。
Switch(config)#ip nbar protocol-pack flash:newProtocolPack
組み込みのProtocol Packに戻すには、コマンドdefault ip nbar protocol-packを使用します。
出力に示されているように、組み込みのProtocol Packに戻す方法の設定例は次のとおりです。
Switch(config)#default ip nbar protocol-packNBAR2プロトコルパック情報の表示
Protocol Pack情報を表示するには、次のコマンドを使用します。
show ip nbar version(隠しコマンド)show ip nbar protocol-pack active detail(ベータ版)
出力に示されているように、これらのコマンドの出力例は次のとおりです。
Switch#show ip nbar version
NBAR software version: 37
NBAR minimum backward compatible version: 37
NBAR change ID: 293126

Loaded Protocol Pack(s):
Name: Advanced Protocol Pack
Version: 43.0
Publisher: Cisco Systems Inc.
NBAR Engine Version: 37
State: Active

Switch#show ip nbar protocol-pack active detail
Active Protocol Pack:
Name: Advanced Protocol Pack
Version: 43.0
Publisher: Cisco Systems Inc.
NBAR Engine Version: 37
State: Active
NBAR2カスタムアプリケーション
NBAR2は、カスタムプロトコルを使用したカスタムアプリケーションの識別をサポートします。カスタムプロトコルは、NBAR2が現在サポートしていないプロトコルとアプリケーションをサポートします。
これには、次のものが含まれます。
- 組織への特定の適用
- 地域に固有のアプリケーション
NBAR2では、コマンドip nbar custom <myappname>を使用してアプリケーションを手動でカスタマイズできます。
注:カスタムアプリケーションは、組み込みプロトコルよりも優先されます
アプリケーションのカスタマイズにはさまざまなタイプがあります。
汎用プロトコルカスタマイズ
- HTTP
- SSL
- DNS
複合:複数のプロトコル(server-name)に基づくカスタマイズ。
レイヤ3/レイヤ4のカスタマイズ
-
IPv4 アドレス
-
DSCP値
-
TCP/UDPポート
-
フローの送信元または宛先の方向
バイトオフセット:ペイロードの特定のバイト値に基づくカスタマイズ
HTTPのカスタマイズ
HTTPのカスタマイズは、次のHTTPフィールドの組み合わせに基づいて行うことができます。
-
cookie - HTTPクッキー
-
host – リソースを含む元のサーバのホスト名
-
method - HTTPメソッド
-
referrer – リソース要求が取得されたアドレス
-
url - Uniform Resource Locatorのパス
-
user-agent:要求を送信するエージェントによって使用されるソフトウェア
-
version:HTTPバージョン
-
via:HTTP viaフィールド
HTTPホスト*mydomain.comとセレクタID 10を使用するMYHTTPという名前のカスタムアプリケーションの例。
Switch(config)#ip nbar custom MYHTTP http host *mydomain.com id 10
SSLのカスタマイズ
SSL暗号化トラフィックのカスタマイズは、SSLサーバ名表示(SNI)または共通名(CN)から抽出された情報を使用して実行できます。
セレクタIDが11でSSLの一意の名前mydomain.comを使用するMYSSLという名前のカスタムアプリケーションの例。
Switch(config)#ip nbar custom MYSSL ssl unique-name *mydomain.com id 11
DNSのカスタマイズ
NBAR2はDNS要求および応答トラフィックを調べ、DNS応答をアプリケーションに関連付けることができます。DNS応答から返されたIPアドレスはキャッシュされ、その特定のアプリケーションに関連付けられた以降のパケットフローに使用されます。
コマンドip nbar customapplication-namedns domain-nameidapplication-id は、DNSのカスタマイズに使用されます。アプリケーションを拡張するには、コマンドip nbar custom application-name dns domain-name domain-name extends existing-applicationを使用します。
MYDNSという名前のカスタムアプリケーションの例。このアプリケーションは、DNSドメイン名mydomain.com、セレクタID 12を使用します。
Switch(config)#ip nbar custom MYDNS dns domain-name *mydomain.com id 12
複合カスタマイズ
NBAR2は、HTTP、SSL、またはDNSに表示されるドメイン名に基づいてアプリケーションをカスタマイズする方法を提供します。
HTTP、SSL、またはDNSドメイン名mydomain.com、セレクタID 13を使用するMYDOMAINという名前のカスタムアプリケーションの例。
L3/L4カスタマイズ
レイヤ3/レイヤ4のカスタマイズはパケットタプルに基づいており、常にフローの最初のパケットと照合されます。
IPアドレス10.56.1.10および10.56.1.11、セレクタID 14のTCPおよびDSCP efに一致するカスタムアプリケーションLAYER4CUSTOMの例。
Switch(config)#ip nbar custom LAYER4CUSTOM transport tcp id 14
Switch(config-custom)#ip address 10.56.1.10 10.56.1.11
Switch(config-custom)#dscp ef
Switch(config-custom)#end
カスタムアプリケーションの監視
カスタムアプリケーションをモニタするには、次に示すshowコマンドを使用します。
show ip nbar protocol-id | incカスタム
Switch#show ip nbar protocol-id | inc Custom
LAYER4CUSTOM             14            Custom
MYDNS                    12            Custom
MYDOMAIN                 13            Custom
MYHTTP                   10            Custom
MYSSL                    11            Custom
show ip nbar protocol-id CUSTOM_APP(隠しコマンド)
Switch#show ip nbar protocol-id MYSSL
Protocol Name             id            type
----------------------------------------------
MYSSL                    11            Custom
AVCの確認
AVCの機能を検証するには、複数の手順があります。このセクションでは、コマンドと出力例を示します。
NBARがアクティブであることを検証するには、コマンドshow ip nbar control-planeを実行します。
主な分野:
- NBARの状態を正しいシナリオでアクティブにする必要があります。
- 正しいシナリオでは、NBARの設定状態がreadyになっている必要があります。
Switch#show ip nbar control-plane
NGCP Status:
============

graph sender info:
NBAR state is ACTIVATED
NBAR config send mode is ASYNC
NBAR config state is READY

NBAR update ID 3
NBAR batch ID ACK 3
NBAR last batch ID ACK clients 1 (ID: 4)
Active clients 1 (ID: 4)
NBAR max protocol ID ever 1935
NBAR Control-Plane Version: 37

<snip>
コマンドshow platform software fed switch active|standby|member wdavc function wdavc_stile_cp_show_info_uiを使用して、各スイッチメンバにアクティブなデータプレーンがあることを検証します。
DP activatedは、正しいシナリオではTRUEである必要があります。
Switch#show platform software fed switch active wdavc function wdavc_stile_cp_show_info_ui

Is DP activated : TRUE
MSG ID : 3
Maximum number of flows: 262144
Current number of graphs: 1
Requests queue state : WDAVC_STILE_REQ_QUEUE_STATE_UP
Number of requests in queue : 0
Max number of requests in queue (TBD): 1
Counters:
activate_msgs_rcvd : 1
graph_download_begin_msgs_rcvd : 3
stile_config_msgs_rcvd : 1584
graph_download_end_msgs_rcvd : 3
deactivate_msgs_rcvd : 0
intf_proto_disc_msgs_rcvd : 1
intf_attach_msgs_rcvd : 2
cfg_response_msgs_sent : 1593
num_of_handle_msg_from_fmanfp_events : 1594
num_of_handle_request_from_queue : 1594
num_of_handle_process_requests_events : 1594
コマンドshow platform software fed switch active|standby|member wdavc フローを使用して、重要な情報を表示します。
Switch#show platform software fed switch active wdavc flows

CurrFlows=1, Watermark=1

IX |IP1           |IP2           |PORT1|PORT2|L3   |L4   |VRF |TIMEOUT|APP     |TUPLE|FLOW     |IS FIF  |BYPASS|FINAL |#PKTS |BYPASS
   |              |              |     |     |PROTO|PROTO|VLAN|SEC    |NAME    |TYPE |TYPE     |SWAPPED |      |      |      |PKT
--------------------------------------------------------------------------------------
1  |192.168.100.2 |192.168.200.2 |68   |67   |1    |17   |0   |360    |unknown |Full |Real Flow|Yes     |True |True   |40    |40
キーフィールド:
CurrFlows:AVCによって追跡されるアクティブフローの数を示します。
ウォーターマーク:AVCによって履歴管理されたフローの最大数を示します。
TIMEOUT SEC:指定されたアプリケーションに基づく非アクティブタイムアウト。
アプリケーション名:特定されたアプリケーション
FLOW TYPE: Real Flowは、インバウンドデータの結果として作成されたことを示します。Pre Flowは、このフローが着信データの結果として作成されることを示します。プレフローは、予想されるメディアフローに使用されます。
TUPLE TYPE:実際のフローは常に完全なタプルです。プレフローは、完全なタプルまたは半分のタプルです。
BYPASS:TRUEに設定すると、このフローを識別するためにソフトウェアでこれ以上パケットが必要ないことを示します。
FINAL: TRUEに設定すると、アプリケーションはこのフローに対してこれ以上変更されません。
BYPASS PKT:最終的な分類に到達するために必要なパケット数。
#PKTS:このフローで実際にソフトウェアにパントされたパケット数。
現在のフローに関するその他の詳細を表示します。コマンドshow platform software fed switch active wdavc function wdavc_ft_show_all_flows_seg_uiを使用できます。
Switch#show platform software fed switch active wdavc function wdavc_ft_show_all_flows_seg_ui
CurrFlows=1, Watermark=1

IX |IP1           |IP2          |PORT1|PORT2|L3   |L4   |VRF |TIMEOUT|APP     |TUPLE |FLOW     |IS FIF  |BYPASS|FINAL |#PKTS |BYPASS
   |              |             |     |     |PROTO|PROTO|VLAN|SEC    |NAME    |TYPE  |TYPE     |SWAPPED |      |      |      |PKT
---------------------------------------------------------------------------------------------------------------------------------------------------------------------
1  |192.168.100.2 |192.168.200.2|68   |67   |1    |17   |0   |360    |unknown |Full  |Real Flow|Yes     |True  |True  |40    |40

   SEG IDX |I/F ID |OPST I/F |SEG DIR |FIF DIR |Is SET |DOP ID |NFL HDL  |BPS PND |APP PND |FRST TS  |LAST TS  |BYTES   |PKTS  |TCP FLGS
   ------------------------------------------------------------------------------------------------------------------------------------
   0       |9      |----     |Ingress |True    |True   |0      |50331823 |0       |0       |177403000|191422000|24252524|70094 |0
キーフィールド
I/F ID:インターフェイスIDを指定します。
SEG DIR:出力方向の入力を指定します。
FIF DIR:これがフローイニシエータの方向かどうかを決定します。
NFL HDL:ハードウェアのフローID。
ハードウェアのエントリを表示するには、コマンドshow platform software fed switch active fnf flow-record asic <number> start-index <number> num-flows <number of flows>を実行します。
注:ASICを選択するには、ポートがマッピングされているASICインスタンスを選択します。ASICを識別するには、コマンドshow platform software fed switch active|standby|member ifm mappingsを使用します。 特定のフローを調べない場合は、start-indexを0に設定できます。それ以外の場合は、start-indexを指定する必要があります。num-flowsには、表示可能なフローの数(最大10)を指定します。
Switch#show platform software fed switch active fnf flow-record asic 3 start-index 0 num-flows 1
1 flows starting at 0 for asic 3:-------------------------------------------------
Idx 175 :
{90, ALR_INGRESS_NET_FLOW_ACL_LOOKUP_TYPE1 = 0x01}
{91, ALR_INGRESS_NET_FLOW_ACL_LOOKUP_TYPE2 = 0x01}
{0, ALR_INGRESS_NFL_SPECIAL1 = 0x00}
{11 PAD-UNK = 0x0000}
{94, PHF_INGRESS_DEST_PORT_OR_ICMP_OR_IGMP_OR_PIM_FIRST16B = 0x0043}
{93, PHF_INGRESS_SRC_PORT = 0x0044}
{67, PHF_INGRESS_IPV4_DEST_ADDRESS = 0xc0a8c802}
{68, PHF_INGRESS_IPV4_SRC_ADDRESS = 0xc0a86402}
{56, PHF_INGRESS_L3_PROTOCOL = 0x11}
FirstSeen = 0x2b4fb, LastSeen = 0x2eede, sysUptime = 0x2ef1c
PKT Count = 0x000000000001216f, L2ByteCount = 0x0000000001873006
データパス内のさまざまなエラーと警告を探す
コマンドshow platform software fed switch active|standby|member wdavc function wdavc_ft_show_stats_ui | inc err|warn|fail to view potential flow table errors:
Switch#show platform software fed switch active wdavc function wdavc_ft_show_stats_ui | inc err|warn|fail
Bucket linked exceed max error : 0
extract_tuple_non_first_fragment_warn : 0
ft_client_err_alloc_fail : 0
ft_client_err_detach_fail : 0
ft_client_err_detach_fail_intf_attach : 0
ft_inst_nfl_clock_sync_err : 0
ft_ager_err_invalid_timeout : 0
ft_intf_err_alloc_fail : 0
ft_intf_err_detach_fail : 0
ft_inst_err_unreg_client_all : 0
ft_inst_err_inst_del_fail : 0
ft_flow_seg_sync_nfl_resp_pend_del_warn : 0
ager_sm_cb_bad_status_err : 0
ager_sm_cb_received_err : 0
ft_ager_to_time_no_mask_err : 0
ft_ager_to_time_latest_zero_ts_warn : 0
ft_ager_to_time_seg_zero_ts_warn : 0
ft_ager_to_time_ts_bigger_curr_warn : 0
ft_ager_to_ad_nfl_resp_error : 0
ft_ager_to_ad_req_all_recv_error : 0
ft_ager_to_ad_req_error : 0
ft_ager_to_ad_resp_error : 0
ft_ager_to_ad_req_restart_timer_due_err : 0
ft_ager_to_flow_del_nfl_resp_error : 0
ft_ager_to_flow_del_all_recv_error : 0
ft_ager_to_flow_del_req_error : 0
ft_ager_to_flow_del_resp_error : 0
ft_consumer_timer_start_error : 0
ft_consumer_tw_stop_error : 0
ft_consumer_memory_error : 0
ft_consumer_ad_resp_error : 0
ft_consumer_ad_resp_fc_error : 0
ft_consumer_cb_err : 0
ft_consumer_ad_resp_zero_ts_warn : 0
ft_consumer_ad_resp_zero_pkts_bytes_warn : 0
ft_consumer_remove_on_count_zero_err : 0
ft_ext_field_ref_cnt_zero_warn : 0
ft_ext_gen_ref_cnt_zero_warn : 0
show platform software fed switch active wdavc function wdavc_stile_stats_show_ui | inc err コマンドを使用して、潜在的なNBARエラーを表示します。
Switch#show platform software fed switch active wdavc function wdavc_stile_stats_show_ui | inc err
find_flow_error : 0
add_flow_error : 0
remove_flow_error : 0
detach_fo_error : 0
is_forward_direction_error : 0
set_flow_aging_error : 0
ft_process_packet_error : 0
sys_meminfo_get_error : 0
パケットがCPUに複製されていることの確認
show platform software fed switch active punt cpuq 21 | inc receivedコマンドを使用し、パケットがNBAR処理のためにCPUに複製されていることを確認します。
注:ラボでは、この数値は増加しませんでした。
Switch#show platform software fed switch active punt cpuq 21 | inc received
Packets received from ASIC : 63
CPUの輻輳の特定
輻輳時には、パケットはWDAVCプロセスに送信される前にドロップされる可能性があります。show platform software fed switch active wdavc function fed_wdavc_show_ots_stats_uto validateコマンドを使用します。
Switch#show platform software fed switch active wdavc function fed_wdavc_show_ots_stats_ui
OTS Limits
----------------------------------------------
ots_queue_max : 20000
emer_bypass_ots_queue_stress : 4000
emer_bypass_ots_queue_normal : 200
OTS Statistics
----------------------------------------------
total_requests : 40
total_non_wdavc_requests : 0
request_empty_field_data_error : 0
request_invalid_di_error : 0
request_buf_coalesce_error : 0
request_invalid_format_error : 0
request_ip_version_error : 0
request_empty_packet_error : 0
memory_allocation_error : 0
emergency_bypass_requests_warn : 0
dropped_requests : 0
enqueued_requests : 40
max_ots_queue : 0
ヒント:パントドロップカウンタをクリアするには、show platform software fed switch active wdacc function fed_wdacc_clear_ots_stats_uiコマンドを使用します。
スケールの問題の特定
ハードウェアに空きのFNFエントリがない場合、トラフィックはNBAR2分類の対象にはなりません。show platform software fed switch active fnf sw-table-sizes asic <number> shadow 0 コマンドを使用して、次の点を確認します。
注:作成されるフローは、作成時にスイッチとASICコアに固有です。スイッチ番号(アクティブ、スタンバイなど)を適宜指定する必要があります。入力されるASIC番号はそれぞれのインターフェイスに結び付けられています。show platform software fed switch active|standby|member ifm mappingsを使用して、インターフェイスに対応するASICを判別します。shadowオプションの場合は、常に0を使用してください。
Switch#show platform software fed switch active fnf sw-table-sizes asic 3 shadow 0

---------------------------------
Global Bank Allocation
---------------------------------
Ingress Banks : Bank 0
Egress Banks : Bank 1
---------------------------------
Global flow table Info
INGRESS usedBankEntry 1 usedOvfTcamEntry 0
EGRESS usedBankEntry 0 usedOvfTcamEntry 0 <-- 256 means TCAM entries are full
---------------------------------
Flows Statistics
INGRESS TotalSeen=1 MaxEntries=1 MaxOverflow=0
EGRESS TotalSeen=0 MaxEntries=0 MaxOverflow=0

---------------------------------
Partition Table
---------------------------------
## Dir  Limit CurrFlowCount OverFlowCount MonitoringEnabled
 0 ING      0         0             0           0
 1 ING  16640         1             0           1
 2 ING      0         0             0           0
 3 ING  16640         0             0           0
 4 ING      0         0             0           0
 5 ING   8192         0             0           1
 6 ING      0         0             0           0
 7 ING      0         0             0           0
 8 ING      0         0             0           0
 9 ING      0         0             0           0
10 ING      0         0             0           0
11 ING      0         0             0           0
12 ING      0         0             0           0
13 ING      0         0             0           0
14 ING      0         0             0           0
15 ING      0         0             0           0
 0 EGR      0         0             0           0
 1 EGR  16640         0             0           1
 2 EGR      0         0             0           0
 3 EGR  16640         0             0           0
 4 EGR      0         0             0           0
 5 EGR   8192         0             0           1
 6 EGR      0         0             0           0
 7 EGR      0         0             0           0
 8 EGR      0         0             0           0
 9 EGR      0         0             0           0
10 EGR      0         0             0           0
11 EGR      0         0             0           0
12 EGR      0         0             0           0
13 EGR      0         0             0           0
14 EGR      0         0             0           0
15 EGR      0         0             0           0
暗号化トラフィック分析(ETA)
背景説明
- ETAでは、パッシブモニタリング、関連データ要素の抽出、および行動モデリングと機械学習とクラウドベースのグローバルセキュリティの組み合わせにより、暗号化されたトラフィック内のマルウェア通信の特定に重点を置いています。
- ETAは、NetFlowのテレメトリに加え、暗号化されたマルウェア検出と暗号化コンプライアンスを利用して、このデータをCisco Stealthwatchに送信します。
- ETAは、初期データパケット(IDP)とパケット長と時間のシーケンス(SPLT)の2つの主要なデータ要素を抽出します。
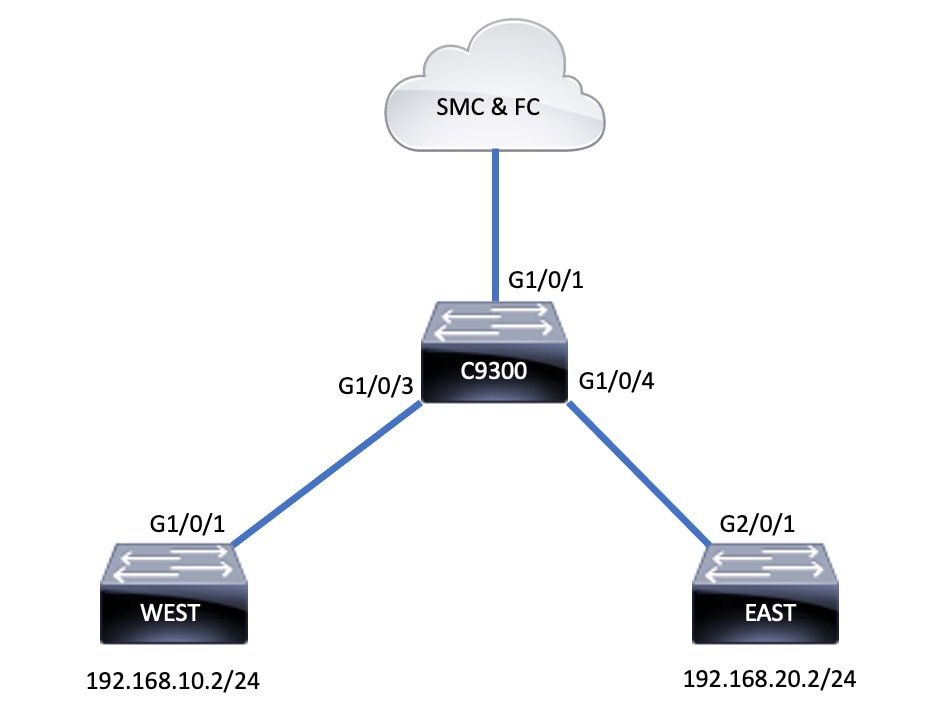
ネットワーク図
コンポーネント
ETAは、ETAソリューションの作成に使用される複数の異なるコンポーネントで構成されています。
- NetFlow:ネットワークデバイスによってエクスポートされる、ネットワーク上のフローを記述するデータ要素を定義する標準。
- Cisco StealthWatch:NetFlow、IPFIX、プロキシログ、rawパケットのディープパケットインスペクションなどのネットワークテレメトリの機能を活用して、高度なネットワークの可視性、セキュリティインテリジェンス、分析を提供します。
- Cisco Cognitive Intelligence:セキュリティ制御をバイパスした、または監視されていないチャネルを通じて組織環境内に入った悪意のあるアクティビティを検出します。
- 暗号化トラフィック分析:高度な動作アルゴリズムを使用して、暗号化トラフィックのインフラストラクチャメタデータの分析により悪意のあるトラフィックパターンを特定するCisco IOS XE機能は、暗号化トラフィックに潜む潜在的な脅威を検出します。
注:このセクションでは、Catalyst 9000シリーズスイッチでのETAおよびNetFlowの設定と検証のみを扱います。Cognitive Intelligence CloudへのStealthWatch Management Console(SMC)およびFlow Collector(FC)の導入については扱いません。
制約事項
- ETAの導入にはCisco DNA Advantageが必要
- ETAと送信(TX)スイッチドポートアナライザ(SPAN)は、同じインターフェイスではサポートされていません。
これは包括的なリストではありません。すべての制限事項については、該当するスイッチおよびコードのバージョンのコンフィギュレーションガイドを参照してください。
コンフィギュレーション
出力に示されているように、スイッチでETAをグローバルに有効にし、フローエクスポートの宛先を定義します。
C9300(config)#et-analytics
C9300(config-et-analytics)#ip flow-export destination 172.16.18.1 2055
ヒント:ポート2055を使用する必要があります。他のポート番号は使用しないでください。
次に、出力に示されているようにFlexible NetFlowを設定します。
フローレコードの設定
C9300(config)#flow record FNF-RECORD
C9300(config-flow-record)#match ipv4 protocol
C9300(config-flow-record)#match ipv4 source address
C9300(config-flow-record)#match ipv4 destination address
C9300(config-flow-record)#match transport source-port
C9300(config-flow-record)#match transport destination-port
C9300(config-flow-record)#collect counter bytes long
C9300(config-flow-record)#collect counter packets long
C9300(config-flow-record)#collect timestamp absolute first
C9300(config-flow-record)#collect timestamp absolute last
フローモニタの設定
C9300(config)#flow exporter FNF-EXPORTER
C9300(config-flow-exporter)#destination 172.16.18.1
C9300(config-flow-exporter)#transport udp 2055
C9300(config-flow-exporter)#template data timeout 30
C9300(config-flow-exporter)#option interface-table
C9300(config-flow-exporter)#option application-table timeout 10
C9300(config-flow-exporter)#exit
フローレコードの設定
C9300(config)#flow monitor FNF-MONITOR
C9300(config-flow-monitor)#exporter FNF-EXPORTER
C9300(config-flow-monitor)#record FNF-RECORD
C9300(config-flow-monitor)#end
フローモニタの適用
C9300(config)#int range g1/0/3-4
C9300(config-if-range)#ip flow mon FNF-MONITOR in
C9300(config-if-range)#ip flow mon FNF-MONITOR out
C9300(config-if-range)#end
スイッチインターフェイスでETAを有効にします。
C9300(config)#interface range g1/0/3-4
C9300(config-if-range)#et-analytics enable
確認
ETAモニタ(eta-mon)がアクティブであることを確認します。show flow monitor eta-monコマンドを使用して、ステータスが割り当てられていることを確認します。
C9300#show flow monitor eta-mon
Flow Monitor eta-mon:
Description: User defined
Flow Record: eta-rec
Flow Exporter: eta-exp
Cache:
Type: normal (Platform cache)
Status: allocated
Size: 10000 entries
Inactive Timeout: 15 secs
Active Timeout: 1800 secs
ETAキャッシュにデータが入力されていることを確認します。NetFlowとETAが同じインターフェイス上で設定されている場合、show flow monitor eta-mon cache の出力ではなく、show flow monitor <monitor name> cacheを使用してください は空です:
C9300#show flow monitor FNF-MONITOR cache
Cache type: Normal (Platform cache)
Cache size: 10000
Current entries: 4

Flows added: 8
Flows aged: 4
- Inactive timeout ( 15 secs) 4

IPV4 SOURCE ADDRESS: 192.168.10.2
IPV4 DESTINATION ADDRESS: 192.168.20.2
TRNS SOURCE PORT: 0
TRNS DESTINATION PORT: 0
IP PROTOCOL: 1
counter bytes long: 500
counter packets long: 5
timestamp abs first: 21:53:23.390
timestamp abs last: 21:53:23.390

IPV4 SOURCE ADDRESS: 192.168.20.2
IPV4 DESTINATION ADDRESS: 192.168.10.2
TRNS SOURCE PORT: 0
TRNS DESTINATION PORT: 0
IP PROTOCOL: 1
counter bytes long: 500
counter packets long: 5
timestamp abs first: 21:53:23.390
timestamp abs last: 21:53:23.390

IPV4 SOURCE ADDRESS: 192.168.20.2
IPV4 DESTINATION ADDRESS: 192.168.10.2
TRNS SOURCE PORT: 0
TRNS DESTINATION PORT: 0
IP PROTOCOL: 1
counter bytes long: 500
counter packets long: 5
timestamp abs first: 21:53:23.390
timestamp abs last: 21:53:23.390

IPV4 SOURCE ADDRESS: 192.168.10.2
IPV4 DESTINATION ADDRESS: 192.168.20.2
TRNS SOURCE PORT: 0
TRNS DESTINATION PORT: 0
IP PROTOCOL: 1
counter bytes long: 500
counter packets long: 5
timestamp abs first: 21:53:23.390
timestamp abs last: 21:53:23.390
show flow exporter eta-exp statisticsコマンドを使用して、フローがSMCおよびFCに向けてエクスポートされていることを確認します。
C9300#show flow exporter eta-exp statistics
Flow Exporter eta-exp:
Packet send statistics (last cleared 03:05:32 ago):
Successfully sent: 3 (3266 bytes)

Client send statistics:
Client: Flow Monitor eta-mon
Records added: 4
- sent: 4
Bytes added: 3266
- sent: 3266
show platform software fed switch active fnf et-analytics-flowsコマンドを使用して、SPLTとIDPがFCにエクスポートされていることを確認します。
C9300#show platform software fed switch active fnf et-analytics-flows

ET Analytics Flow dump

=================
Total packets received : 20
Excess packets received : 0
Excess syn received : 0
Total eta records added : 4
Current eta records : 0
Total eta splt exported : 2
Total eta IDP exported : 2
show platform software et-analytics interfacesコマンドを使用して、et-analyticsが設定されているインターフェイスを検証します。
C9300#show platform software et-analytics interfaces
ET-Analytics interfaces
GigabitEthernet1/0/3
GigabitEthernet1/0/4

ET-Analytics VLANs
show platform software et-analytics globalコマンドを使用して、ETAのグローバル状態を表示します。
C9300#show plat soft et-analytics global
ET-Analytics Global state
=========================
All Interfaces : Off
IP Flow-record Destination : 10.31.126.233 : 2055
Inactive timer : 15

ET-Analytics interfaces
GigabitEthernet1/0/3
GigabitEthernet1/0/4

ET-Analytics VLANs
更新履歴
| 改定 | 発行日 | コメント |
|---|---|---|
3.0 |
13-Nov-2025
|
シスコのガイドラインに従って書式を更新。 |
2.0 |
19-Dec-2023
|
再認定 |
1.0 |
07-Oct-2022
|
初版 |
シスコ エンジニア提供
- ネイサン・パンカスタマーデリバリエンジニアリングテクニカルリーダー
- リチャード・ファー主任エンジニア
 フィードバック
シスコに問い合わせ
- サポート ケースをオープン

- (シスコ サービス契約が必要です。)