- About This Guide
- Ultra M Overview
- Hardware Specifications
- Software Specifications
- Networking Overview
- Deploying the Ultra M Solution
- Event and Syslog Management Within the Ultra M Solution
- Network Definitions (Layer 2 and 3)
- Example ultram_cfg.yaml File
- Ultra M MIB
- Ultra M Component Event Severity and Fault Code Mappings
- Ultra M Troubleshooting
- Using the UCS Utilities Within the Ultra M Manager
- ultram_ucs_utils.py Help
Ultra M Solutions Guide, Release 5.8
Bias-Free Language
The documentation set for this product strives to use bias-free language. For the purposes of this documentation set, bias-free is defined as language that does not imply discrimination based on age, disability, gender, racial identity, ethnic identity, sexual orientation, socioeconomic status, and intersectionality. Exceptions may be present in the documentation due to language that is hardcoded in the user interfaces of the product software, language used based on RFP documentation, or language that is used by a referenced third-party product. Learn more about how Cisco is using Inclusive Language.
- Updated:
- November 29, 2017
Chapter: Event and Syslog Management Within the Ultra M Solution
Event and Syslog Management Within the Ultra M Solution
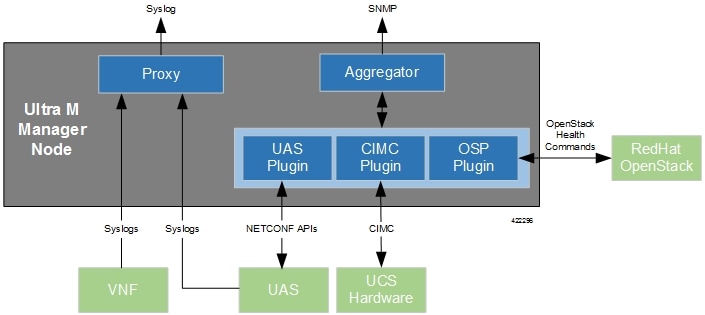
Hyper-Converged Ultra M solution models support a centralized monitor and management function. This function provides a central aggregation point for events (faults and alarms) and a proxy point for syslogs generated by the different components within the solution as identified in Table 1. This monitor and management function runs on the Ultra M Manager Node.
The software to enable this functionality is distributed as a both a stand-alone RPM and as part of the Ultra Services Platform (USP) release ISO as described in Install the Ultra M Manager RPM. Once installed, additional configuration is required based on the desired functionality as described in the following sections:
- Syslog Proxy
- Event Aggregation
- Install the Ultra M Manager RPM
- Restarting the Ultra M Manager Service
- Uninstalling the Ultra M Manager
- Encrypting Passwords in the ultram_cfg.yaml File
Syslog Proxy
The Ultra M Manager Node can be configured as a proxy server for syslogs received from UCS servers and/or OpenStack. As a proxy, the Ultra M Manager Node acts a single logging collection point for syslog messages from these components and relays them to a remote collection server.
NOTES:
This functionality is currently supported only with Ultra M deployments based on OSP 10 and that leverage the Hyper-Converged architecture.
.-
You must configure a remote collection server to receive and filter log files sent by the Ultra M Manager Node.
-
Though you can configure syslogging at any severity level your deployment scenario requires, it is recommended that you only configure syslog levels with severity levels 0 (emergency) through 4 (warning).
Once the Ultra M Manager RPM is installed, a script provided with this release allows you to quickly enable syslog on the nodes and set the Ultra M Manager as the proxy. Leveraging inputs from a YAML-based configuration file, the script:
-
Inspects the nodes within the Undercloud and Overcloud
-
Logs on to each node
-
Enables syslogging at the specified level or both the UCS hardware and for OpenStack
-
Sets the Ultra M Manager Node’s address as the syslog proxy
 Note | The use of this script assumes that all of the nodes use the same login credentials. |
To enable this functionality:
-
Install the Ultra M Manager bundle RPM using the instructions in Install the Ultra M Manager RPM.
Note
This step is not needed if the Ultra M Manager bundle was previously installed. -
Become the root user.
sudo -i -
Verify that there are no previously existing configuration files for logging information messages in /etc/rsyslog.d.
-
Navigate to /etc/rsyslog.d.
cd /etc/rsyslog.d
ls -al
Example output:
total 24
drwxr-xr-x.   2 root root  4096 Sep  3 23:17 .
drwxr-xr-x. 152 root root 12288 Sep  3 23:05 ..
-rw-r--r--.   1 root root    49 Apr 21 00:03 listen.conf
-rw-r--r--.   1 root root   280 Jan 12  2017 openstack-swift.conf
-
Check the listen.conf file.
cat listen.confExample output:
$SystemLogSocketName /run/systemd/journal/syslog
-
Check the configuration of the openstack-swift.conf.
cat openstack-swift.confExample configuration:
# LOCAL0 is the upstream default and LOCAL2 is what Swift gets in
# RHOS and RDO if installed with Packstack (also, in docs).
# The breakout action prevents logging into /var/log/messages, bz#997983.
local0.*;local2.* /var/log/swift/swift.log
& stop
-
-
Enable syslogging to the external server by configuring the /etc/rsyslog.conf file.
vi /etc/rsyslog.conf-
Enable TCP/UDP reception.
# provides UDP syslog reception
$ModLoad imudp
$UDPServerRun 514

# provides TCP syslog reception
$ModLoad imtcp
$InputTCPServerRun 514
-
Disable logging for private authentication messages.
# Don't log private authentication messages! #*.info;mail.none;authpriv.none;cron.none /var/log/messages -
Configure the desired log severity levels.
# log 0-4 severity logs to external server 172.21.201.53
*.4,3,2,1,0   @<external_syslog_server_ipv4_address>:514
This enables the collection and reporting of logs with severity levels 0 (emergency) through 4 (warning).

Caution
Though it is possible to configure the system to locally store syslogs on the Ultra M Manager, it is highly recommended that you avoid doing so to avoid the risk of data loss and to preserve disk space.
-
-
Restart the syslog server.
service rsyslog restart -
Navigate to /etc.
cd /etc -
Create and edit the syslogs.yaml file based your VIM Orchestrator and VIM configuration. A sample of this configuration file is provided in Example ultram_cfg.yaml File.
Note
The ultram_cfg.yaml file pertains to both the syslog proxy and event aggregation functionality. Some parts of this file’s configuration overlap and may have been configured in relation to the other function.vi ultram_cfg.yaml-
Optional. Configure your Undercloud settings if they are not already configured.
under-cloud:
  OS_AUTH_URL: <auth_url>
  OS_USERNAME: admin
  OS_TENANT_NAME: <tenant_name>
  OS_PASSWORD: <admin_user_password>
  ssh-key: /opt/cisco/heat_admin_ssh_key
-
Optional. Configure your Overcloud settings if they are not already configured.
over-cloud:
  enabled: true
  environment:
    OS_AUTH_URL: <auth_url>
    OS_TENANT_NAME: <tenant_name>
    OS_USERNAME: <user_name>
    OS_PASSWORD: <user_password>
    OS_ENDPOINT_TYPE: publicURL
    OS_IDENTITY_API_VERSION: 2
    OS_REGION_NAME: regionOne
-
Specify the IP address of the Ultra M Manager Node to be the proxy server.
<-- SNIP -->
rsyslog:
  level: 4,3,2,1,0
  proxy-rsyslog: <ultram_manager_address>
Note
-
You can modify the syslog levels to report according to your requirements using the level parameter as shown above.
-
<ultram_manager_address> is the internal IP address of the Ultra M Manager Node reachable by OpenStack and the UCS servers.
-
If you are copying the above information from an older configuration, make sure the proxy-rsyslog IP address does not contain a port number.
-
-
Optional. Configure the CIMC login information for each of the nodes on which syslogging is to be enabled.
ucs-cluster:
  enabled: true
  user: <username>
  password: <password>
Note
The use of this script assumes that all of the nodes use the same login credentials.
-
-
Navigate to /opt/cisco/usp/ultram-health.
cd /opt/cisco/usp/ultram-health -
Optional. Disable rsyslog if it was previously configured on the UCS servers.
./ultram_syslogs.py --cfg /etc/ultram_cfg.yaml –u -d -
Execute the ultram_syslogs.py script to load the configuration on the various nodes.
./ultram_syslogs.py --cfg /etc/ultram_cfg.yaml -o –u
Note
Additional command line options for the ultram_syslogs.py script can be seen by entering ultram_syslogs.py –help at the command prompt. An example of the output of this command is below:
usage: ultram_syslogs.py [-h] -c CFG [-d] [-u] [-o]

optional arguments:
  -h, --help            show this help message and exit
  -c CFG, --cfg CFG     Configuration file
  -d, --disable-syslog  Disable Syslog
  -u, --ucs             Apply syslog configuration on UCS servers
  -o, --openstack       Apply syslog configuration on OpenStack
Example output:
2017-09-13 15:24:23,305 - Configuring Syslog server 192.200.0.1:514 on UCS cluster
2017-09-13 15:24:23,305 - Get information about all the nodes from under-cloud
2017-09-13 15:24:37,178 - Enabling syslog configuration on 192.100.3.5
2017-09-13 15:24:54,686 - Connected.
2017-09-13 15:25:00,546 - syslog configuration success.
2017-09-13 15:25:00,547 - Enabling syslog configuration on 192.100.3.6
2017-09-13 15:25:19,003 - Connected.
2017-09-13 15:25:24,808 - syslog configuration success.
<---SNIP--->

<---SNIP--->
2017-09-13 15:46:08,715 - Enabling syslog configuration on vnf1-osd-compute-1 [192.200.0.104]
2017-09-13 15:46:08,817 - Connected
2017-09-13 15:46:09,046 - - /etc/rsyslog.conf
2017-09-13 15:46:09,047 -  Enabling syslog ...
2017-09-13 15:46:09,130 -  Restarting rsyslog
2017-09-13 15:46:09,237 -  Restarted
2017-09-13 15:46:09,321 - - /etc/nova/nova.conf
2017-09-13 15:46:09,321 -  Enabling syslog ...
2017-09-13 15:46:09,487 -  Restarting Services 'openstack-nova-compute.service'
-
Ensure that client log messages are being received by the server and are uniquely identifiable.
NOTES:
-
If necessary, configure a unique tag and hostname as part of the syslog configuration/template for each client.
-
Syslogs are very specific in terms of the file permissions and ownership. If need be, manually configure permissions for the log file on the client using the following command:
chmod +r <URL>/<log_filename>
-
Event Aggregation
The Ultra M Manager Node can be configured to aggregate events received from different Ultra M components as identified in Table 1.
Note | This functionality is currently supported only with Ultra M deployments based on OSP 10 and that leverage the Hyper-Converged architecture. |
|
Solution Component |
Event Source Type |
Details |
||
|---|---|---|---|---|
|
UCS server hardware |
CIMC |
Reports on events collected from UCS C-series hardware via CIMC-based subscription. These events are monitored in real-time. |
||
|
VIM (Overcloud) |
OpenStack service health |
Reports on OpenStack service fault events pertaining to:
By default, these events are collected during a 900 second polling interval as specified within the ultram_cfg.yaml file.
|
||
|
UAS (AutoVNF, UEM, and ESC) |
UAS cluster/USP management component events |
Reports on UAS service fault events pertaining to:
By default, these events are collected during a 900 second polling interval as specified within the ultram_cfg.yaml file.
|
Events received from the solution components, regardless of the source type, are mapped against the Ultra M SNMP MIB (CISCO-ULTRAM-MIB.my, refer to Ultra M MIB). The event data is parsed and categorized against the following conventions:
-
Fault code: Identifies the area in which the fault occurred for the given component. Refer to the “CFaultCode” convention within the Ultra M MIB for more information.
-
Severity: The severity level associated with the fault. Refer to the “CFaultSeverity” convention within the Ultra M MIB for more information. Since the Ultra M Manager Node aggregates events from different components within the solution, the severities supported within the Ultra M Manager Node MIB map to those for the specific components. Refer to Ultra M Component Event Severity and Fault Code Mappings for details.
-
Domain: The component in which the fault occurred (e.g. UCS hardware, VIM, UEM, etc.). Refer to the “CFaultDomain” convention within the Ultra M MIB for more information.
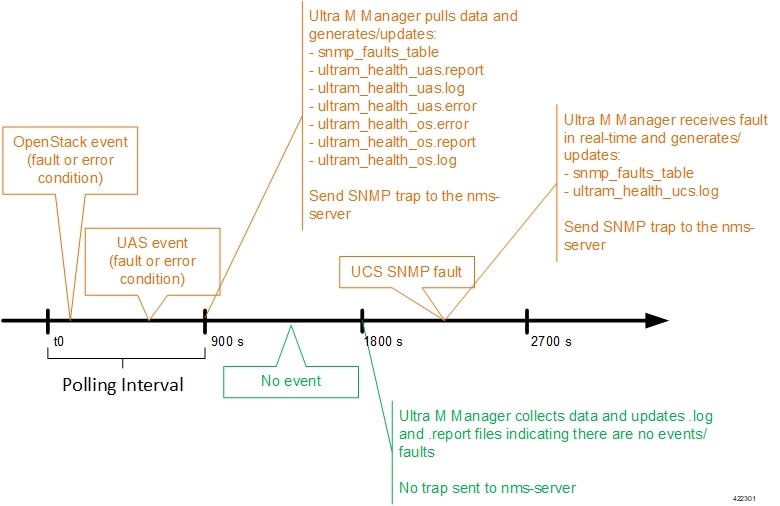
UAS and OpenStack events are monitored at the configured polling interval as described in Table 2. At the polling interval, the Ultra M Manager Node:
-
Collects data from UAS and OpenStack.
-
Generates/updates .log and .report files and an SNMP-based fault table with this information. It also includes related data about the fault such as the specific source, creation time, and description.
-
Processes any events that occurred:
-
If an error or fault event is identified, then a .error file is created and an SNMP trap is sent.
-
If the event received is a clear condition, then an informational SNMP trap is sent to “clear” an active fault.
-
If no event occurred, then no further action is taken beyond Step 2.
-
UCS events are monitored and acted upon in real-time. When events occur, the Ultra M Manager generates a .log file and the SNMP fault table.
Active faults are reported “only” once and not on every polling interval. As a result, there is only one trap as long as this fault is active. Once the fault is “cleared”, an informational trap is sent.
Note | UCS events are considered to be the “same” if a previously received fault has the same distinguished name (DN), severity, and lastTransition time. UCS events are considered as “new” only if any of these elements change. |
These processes are illustrated in Figure 1. Refer to About Ultra M Manager Log Files for more information.
An example of the snmp_faults_table file is shown below and the entry syntax is described in Figure 2:
"0": [3 "neutonoc-osd-compute-0: neutron-sriov-nic-agent.service" 1 8 "status known"] "1": [3 "neutonoc-osd-compute-0: ntpd" 1 8 "Service is not active state: inactive"] "2": [3 "neutonoc-osd-compute-1: neutron-sriov-nic-agent.service" 1 8 "status known"] "3": [3 "neutonoc-osd-compute-1: ntpd" 1 8 "Service is not active state: inactive"] "4": [3 "neutonoc-osd-compute-2: neutron-sriov-nic-agent.service" 1 8 "status known"] "5": [3 "neutonoc-osd-compute-2: ntpd" 1 8 "Service is not active state: inactive"]
Refer to About Ultra M Manager Log Files for more information.
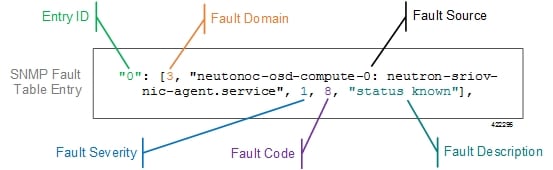
Each element in the SNMP Fault Table Entry corresponds to an object defined in the Ultra M SNMP MIB as described in Table 2. (Refer also to Ultra M MIB.)
|
SNMP Fault Table Entry Element |
MIB Object |
Additional Details |
|---|---|---|
|
Entry ID |
cultramFaultIndex |
A unique identifier for the entry |
|
Fault Domain |
cultramFaultDomain |
The component area in which the fault occurred. The following domains are supported in this release:
|
|
Fault Source |
cultramFaultSource |
Information identifying the specific component within the Fault Domain that generated the event. The format of the information is different based on the Fault Domain. Refer to Table 3 for details. |
|
Fault Severity |
cultramFaultSeverity |
The severity associated with the fault as one of the following:
Refer to Ultra M Component Event Severity and Fault Code Mappings for details on how these severities map to events generated by the various Ultra M components. |
|
Fault Code |
cultramFaultCode |
A unique ID representing the type of fault as. The following codes are supported:
Refer to Ultra M Component Event Severity and Fault Code Mappings for details on how these fault codes map to events generated by the various Ultra M components. |
|
Fault Description |
cultramFaultDescription |
A message containing details about the fault. |
|
FaultDomain |
Format Value of cultramFaultSource |
|---|---|
|
Hardware (UCS Servers) |
Node: <UCS-SERVER-IP-ADDRESS>, affectedDN: <FAULT-OBJECT-DISTINGUSIHED-NAME>
Where: <UCS-SERVER-IP-ADDRESS> : The management IP address of the UCS server that generated the fault. <FAULT-OBJECT-DISTINGUSIHED-NAME> : The distinguished name of the affected UCS object. |
|
UAS |
Node: <UAS-MANAGEMENT-IP>
Where: <UAS-MANAGEMENT-IP> : The management IP address for the UAS instance. |
|
VIM (OpenStack) |
<OS-HOSTNAME>: <SERVICE-NAME>
Where: <OS-HOSTNAME> : The OpenStack node hostname that generated the fault. <SERVICE-NAME> : Then name of the OpenStack service that generated the fault. |
Fault and alarm collection and aggregation functionality within the Hyper-Converged Ultra M solution is configured and enabled through the ultram_cfg.yaml file. (An example of this file is located in Example ultram_cfg.yaml File.) Parameters in this file dictate feature operation and enable SNMP on the UCS servers and event collection from the other Ultra M solution components.
To enable this functionality on the Ultra M solution:
-
Install the Ultra M Manager bundle RPM using the instructions in Install the Ultra M Manager RPM.
Note
This step is not needed if the Ultra M Manager bundle was previously installed. -
Become the root user.
sudo -i -
Navigate to /etc.
cd /etc -
Edit the ultram_cfg.yaml file based on your deployment scenario.
Note
The ultram_cfg.yaml file pertains to both the syslog proxy and event aggregation functionality. Some parts of this file’s configuration overlap and may have been configured in relation to the other function. -
Navigate to /opt/cisco/usp/ultram-health.
cd /opt/cisco/usp/ultram-health -
Start the Ultra M Manager Service.
Note
Subsequent configuration changes require you restart the health monitor service. Refer to Restarting the Ultra M Manager Service for details. -
Verify the configuration by checking the ultram_health.log file.
cat /var/log/cisco/ultram_health.log
Install the Ultra M Manager RPM
The Ultra M Manager functionality described in this chapter is enabled through software distributed both as part of the USP ISO and as a separate RPM bundle.
Ensure that you have access to either of these RPM bundles prior to proceeding with the instructions below.
To access the Ultra M Manager RPM packaged within the USP ISO, onboard the ISO and navigate to the ultram_health directory. Refer to the USP Deployment Automation Guide for instructions on onbarding the USP ISO.
-
Optional. Remove any previously installed versions of the Ultra M Manager per the instructions in Uninstalling the Ultra M Manager.
-
Log on to the Ultra M Manager Node.
-
Become the root user.
sudo -i -
Copy the "ultram-manager” RPM file to the Ultra M Manager Node.
-
Navigate to the directory in which you copied the file.
-
Install the ultram-manager bundle RPM that was distributed with the ISO.
yum install -y ultram-manager-<version>.x86_64.rpmA message similar to the following is displayed upon completion:
Installed:
  ultram-health.x86_64 0:5.1.6-2

Complete!
-
Verify that log rotation is enabled in support of the syslog proxy functionality by checking the logrotate file.
cd /etc/cron.daily
ls -al
Example output:
total 28
drwxr-xr-x.   2 root root  4096 Sep 10 18:15 .
drwxr-xr-x. 128 root root 12288 Sep 11 18:12 ..
-rwx------.   1 root root   219 Jan 24  2017 logrotate
-rwxr-xr-x.   1 root root   618 Mar 17  2014 man-db.cron
-rwx------.   1 root root   256 Jun 21 16:57 rhsmd
cat /etc/cron.daily/logrotateExample output:
#!/bin/sh /usr/sbin/logrotate -s /var/lib/logrotate/logrotate.status /etc/logrotate.conf EXITVALUE=$? if [ $EXITVALUE != 0 ]; then /usr/bin/logger -t logrotate "ALERT exited abnormally with [$EXITVALUE]" fi exit 0 -
Create and configure the ultram_health file.
cd /etc/logrotate.d
vi ultram_health

/var/log/cisco/ultram-health/* {
   size 50M
   rotate 30
   missingok
   notifempty
   compress
   }
-
Proceed to either Syslog Proxy or Event Aggregation to configure the desired functionality.
Restarting the Ultra M Manager Service
In the event of configuration change or a server reboot, the Ultra M Manager service must be restarted.
To restart the Ultra M Manager service:
- Check the Ultra M Manager Service Status
- Stop the Ultra M Manager Service
- Start the Ultra M Manager Service
Check the Ultra M Manager Service Status
It may be necessary to check the status of the Ultra M Manager service.
Note | These instructions assume that you are already logged into the Ultra M Manager Node as the root user. |
To check the Ultra M Manager status:
-
Check the service status.
service ultram_health.service statusExample Output – Inactive Service:
Redirecting to /bin/systemctl status ultram_health.service
 ultram_health.service - Cisco UltraM Health monitoring Service
   Loaded: loaded (/etc/systemd/system/ultram_health.service; enabled; vendor preset: disabled)
   Active: inactive (dead)
Example Output – Active Service:
Redirecting to /bin/systemctl status ultram_health.service ultram_health.service - Cisco UltraM Health monitoring Service Loaded: loaded (/etc/systemd/system/ultram_health.service; enabled; vendor preset: disabled) Active: active (running) since Sun 2017-09-10 22:20:20 EDT; 5s ago Main PID: 16982 (start_ultram_he) CGroup: /system.slice/ultram_health.service ├─16982 /bin/sh /usr/local/sbin/start_ultram_health ├─16983 python /opt/cisco/usp/ultram-health/ultram_health.py /etc/ultram_cfg.yaml ├─16991 python /opt/cisco/usp/ultram-health/ultram_health.py /etc/ultram_cfg.yaml └─17052 /usr/bin/python /bin/ironic node-show 19844e8d-2def-4be4-b2cf-937f34ebd117 Sep 10 22:20:20 ospd-tb1.mitg-bxb300.cisco.com systemd[1]: Started Cisco UltraM Health monitoring Service. Sep 10 22:20:20 ospd-tb1.mitg-bxb300.cisco.com systemd[1]: Starting Cisco UltraM Health monitoring Service... Sep 10 22:20:20 ospd-tb1.mitg-bxb300.cisco.com start_ultram_health[16982]: 2017-09-10 22:20:20,411 - UCS Health Check started -
Check the status of the mongo process.
ps -ef | grep mongoExample output:
mongodb 3769 1 0 Aug23 ? 00:43:30 /usr/bin/mongod --quiet -f /etc/mongod.conf run
Stop the Ultra M Manager Service
It may be necessary to stop the Ultra M Manager service under certain circumstances.
Note | These instructions assume that you are already logged into the Ultra M Manager Node as the root user. |
To stop the Ultra M Manager service, enter the following command from the /opt/cisco/usp/ultram-health directory:
./service ultram_health.service stop
Start the Ultra M Manager Service
It is necessary to start/restart the Ultra M Manager service in order to execute configuration changes and or after a reboot of the Ultra M Manager Node.
Note | These instructions assume that you are already logged into the Ultra M Manager Node as the root user. |
To start the Ultra M Manager service, enter the following command from the /opt/cisco/usp/ultram-health directory:
./service ultram_health.service start
Uninstalling the Ultra M Manager
If you have previously installed the Ultra M Manager, you must uninstall it before installing newer releases.
To uninstall the Ultra M Manager:
-
Log on the Ultra M Manager Node.
-
Become the root user.
sudo -i -
Make a backup copy of the existing configuring file (e.g. /etc/ultram_cfg.yaml).
-
Check the installed version.
yum list installed | grep ultraExample output:
ultram-manager.x86_64 5.1.3-1 installed
-
Uninstall the previous version.
yum erase ultram-managerExample output:
Loaded plugins: enabled_repos_upload, package_upload, product-id, search-disabled-repos, subscription-manager, versionlock
Resolving Dependencies
--> Running transaction check
---> Package ultram-manager.x86_64 0:5.1.5-1 will be erased
--> Finished Dependency Resolution

Dependencies Resolved

=====================================================================================================
 Package                    Arch                Version                 Repository              Size
=====================================================================================================
Removing:
 ultram-health              x86_64              5.1.5-1                 installed              148 k

Transaction Summary
=====================================================================================================
Remove  1 Package

Installed size: 148 k
Is this ok [y/N]:
Enter y at the prompt to continue.
A message similar to the following is displayed upon completion:
Removed:
  ultram-health.x86_64 0:5.1.3-1

Complete!
Uploading Enabled Reposistories Report
Loaded plugins: product-id, versionlock
-
Proceed to Install the Ultra M Manager RPM
Encrypting Passwords in the ultram_cfg.yaml File
The ultram_cfg.yaml file requires the specification of passwords for the managed components. These passwords are entered in clear text within the file. To mitigate security risks, the passwords should be encrypted before using the file to deploy Ultra M Manager-based features/functions.
To encrypt the passwords, the Ultra M Manager provides a script called utils.py in the /opt/cisco/usp/ultram-manager/ directory. The script can be run against your ultram_cfg.yaml file by navigating to that directory and executing the following command as the root user:
utils.py --secure-cfg /etc/ultram_cfg.yaml
Data is encrypted using AES via a 256 bit key that is stored in the MongoDB. As such, an OSPD user on OSPD is able to access this key and possibly decrypt the passwords. (This includes the stack user as it has sudo access.)
Executing this scripts encrypts the passwords in the configuration file and appends “encrypted: true” to the end of the file (e.g. ultram_cfg.yamlencrypted: true) to indicate that the passwords have been encrypted.
Note | Do not rename the file once the filename has been changed. |
If need be, you can make edits to parameters other than the passwords within the ultram_cfg.yaml file after encrypting the passwords.
For new installations, run the script to encrypt the passwords before applying the configuration and starting the Ultra M Manager service as described in Syslog Proxy and Event Aggregation.
To encrypt passwords for exsiting installations:
-
Optional. Installing an updated version of the Ultra M Manager RPM.
-
Save a copy of your ultram_cfg.yaml file to alternate location outside of the Ultra M Manager installation.
-
Uninstall the Ultra M Manager using the instructions in Uninstalling the Ultra M Manager.
-
Install the new Ultra M Manager version using the instructions in Install the Ultra M Manager RPM.
-
Copy your backed-up ultram_cfg.yaml file to the /etc directory.
-
-
Navigate to /opt/cisco/usp/ultram-manager/.
cd /opt/cisco/usp/ultram-manager/ -
Encrypt the clear text passwords in the ultram_cfg.yaml file.
utils.py --secure-cfg /etc/ultram_cfg.yaml
Note
Executing this scripts encrypts the passwords in the configuration file and appends “encrypted: true” to the end of the file (e.g. ultram_cfg.yamlencrypted: true).
 Feedback