- Index
- New and Changed
- Preface
- Overview
- Installing Cisco MDS NX-OS and Fabric Manager
- Fabric Manager Server
- Authentication in Fabric Manager
- Fabric Manager Client
- Device Manager
- Fabric Manager Web Cient
- Performance Manager
- Cisco Traffic Analyzer
- Network Monitoring
- Performance Monitoring
- Software Images
- Management Software FAQs
- Launching Fabric Manager in Cisco SAN-OS Releases Prior to 3.2(1)
- Cisco Fabric Manager Unsupported Feature List
- Interface Nonoperational Reason Codes
- Managing Cisco FabricWare
- About Fabric Manager Client
- Launching Fabric Manager Client in Cisco SAN-OS Release 3.2(1) and Later
- Fabric Manager Client Quick Tour: Server Admin Perspective
- Fabric Manager Client Quick Tour: Admin Perspective
- Setting Fabric Manager Preferences
- Network Fabric Discovery
- Network LAN Discovery
- Modifying the Device Grouping
- Controlling Administrator Access with Users and Roles
- Using Fabric Manager Wizards
- Fabric Manager Troubleshooting Tools
Fabric Manager Client
Cisco Fabric Manager Client is a java-based GUI application that provides access to the Fabric Manager applications from a remote workstation.
This chapter contains the following sections:
•![]() Launching Fabric Manager Client in Cisco SAN-OS Release 3.2(1) and Later
Launching Fabric Manager Client in Cisco SAN-OS Release 3.2(1) and Later
•![]() Fabric Manager Client Quick Tour: Server Admin Perspective
Fabric Manager Client Quick Tour: Server Admin Perspective
•![]() Fabric Manager Client Quick Tour: Admin Perspective
Fabric Manager Client Quick Tour: Admin Perspective
•![]() Setting Fabric Manager Preferences
Setting Fabric Manager Preferences
•![]() Modifying the Device Grouping
Modifying the Device Grouping
•![]() Controlling Administrator Access with Users and Roles
Controlling Administrator Access with Users and Roles
•![]() Fabric Manager Troubleshooting Tools
Fabric Manager Troubleshooting Tools
About Fabric Manager Client
Cisco Fabric Manager is a Java and SNMP-based network fabric and device management tool with a GUI that displays real-time views of your network fabric, including Cisco Nexus 5000 Series switches, Cisco MDS 9000 Family and third-party switches, hosts, and storage devices.
In addition to complete configuration and status monitoring capabilities for Cisco MDS 9000 Family switches and Cisco Nexus 5000 Series switches, Fabric Manager Client provides Fibre Channel troubleshooting tools. You can use these health and configuration analysis tools on the MDS 9000 Family switch or Cisco Nexus 5000 Series switch to perform Fibre Channel ping and traceroute.
Fabric Manager Release 4.1(1b) and later provides multilevel security system by adding a server admin role that allows access to limited features . The configuration capabilities of a server admin is limited to FlexAttach and relevant data.

Note ![]() You must use the same release of Fabric Manager Client and Fabric Manager Server.
You must use the same release of Fabric Manager Client and Fabric Manager Server.
Fabric Manager Advanced Mode
Advanced mode is enabled by default and provides the full suite of Fabric Manager features, including security, IVR, iSCSI, and FICON. To simplify the user interface, from the list box in the upper right corner of the Fabric Manager Client, select Simple. In simple mode, you can access basic MDS 9000 features such as VSANs, zoning, and configuring interfaces. Advanced mode option is not available for server admin role.
Launching Fabric Manager Client in Cisco SAN-OS Release 3.2(1) and Later

Note ![]() As of Cisco SAN-OS 3.x and NX-OS Release 4.x, the Fabric Manager Client login procedure has changed. If you are running a version of Cisco SAN-OS that is earlier than Cisco SAN-OS 3.2(1), follow the login instructions in the "Setting the Seed Switch in Cisco SAN-OS Releases 3.1(1) to 3.2(1)" section on page A-1 or the "Setting the Seed Switch in Releases Prior to Cisco SAN-OS Release 3.1(1)" section on page A-3.
As of Cisco SAN-OS 3.x and NX-OS Release 4.x, the Fabric Manager Client login procedure has changed. If you are running a version of Cisco SAN-OS that is earlier than Cisco SAN-OS 3.2(1), follow the login instructions in the "Setting the Seed Switch in Cisco SAN-OS Releases 3.1(1) to 3.2(1)" section on page A-1 or the "Setting the Seed Switch in Releases Prior to Cisco SAN-OS Release 3.1(1)" section on page A-3.

Note ![]() Network administrators must initially launch Fabric Manager Client using Fabric Manager Web Server, as described in the following procedure. Once an administrator has installed the Fabric Manager Client icon on your desktop, you can double-click the icon to launch the Fabric Manager Client.
Network administrators must initially launch Fabric Manager Client using Fabric Manager Web Server, as described in the following procedure. Once an administrator has installed the Fabric Manager Client icon on your desktop, you can double-click the icon to launch the Fabric Manager Client.
To launch Fabric Manager Client, follow these steps:
Step 1 ![]() Open your browser and enter the IP address where you installed Fabric Manager Server, or enter localhost if you installed Fabric Manager Server on your local workstation.
Open your browser and enter the IP address where you installed Fabric Manager Server, or enter localhost if you installed Fabric Manager Server on your local workstation.
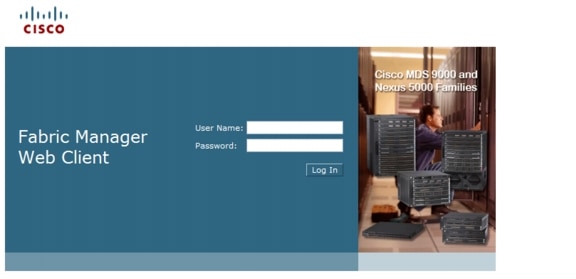
You see the Fabric Manager Web Server Login dialog box shown in Figure 5-1.
Figure 5-1 Fabric Manager Web Client Login Dialog Box
Step 2 ![]() Enter your user name and password and click Login.
Enter your user name and password and click Login.
You see the Fabric Manager Web Client Summary page.
Step 3 ![]() Click the Download link in the upper right corner of the page.
Click the Download link in the upper right corner of the page.
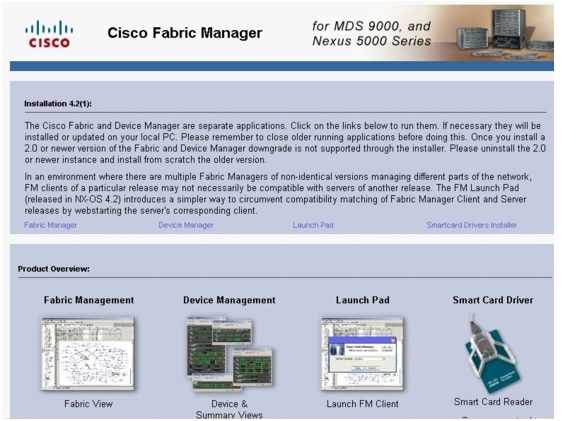
You see the Download page for Fabric Manager and Device Manager (see Figure 5-2).
Figure 5-2 Download Page for Fabric Manager and Device Manager
Step 4 ![]() Click the link for Fabric Manager.
Click the link for Fabric Manager.
If you are launching Fabric Manager Client for the first time, you see a message asking whether you want to create shortcuts for Fabric Manager (see Figure 5-3).
Figure 5-3 Fabric Manager Create Shortcut(s) Message

Step 5 ![]() Click Yes to create shortcuts for Fabric Manager.
Click Yes to create shortcuts for Fabric Manager.

Note ![]() This message only appears the first time you launch Fabric Manager Client. If you select No, your selection will be remembered and you will not be prompted to make a selection again. In this case, you will need to launch Fabric Manager Client using the Fabric Manager Web Client.
This message only appears the first time you launch Fabric Manager Client. If you select No, your selection will be remembered and you will not be prompted to make a selection again. In this case, you will need to launch Fabric Manager Client using the Fabric Manager Web Client.
Step 6 ![]() When the software is installed and icons are created on your desktop, double-click the Fabric Manager icon to launch Fabric Manager.
When the software is installed and icons are created on your desktop, double-click the Fabric Manager icon to launch Fabric Manager.
You see the Fabric Manager Login dialog box shown in Figure 5-4.
Figure 5-4 Fabric Manager Login Dialog Box
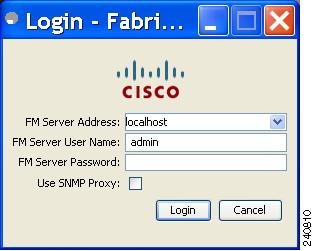
Step 7 ![]() Enter the Fabric Manager Server user name and password.
Enter the Fabric Manager Server user name and password.
Step 8 ![]() Check the Use SNMP Proxy check box if you want Fabric Manager Client to communicate with Fabric Manager Server through a TCP-based proxy server.
Check the Use SNMP Proxy check box if you want Fabric Manager Client to communicate with Fabric Manager Server through a TCP-based proxy server.
Step 9 ![]() Click Login. Once you successfully log in to Fabric Manager Server, you can set the seed switch and open the fabrics that you are entitled to access.
Click Login. Once you successfully log in to Fabric Manager Server, you can set the seed switch and open the fabrics that you are entitled to access.

Note ![]() When you launch Fabric Manager Client for the first time or when there are no available fabrics, you see the Discover New Fabric dialog box.
When you launch Fabric Manager Client for the first time or when there are no available fabrics, you see the Discover New Fabric dialog box.
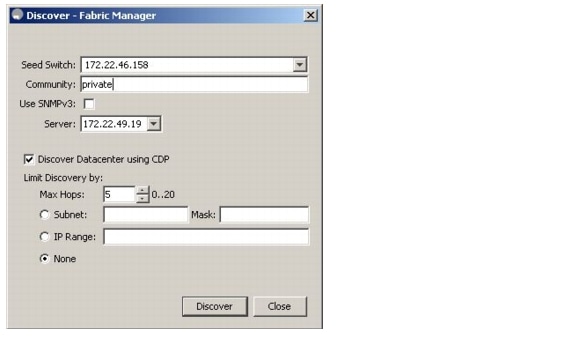
You see the Discover New Fabric dialog box shown in Figure 5-5.
Figure 5-5 Discover New Fabric Dialog Box

Note ![]() Only network administrators can discover new fabrics.
Only network administrators can discover new fabrics.
Step 10 ![]() Set the fabric seed switch to the Cisco MDS 9000 Family switch or Cisco Nexus 5000 Series that you want Fabric Manager to use. Starting from NX-OS Release 4.2(0), Fabric Manager uses Cisco Discovery Protocol to discover Ethernet switches such as Nexus 5000, Nexus 7000, Catalyst 4000 and Catalyst 6000 switches. You need to use a CDP seed switch for a CDP discovery.
Set the fabric seed switch to the Cisco MDS 9000 Family switch or Cisco Nexus 5000 Series that you want Fabric Manager to use. Starting from NX-OS Release 4.2(0), Fabric Manager uses Cisco Discovery Protocol to discover Ethernet switches such as Nexus 5000, Nexus 7000, Catalyst 4000 and Catalyst 6000 switches. You need to use a CDP seed switch for a CDP discovery.
Step 11 ![]() Enter the user name and password for the switch.
Enter the user name and password for the switch.
Step 12 ![]() Choose the Auth-Privacy option according to the privacy protocol you have configured on your switch:
Choose the Auth-Privacy option according to the privacy protocol you have configured on your switch:
a. ![]() If you have not configured the switch with a privacy protocol, then choose Auth-Privacy option MD5 (no privacy).
If you have not configured the switch with a privacy protocol, then choose Auth-Privacy option MD5 (no privacy).
b. ![]() If you have configured the switch with your privacy protocol, choose your Auth-Privacy choice.
If you have configured the switch with your privacy protocol, choose your Auth-Privacy choice.

Note ![]() You may use SNMP v2 credentials for CDP discovery as the most of the Catalyst switches does not use MD5-DES to configure.
You may use SNMP v2 credentials for CDP discovery as the most of the Catalyst switches does not use MD5-DES to configure.

Note ![]() If you want a clean fabric discovery, remove the fabric and rediscover it. If you want a clean LAN discovery, unmanage LAN, remove the CDP seed switch and then rediscover it.
If you want a clean fabric discovery, remove the fabric and rediscover it. If you want a clean LAN discovery, unmanage LAN, remove the CDP seed switch and then rediscover it.
Step 13 ![]() To discover using Cisco Discovery Protocol, check the Discover Datacenter using CDP check box.
To discover using Cisco Discovery Protocol, check the Discover Datacenter using CDP check box.
Step 14 ![]() Enter the value in the Max Hops The valid range is 1to 20 hops.
Enter the value in the Max Hops The valid range is 1to 20 hops.
Step 15 ![]() Click Subnet radio button to specify a subnet and subnet mask for discovering LAN.
Click Subnet radio button to specify a subnet and subnet mask for discovering LAN.
Step 16 ![]() Click IP Range to specify a valid IP range for discovering the LAN. The IP range should be in the following format: aaa.bbb.ccc.ddd, where ddd can be a number from 1 to 254.
Click IP Range to specify a valid IP range for discovering the LAN. The IP range should be in the following format: aaa.bbb.ccc.ddd, where ddd can be a number from 1 to 254.
Step 17 ![]() Click None if you are not specifying Subnet and IP Range.
Click None if you are not specifying Subnet and IP Range.
Step 18 ![]() Click Discover.
Click Discover.
You see the Control Panel dialog box shown in Figure 5-6.
Figure 5-6 Control Panel Dialog Box
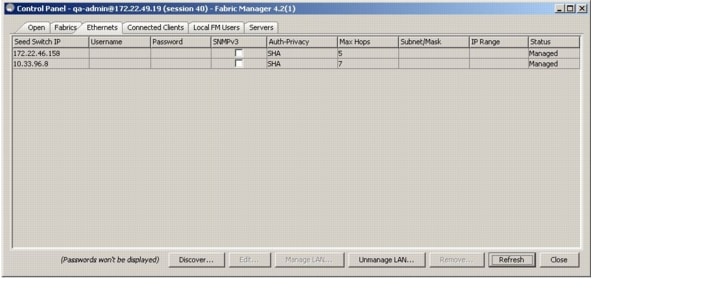

Note ![]() You see a message in the dialog box when the server and client are running on the same workstation and there are unlicensed fabrics in the database. You also see a message when there are unmanaged fabrics (the state of the licenses is unknown).
You see a message in the dialog box when the server and client are running on the same workstation and there are unlicensed fabrics in the database. You also see a message when there are unmanaged fabrics (the state of the licenses is unknown).

Note ![]() In the open tab, you see all the discovered fabrics displayed in the control panel. You need to click on the Open button to see all the discovered Ethernet switches.
In the open tab, you see all the discovered fabrics displayed in the control panel. You need to click on the Open button to see all the discovered Ethernet switches.
Step 19 ![]() Check the check box(es) next to the fabric(s) you want to open in the Select column, or click Discover to add a new fabric.
Check the check box(es) next to the fabric(s) you want to open in the Select column, or click Discover to add a new fabric.

Note ![]() Only network administrators can continuously manage or unmanage fabrics.
Only network administrators can continuously manage or unmanage fabrics.
Step 20 ![]() Click Open to open the selected fabric(s).
Click Open to open the selected fabric(s).

Note ![]() · If you have an incomplete view of your fabric, rediscover the fabric with a user that has no
· If you have an incomplete view of your fabric, rediscover the fabric with a user that has no
VSAN restriction.
· If the fabric includes a Cisco Nexus 5000 Series switch, then the Layer 2 node appears under
the Switches > Interfaces > Ethernet tree, the VFC (FCoE) node appears under the
Switches > Interfaces tree, and the FCoE node appears under the Switches tree in the
Physical Attributes pane.
To launch Fabric Manager Client from within a running instance of Fabric Manager, follow these steps:
Step 1 ![]() Choose File > Open or click the Open Switch Fabric icon on the Fabric Manager toolbar.
Choose File > Open or click the Open Switch Fabric icon on the Fabric Manager toolbar.
You see the Control Panel dialog box (see Figure 5-6).
Step 2 ![]() Check the check box(es) next to the fabric(s) you want to open in the Select column and click Open.
Check the check box(es) next to the fabric(s) you want to open in the Select column and click Open.

Note ![]() Changes made using Fabric Manager are applied to the running configuration of the switches that you are managing. If you have made changes to the configuration or performed an operation (such as activating zones), Fabric Manager prompts you to save your changes before you exit.
Changes made using Fabric Manager are applied to the running configuration of the switches that you are managing. If you have made changes to the configuration or performed an operation (such as activating zones), Fabric Manager prompts you to save your changes before you exit.
Launching Fabric Manager Client Using Launch Pad
Starting from Cisco NX-OS Release 4.2(0), you can use Fabric Manager launch pad to connect to any server by specifying the IP address of the server. With launch pad, you can connect to any Fabric Manager Server version 3.3(0) and later. Launch pad establishes connection with the server using HTTP protocol.
To launch Fabric Manager Client using launch pad, follow these steps:
Step 1 ![]() Open your browser and enter the IP address where you installed Fabric Manager Server, or enter localhost if you installed Fabric Manager Server on your local workstation.
Open your browser and enter the IP address where you installed Fabric Manager Server, or enter localhost if you installed Fabric Manager Server on your local workstation.
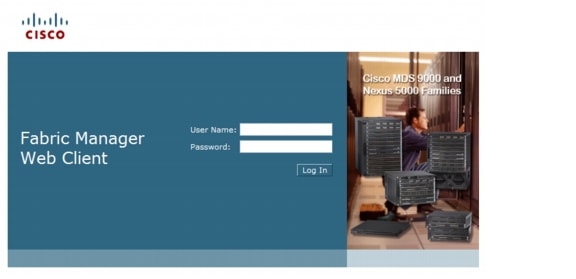
You see the Fabric Manager Web Server Login dialog box shown in Figure 5-7.
Figure 5-7 Fabric Manager Web Client Login Dialog Box
Step 2 ![]() Enter your user name and password and click Login.
Enter your user name and password and click Login.
You see the Fabric Manager Web Client Summary page.
Step 3 ![]() Click the Download link in the upper right corner of the page.
Click the Download link in the upper right corner of the page.
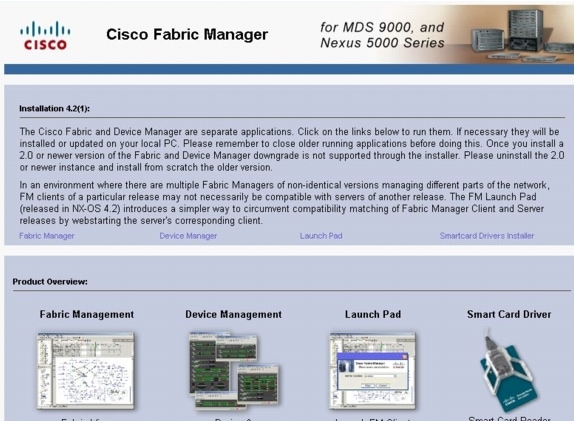
You see the Download page for Fabric Manager and Device Manager (see Figure 5-8).
Figure 5-8 Download Page for Fabric Manager and Device Manager
Step 4 ![]() Click the link for Fabric Manager.
Click the link for Fabric Manager.
You see the Fabric Manager Server launch pad as in Figure 5-9.
Step 5 ![]() Enter the host name of the server or IP address in the Server URL drop-down list.
Enter the host name of the server or IP address in the Server URL drop-down list.
Step 6 ![]() Click Start.
Click Start.
Figure 5-9 Fabric Manager Launch Pad
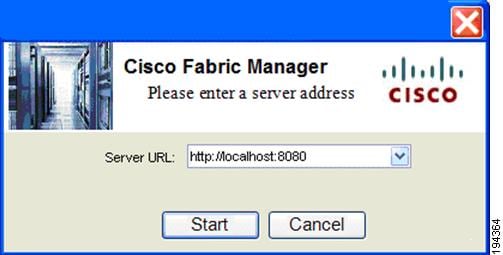

Note ![]() Launch pad retains the history of the server URLs used. You can choose one of the previously user Server URLs from the drop-down list.
Launch pad retains the history of the server URLs used. You can choose one of the previously user Server URLs from the drop-down list.
Fabric Manager Client Quick Tour: Server Admin Perspective
Fabric Manager Release 4.1(1b) and later provides a multilevel security system by adding a server admin role that allows access only to limited features . The configuration capabilities of a server admin role is limited to FlexAttach and relevant data. The server admin can pre-configure SAN for new servers, move a server to another port on the same NPV device or another NPV device and replace a failed server onto the same port without involving the SAN administrator. The server role admin will not be able to manage Fabric Manager users or connected clients.
Fabric Manager Release 4.2(0) and later provides a much improved user interface by including movable and dockable panes to let users arrange the Physical Attributes pane, Logical Domains pane, Fabric pane and Information pane according to requirements, making it easier to manage the workflow. The dockable panes are also called as dockable frames. A dockable frame can be standalone (floating), minimized or maximized. The logical, physical, information and the fabric panes can be can be collapsed and expanded as needed. These panes can also be docked at either the right side left side or to the bottom of the workspace.
Fabric Manager Main Window
This section describes the Fabric Manager Client interface that is specific to server admin users as shown in Figure 5-10.
Figure 5-10
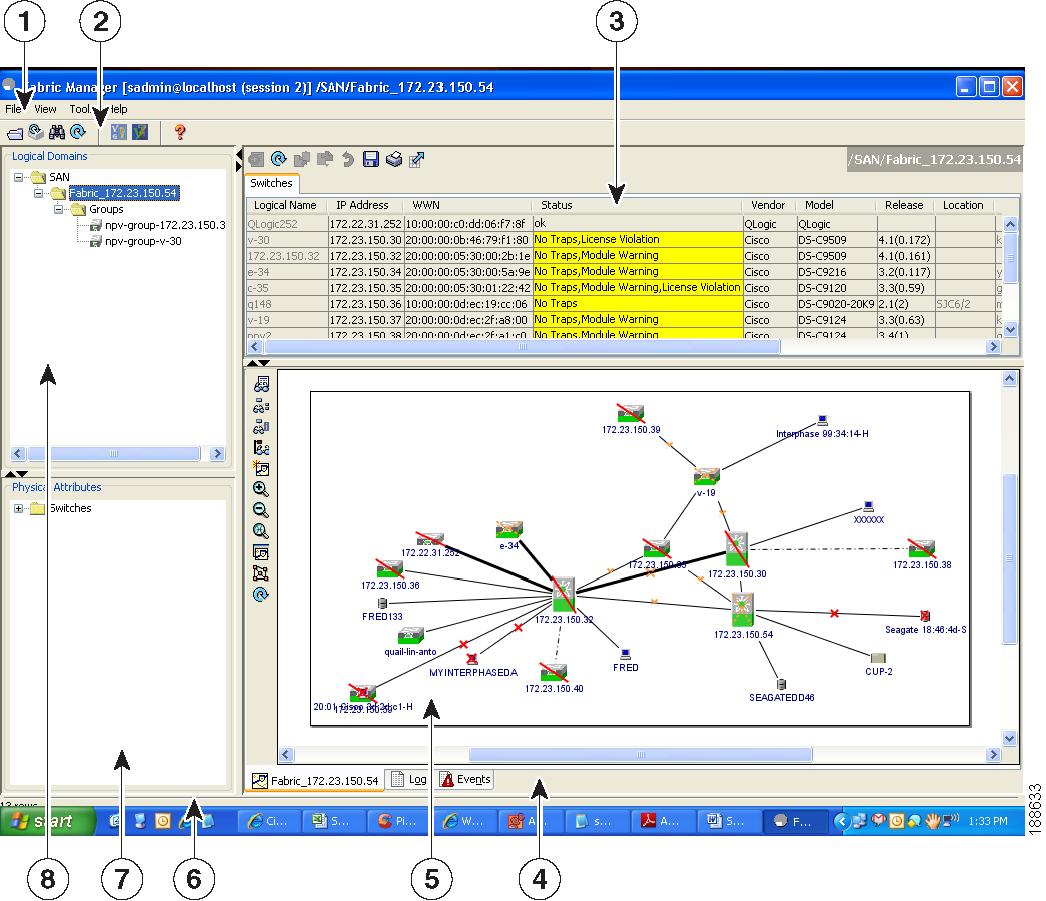
Fabric Manager Main Window: Server Admin Perspective
Menu Bar
The menu bar at the top of the Fabric Manager main window provides options for managing and for controlling the display of information on the Fabric pane. Server admin will not have all the options that are available for SAN admin. The menu bar provides the following menus:
•![]() File—Opens a new fabric, rediscovers the current fabric, locates switches, sets preferences, prints the map.
File—Opens a new fabric, rediscovers the current fabric, locates switches, sets preferences, prints the map.
•![]() View—Changes the appearance of the map (these options are duplicated on the Fabric pane toolbar).
View—Changes the appearance of the map (these options are duplicated on the Fabric pane toolbar).
•![]() Tools—Manages the Server and configuration using the FlexAttach virtual pWWN feature.
Tools—Manages the Server and configuration using the FlexAttach virtual pWWN feature.
•![]() Help—Displays online help topics for specific dialog boxes in the Information pane.
Help—Displays online help topics for specific dialog boxes in the Information pane.
Tool Bar
The Fabric Manager main toolbar (specific to server admin) provides icons for accessing the most commonly used menu bar options as shown in Table 5-1.
|
|
|
|---|---|

|
Opens switch fabric. |

|
Rediscovers current fabric. |

|
Finds in the map. |

|
Shows online help. |
Logical Domains Pane
Use the Logical Domains pane to view fabrics and to access user-defined groups. You can expand the groups to see different user-defined groups. The non-editable groups created for each core switch contains their NPV switches.
Physical Attributes Pane
Use the Physical Attributes pane to display a tree of the options available for managing the switches in the currently selected fabric or group.
To select an option, click a folder to display the options available and then click the option. You see the table with information for the selected option in the Information pane. The Physical Attributes pane provides the following main folders:
•![]() Switches—Views and configures hardware, system, licensing, and configuration files.
Switches—Views and configures hardware, system, licensing, and configuration files.
•![]() Interfaces—Views and configures FC physical, FC logical, VFC (FCoE), Ethernet, SVC, and PortChannel interfaces.
Interfaces—Views and configures FC physical, FC logical, VFC (FCoE), Ethernet, SVC, and PortChannel interfaces.
Information Pane
Use the Information pane to display tables of information associated with the option selected from the menu tree in the Logical Domains or Physical Attributes panes. The Information pane toolbar provides buttons for performing one or more of the operations shown in Table 5-2.
Fabric Pane
Use the Fabric pane to display the graphical representation of your fabric. Table 5-1 explains the graphics you may see displayed, depending on which devices you have in your fabric.
The bottom of the Fabric pane has the following tabs:
•![]() Fabric—When displaying multiple fabrics, each fabric has its own tab. You can switch between fabrics by clicking on their respective tabs.
Fabric—When displaying multiple fabrics, each fabric has its own tab. You can switch between fabrics by clicking on their respective tabs.
•![]() Log—Displays messages that describe Fabric Manager operations, such as fabric discovery.
Log—Displays messages that describe Fabric Manager operations, such as fabric discovery.
•![]() Events—Displays information about the SNMP traps received by the management station. This includes combination events as detected by discovery and important traps such as license, SNMP, and FICON.
Events—Displays information about the SNMP traps received by the management station. This includes combination events as detected by discovery and important traps such as license, SNMP, and FICON.

Note ![]() Fabric map display is based on what you select in the logical domain pane. When you select a fabric node, all the switches that belong to that fabric will be enabled. When you select the group node, all the switches that belong to the groups listed under that group node will be enabled. When you select only a group, all the switches that belong to the specific group will be enabled.
Fabric map display is based on what you select in the logical domain pane. When you select a fabric node, all the switches that belong to that fabric will be enabled. When you select the group node, all the switches that belong to the groups listed under that group node will be enabled. When you select only a group, all the switches that belong to the specific group will be enabled.
Fabric Manager Client Quick Tour: Admin Perspective
This section describes the Fabric Manager Client interface shown in Figure 5-11.
Figure 5-11 Fabric Manager Main Window
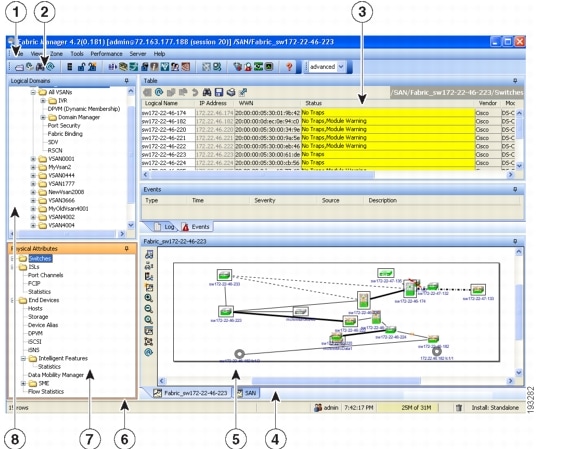
|
|
Menu bar—Provides access to options that are organized by menus. |
|
|
Toolbar—Provides icons for direct access to the most commonly used options on the File, Tools, and Help menus. |
|
|
Information pane—Displays information about whatever option is selected in the menu tree. |
|
|
Status Bar (right side)—Shows the last entry displayed by the discovery process and the possible error message. |
|
|
Fabric pane—Displays a map of the network fabric, including switches, hosts, and storage. It also provides tabs for displaying log and event data. |
|
|
Status Bar (left side)—Shows short-term transient messages, such as the number of rows displayed in a table. |
|
|
Physical Attributes pane—Displays a tree of available configuration tasks depending on the fabric, VSAN, or zone selected previously. Lists the switches and end devices in the logical selection. |
|
|
Logical Domains pane—Displays a tree of configured SAN, fabrics, VSANs, and zones, and provides access to user-defined groups. The label next to the segmented VSAN indicates the number of segments. |

Note ![]() You can resize each pane by dragging the boundaries between each region or by clicking the Minimize or Maximize controls.
You can resize each pane by dragging the boundaries between each region or by clicking the Minimize or Maximize controls.
Menu Bar
The menu bar at the top of the Fabric Manager main window provides options for managing and troubleshooting the current fabric and for controlling the display of information on the Fabric pane. The menu bar provides the following menus:
•![]() File—Opens a new fabric, rediscovers the current fabric, locates switches, sets preferences, prints the map, and exports the Fabric pane log.
File—Opens a new fabric, rediscovers the current fabric, locates switches, sets preferences, prints the map, and exports the Fabric pane log.
•![]() View—Changes the appearance of the map (these options are duplicated on the Fabric pane toolbar).
View—Changes the appearance of the map (these options are duplicated on the Fabric pane toolbar).
•![]() Zone—Manages zones, zone sets, and inter-VSAN routing (IVR).
Zone—Manages zones, zone sets, and inter-VSAN routing (IVR).
•![]() Tools—Verifies and troubleshoots connectivity and configuration, as described in the "Fabric Manager Troubleshooting Tools" section.
Tools—Verifies and troubleshoots connectivity and configuration, as described in the "Fabric Manager Troubleshooting Tools" section.
•![]() Performance—Runs and configures Performance Manager and Cisco Traffic Analyzer, and generates reports.
Performance—Runs and configures Performance Manager and Cisco Traffic Analyzer, and generates reports.
•![]() Server—Runs administrative tasks on clients and fabrics. Provides Fabric Manager Server management and a purge command. Lists fabrics being managed.
Server—Runs administrative tasks on clients and fabrics. Provides Fabric Manager Server management and a purge command. Lists fabrics being managed.
•![]() Help—Displays online help topics for specific dialog boxes in the Information pane.
Help—Displays online help topics for specific dialog boxes in the Information pane.
File
The file menu provides the following options:
•![]() Open Fabric—Opens a new switch fabric.
Open Fabric—Opens a new switch fabric.
•![]() Locate Switches and Devices— Uses the SNMPv2 protocol to discover devices responding to SNMP requests with the read-only community string public. You may use this feature if you want to locate other Cisco MDS 9000 switches in the subnet, but are not physically connected to the fabric.
Locate Switches and Devices— Uses the SNMPv2 protocol to discover devices responding to SNMP requests with the read-only community string public. You may use this feature if you want to locate other Cisco MDS 9000 switches in the subnet, but are not physically connected to the fabric.
•![]() Rediscover—Initiates an on-demand discovery to learn recent changes from the switches and update the Fabric Manager Client. You may use this option when Fabric Manager Server is not in sync with switches in the fabric and you do not want to wait until the next polling cycle. The rediscover option does not delete the fabric and add it again. You may delete and add the fabric only if the rediscover option fails to update Fabric Manager Server.
Rediscover—Initiates an on-demand discovery to learn recent changes from the switches and update the Fabric Manager Client. You may use this option when Fabric Manager Server is not in sync with switches in the fabric and you do not want to wait until the next polling cycle. The rediscover option does not delete the fabric and add it again. You may delete and add the fabric only if the rediscover option fails to update Fabric Manager Server.
•![]() Resync All Open Fabrics— Fabric Manager Server forces all the fabrics to close and re-open. You may use this option when Fabric Manager Client is not in sync with Fabric Manager Server.
Resync All Open Fabrics— Fabric Manager Server forces all the fabrics to close and re-open. You may use this option when Fabric Manager Client is not in sync with Fabric Manager Server.
•![]() Rediscover SCSI Targets— Initiates an on-demand discovery to learn recent changes from the SCSI target switches. You may use this option when Fabric Manager Server is not in sync with SCSI target switches in the fabric and you do not want to wait until the next polling cycle.
Rediscover SCSI Targets— Initiates an on-demand discovery to learn recent changes from the SCSI target switches. You may use this option when Fabric Manager Server is not in sync with SCSI target switches in the fabric and you do not want to wait until the next polling cycle.
•![]() Preferences—Sets your preferences to customize the behavior of the Fabric Manager Client.
Preferences—Sets your preferences to customize the behavior of the Fabric Manager Client.
•![]() Import Enclosures—Imports saved enclosures.
Import Enclosures—Imports saved enclosures.
•![]() Export
Export
–![]() Map Image—Generates and export the map to a specified location.
Map Image—Generates and export the map to a specified location.
–![]() Visio—Exports the map to a Visio file.
Visio—Exports the map to a Visio file.
–![]() Table—Exports the table data to a text file.
Table—Exports the table data to a text file.
–![]() Log—Exports the log to a text file.
Log—Exports the log to a text file.
–![]() Events—Exports the events to a text file.
Events—Exports the events to a text file.
–![]() Enclosures—Exports the enclosure values to a text file.
Enclosures—Exports the enclosure values to a text file.
•![]() Print —Prints the map.
Print —Prints the map.
•![]() Exit—Exit Fabric Manager.
Exit—Exit Fabric Manager.
View
View menu provides the following options:
•![]() Refresh Map—Refreshes the current map.
Refresh Map—Refreshes the current map.
•![]() Layout
Layout
–![]() Cancel—Cancels the current layout.
Cancel—Cancels the current layout.
–![]() Spring—Displays the layout based on spring algorithm.
Spring—Displays the layout based on spring algorithm.
–![]() Quick—Quickly displays the layout when the switch has many end devices.
Quick—Quickly displays the layout when the switch has many end devices.
•![]() Zoom
Zoom
–![]() In—Zooms in the view.
In—Zooms in the view.
–![]() Out—Zooms out the view.
Out—Zooms out the view.
–![]() Fit—Fits the view in the fabric pane.
Fit—Fits the view in the fabric pane.
•![]() Grid—Enables the grid view.
Grid—Enables the grid view.
•![]() Overview Window—Allows you to center the Fabric pane on the area of the fabric that you want to see. This option is useful for large fabrics that cannot be displayed entirely within the Fabric pane.
Overview Window—Allows you to center the Fabric pane on the area of the fabric that you want to see. This option is useful for large fabrics that cannot be displayed entirely within the Fabric pane.
•![]() Legend—Shows all the legends used in the fabric map.
Legend—Shows all the legends used in the fabric map.
•![]() Find in Map—Finds a device in the fabric map.
Find in Map—Finds a device in the fabric map.
Zone
The zone menu provides the following options:
•![]() Edit Local Full Zone Database—Allows you to create zones across multiple switches. Zones provide a mechanism for specifying access control. Zone sets are a group of zones to enforce access control in the fabric. All zoning features are available through the Edit Local Full Zone Database dialog box.
Edit Local Full Zone Database—Allows you to create zones across multiple switches. Zones provide a mechanism for specifying access control. Zone sets are a group of zones to enforce access control in the fabric. All zoning features are available through the Edit Local Full Zone Database dialog box.
•![]() Deactivate Zoneset—Deactivates an active zone set.
Deactivate Zoneset—Deactivates an active zone set.
•![]() Copy Full Zone Database—Creates a new zone set. On the Cisco MDS Family switches, you cannot edit an active zone set. However, you can copy an active zone set to create a new zone set that you can edit.
Copy Full Zone Database—Creates a new zone set. On the Cisco MDS Family switches, you cannot edit an active zone set. However, you can copy an active zone set to create a new zone set that you can edit.
•![]() Merge Analysis—Enables you to determine if zones will merge successfully when two Cisco MDS switches are interconnected. If the interconnected switch ports allow VSANs with identical names or contain zones with identical names, then Fabric Manager verifies that the zones contain identical members. You can use merge analysis tool before attempting a merge, or after fabrics are interconnected to determine zone merge failure causes.
Merge Analysis—Enables you to determine if zones will merge successfully when two Cisco MDS switches are interconnected. If the interconnected switch ports allow VSANs with identical names or contain zones with identical names, then Fabric Manager verifies that the zones contain identical members. You can use merge analysis tool before attempting a merge, or after fabrics are interconnected to determine zone merge failure causes.
•![]() Merge Fail Recovery—Recovers the port from its isolated state either by importing the neighboring switch's active zone set database and replacing the current active or by exporting the current database to the neighboring switch.
Merge Fail Recovery—Recovers the port from its isolated state either by importing the neighboring switch's active zone set database and replacing the current active or by exporting the current database to the neighboring switch.
•![]() Migrate Non-MDS Database—Migrate a non-MDS database using Fabric Manager (You may need to use the Zone Migration Wizard to accomplish this task).
Migrate Non-MDS Database—Migrate a non-MDS database using Fabric Manager (You may need to use the Zone Migration Wizard to accomplish this task).
•![]() IVR
IVR
–![]() Deactivate Zoneset—Deactivates an active zone set.
Deactivate Zoneset—Deactivates an active zone set.
–![]() Copy Full Zone Database—Recovers an IVR zone database by copying the IVR full zone database from another switch.
Copy Full Zone Database—Recovers an IVR zone database by copying the IVR full zone database from another switch.
–![]() Copy Full Topology—Recovers a topology by copying from the active zone database or the full zone database.
Copy Full Topology—Recovers a topology by copying from the active zone database or the full zone database.
Tools
Tools menu provides the following options:
•![]() Health
Health
–![]() Switch Health—Determines the status of the components of a specific switch.
Switch Health—Determines the status of the components of a specific switch.
–![]() Fabric Configuration—Analyzes the configuration of a switch by comparing the current configuration to a specific switch or to a policy file. You can save a switch configuration to a file and then compare all switches against the configuration in the file.
Fabric Configuration—Analyzes the configuration of a switch by comparing the current configuration to a specific switch or to a policy file. You can save a switch configuration to a file and then compare all switches against the configuration in the file.
–![]() Show Tech Support—Collects large amount of information about your switch for troubleshooting purposes. When you issue a show tech support command from Fabric Manager for one or more switches in a fabric, the results of each command are written to a text file, one file per switch, in a directory you specify. You can then view these files using Fabric Manager.
Show Tech Support—Collects large amount of information about your switch for troubleshooting purposes. When you issue a show tech support command from Fabric Manager for one or more switches in a fabric, the results of each command are written to a text file, one file per switch, in a directory you specify. You can then view these files using Fabric Manager.
•![]() Connectivity
Connectivity
–![]() End to End Connectivity—Determines connectivity and routes among devices with the switch fabric. This tool checks to see that every pair of end devices can talk to each other, using a Ping test and by determining if they are in the same VSAN or in the same active zone.
End to End Connectivity—Determines connectivity and routes among devices with the switch fabric. This tool checks to see that every pair of end devices can talk to each other, using a Ping test and by determining if they are in the same VSAN or in the same active zone.
–![]() Ping—Determines connectivity from another switch to a port on your switch.
Ping—Determines connectivity from another switch to a port on your switch.
–![]() Trace Route—Verifies connectivity between two end devices that are currently selected on the Fabric pane.
Trace Route—Verifies connectivity between two end devices that are currently selected on the Fabric pane.
–![]() Compact Flash Report—Automatically scans the fabric and generate a report that shows the status of CompactFlash.
Compact Flash Report—Automatically scans the fabric and generate a report that shows the status of CompactFlash.
•![]() NPV
NPV
–![]() CFS Static Peer Setup—Manage the peer list used during CFS on NPV-enabled switches. After setting up the static peers list, the CFS discovery on the switches will be changed to static mode for all peers in the list. Fabric Manager does not automatically update static peers list. You may need to update the list using the CFS Static Peer Setup Wizard when a new switch is added to the fabric.
CFS Static Peer Setup—Manage the peer list used during CFS on NPV-enabled switches. After setting up the static peers list, the CFS discovery on the switches will be changed to static mode for all peers in the list. Fabric Manager does not automatically update static peers list. You may need to update the list using the CFS Static Peer Setup Wizard when a new switch is added to the fabric.
–![]() Traffic Map Setup—Configures the list of external interfaces to the servers, and enabling or disabling disruptive load balancing. Using Traffic Map Setup you can specify the external ports that a server should use for traffic management.
Traffic Map Setup—Configures the list of external interfaces to the servers, and enabling or disabling disruptive load balancing. Using Traffic Map Setup you can specify the external ports that a server should use for traffic management.
–![]() Flex Attach Pre-Configure Server—Sets the port configurations for all the ports in a switch such as enabling or disabling FlexAttach, setting the default VSAN ID, and setting the interface status.
Flex Attach Pre-Configure Server—Sets the port configurations for all the ports in a switch such as enabling or disabling FlexAttach, setting the default VSAN ID, and setting the interface status.
–![]() Flex Attach Move Server—Moves a server to another port on the same NPV device or another NPV device without changing the SAN.
Flex Attach Move Server—Moves a server to another port on the same NPV device or another NPV device without changing the SAN.
–![]() Flex Attach Replace Server—Replaces a failed server with a new server on the same port without changing the SAN.
Flex Attach Replace Server—Replaces a failed server with a new server on the same port without changing the SAN.
•![]() Data Mobility Manager
Data Mobility Manager
–![]() Server Based—Performs server-based data migration.
Server Based—Performs server-based data migration.
–![]() Storage based—Performs storage-based data migration.
Storage based—Performs storage-based data migration.
–![]() Server LUN Discovery—Performs LUN discovery to select the LUNs available for migration and automates the session creation by matching the LUNs in the existing and new storage.
Server LUN Discovery—Performs LUN discovery to select the LUNs available for migration and automates the session creation by matching the LUNs in the existing and new storage.
•![]() Port Channel—Creates PortChannels from selected ISL either manually or automatically.
Port Channel—Creates PortChannels from selected ISL either manually or automatically.
•![]() DPVM Setup—Establishes dynamic port VSAN membership, enables autolearning, and activates the DPVM database.
DPVM Setup—Establishes dynamic port VSAN membership, enables autolearning, and activates the DPVM database.
•![]() IP SAN
IP SAN
–![]() FCIP Tunnel—Creates FCIP links between Gigabit Ethernet ports. Enables Fibre Channel write acceleration and IP compression
FCIP Tunnel—Creates FCIP links between Gigabit Ethernet ports. Enables Fibre Channel write acceleration and IP compression
–![]() iSCSI Setup—Creates zones for iSCSI initiators and adds a VSAN to a target-allowed VSAN list.
iSCSI Setup—Creates zones for iSCSI initiators and adds a VSAN to a target-allowed VSAN list.
–![]() SAN Extension Tuner—Optimizes FCIP performance by generating either direct access (magnetic disk) or sequential access (magnetic tape) SCSI I/O commands and directing such traffic to a specific virtual target. This option is used to generate SCSI I/O commands (read and write) to the virtual target based on your configured options.
SAN Extension Tuner—Optimizes FCIP performance by generating either direct access (magnetic disk) or sequential access (magnetic tape) SCSI I/O commands and directing such traffic to a specific virtual target. This option is used to generate SCSI I/O commands (read and write) to the virtual target based on your configured options.
•![]() Security
Security
–![]() Port Security—Prevents unauthorized access to a switch port in the Cisco MDS 9000 Family, rejects intrusion attempts and reports these intrusions to the administrator.
Port Security—Prevents unauthorized access to a switch port in the Cisco MDS 9000 Family, rejects intrusion attempts and reports these intrusions to the administrator.
–![]() IP ACL—Creates an ordered list of IP filters in a named IPv4-ACL or IPv6-ACL profile using the IPv4-ACL Wizard.
IP ACL—Creates an ordered list of IP filters in a named IPv4-ACL or IPv6-ACL profile using the IPv4-ACL Wizard.
•![]() Install
Install
–![]() License—Facilitate download and installation of licenses in selected switches in the fabric.
License—Facilitate download and installation of licenses in selected switches in the fabric.
–![]() Software—Verifies image compatibility and installs software images on selected switches in the fabric.
Software—Verifies image compatibility and installs software images on selected switches in the fabric.
•![]() Flow Load Balance Calculator —Allows you to get the best load-balancing configuration for your FICON flows. The calculator does not rely on any switch or flow discovery in the fabric.
Flow Load Balance Calculator —Allows you to get the best load-balancing configuration for your FICON flows. The calculator does not rely on any switch or flow discovery in the fabric.
•![]() Device Manager—Invokes Device Manager for a switch.
Device Manager—Invokes Device Manager for a switch.
•![]() Command Line Interface —Enables command-line operations.
Command Line Interface —Enables command-line operations.
•![]() Run CLI Commands—Runs command-line operations on more than one switch at a time.
Run CLI Commands—Runs command-line operations on more than one switch at a time.
Performance
The performance menu provides the following options:
•![]() Create Flows—Creates host-to-storage, storage-to-host, or bidirectional flows. You can add these flows to a collection configuration file to monitor the traffic between a host or storage element pair.
Create Flows—Creates host-to-storage, storage-to-host, or bidirectional flows. You can add these flows to a collection configuration file to monitor the traffic between a host or storage element pair.
Server
The server menu provides the following options:
•![]() Admin—Opens the control panel.
Admin—Opens the control panel.
•![]() Purge Down Elements—Purges all down elements in the fabric.
Purge Down Elements—Purges all down elements in the fabric.
Help
The help menu provides the following options:
•![]() Contents —Launches the online help contents.
Contents —Launches the online help contents.
•![]() Config Guide—Launches the Fabric Manager Configuration Guide.
Config Guide—Launches the Fabric Manager Configuration Guide.
•![]() About—Displays information about Fabric Manager.
About—Displays information about Fabric Manager.
Toolbar
The Fabric Manager main toolbar provides icons for accessing the most commonly used menu bar options as shown in Table 5-3.
|
|
|
|---|---|

|
Opens switch fabric. |

|
Rediscovers current fabric. |

|
Finds in the map. |

|
Creates VSAN. |

|
Launches DPVM wizard. |

|
Launches Port Security wizard. |

|
Edits full zone database. |

|
Launches IVR zone wizard. |

|
Launches PortChannel wizard. |

|
Launches FCIP wizard. |

|
Launches iSCSI wizard. |

|
Launches NPVM wizard. |

|
Launches QoS wizard. |

|
Configures users and roles. |

|
Launches IP-ACL wizard. |

|
Launches License Install wizard. |

|
Launches Software Install wizard. |

|
Performs switch health analysis. |

|
Performs fabric configuration analysis. |

|
Performs end-to-end connectivity analysis. |

|
Monitors ISL performance. Brings up real-time ISL performance information for all interfaces in the fabric, in the Information pane. |

|
Shows online help. |
Logical Domains Pane
Use the Logical Domains pane to manage attributes for fabrics, VSANs, and zones, and to access user-defined groups. Starting from NX-OS Release 4.2(0), SAN and LAN nodes are listed under Datacenter node and all the fabrics are listed under SAN node. When you select Datacenter node in the tree, Fabric Manager displays all the switches and ISLs. When you select LAN node, Fabric Manager displays only Ethernet switches and Ethernet links. Under the fabric node, VSANs are ordered by a VSAN ID. The segmented VSANs are placed under the fabric node. The label next to the segmented VSAN indicates the number of segments. You can expand a segmented VSAN and the segments under that VSAN. Right-click one of the folders in the tree and click a menu item from the pop-up menu. You see the appropriate configuration dialog box.
The default name for the fabric is the name, IP address, or WWN for the principal switch in VSAN 1. If VSAN 1 is segmented, the default name is chosen from a principal switch with the smallest WWN. The fabric names you see are as follows:
•![]() Fabric <sysName>
Fabric <sysName>
•![]() Fabric <ipAddress>
Fabric <ipAddress>
•![]() Fabric <sWWN>
Fabric <sWWN>
To change the fabric name using Fabric Manager, follow these steps:
Step 1 ![]() Choose Server > Admin.
Choose Server > Admin.
You see the Control Panel dialog box.
Step 2 ![]() Double-click the fabric name and enter the new name of the fabric.
Double-click the fabric name and enter the new name of the fabric.
Step 3 ![]() Click Apply to change the name.
Click Apply to change the name.
Filtering
Fabric Manager has a filtering mechanism that displays only the data that you are interested in. To filter, first select the fabric and VSAN from the Logical Domains pane. This action narrows the scope of what is displayed in the Fabric pane. Any information that does not belong to the selected items is dimmed. Also, any information that does not belong to the selected items is not displayed in the tables in the Information pane. As shown in Figure 5-12, the filter that you select is displayed at the top right of the Fabric Manager window.
To further narrow the scope, select attributes from the Physical Attributes pane. The Fabric Manager table, display, and filter criteria change accordingly.
Physical Attributes Pane
Use the Physical Attributes pane to display a tree of the options available for managing the switches in the currently selected fabric, VSAN, or zone.
To select an option, click a folder to display the options available and then click the option. You see the table with information for the selected option in the Information pane. The Physical Attributes pane provides the following main folders:
•![]() Switches—Views and configures hardware, system, licensing, and configuration files.
Switches—Views and configures hardware, system, licensing, and configuration files.
•![]() Interfaces—Views and configures FC physical, FC logical, VFC (FCoE), Ethernet, SVC, and PortChannel interfaces.
Interfaces—Views and configures FC physical, FC logical, VFC (FCoE), Ethernet, SVC, and PortChannel interfaces.
•![]() FC Services—Views and configures Fibre Channel network configurations.
FC Services—Views and configures Fibre Channel network configurations.
•![]() IP—Views and configures IP storage and IP services.
IP—Views and configures IP storage and IP services.
•![]() Events—Views and configures events, alarms, thresholds, notifications, and informs.
Events—Views and configures events, alarms, thresholds, notifications, and informs.
•![]() Security—Views and configures MDS management and FC-SP security.
Security—Views and configures MDS management and FC-SP security.
•![]() ISLs—Views and configures Inter-Switch Links.
ISLs—Views and configures Inter-Switch Links.
•![]() End Devices—Views and configures end devices.
End Devices—Views and configures end devices.

Note ![]() You cannot view the detailed physical attributes of theData center switches or monitor the connections. When you select either a Data center node or a LAN node the physical attributes pane will be blank.
You cannot view the detailed physical attributes of theData center switches or monitor the connections. When you select either a Data center node or a LAN node the physical attributes pane will be blank.
Context Menu for Tables
When you right-click in the table, you see a pop-up menu with options that vary depending on the type of option you selected in the Physical Attributes pane. You can perform various operations by right-clicking the device listed in the table. To view various options available for switches, ISLs, and end devices, refer to the procedures in the sections that follows:
Switch Options
When you select the Datacenter node, the switch table displays all the switches that are discovered. When you select the SAN node or the fabric node, the switch table displays all the Fibre Channel switches and when you select the LAN node, the switch table displays all the Ethernet switches.
To view the options for the switch table, follow these steps:
Step 1 ![]() Click Switches in the Physical Attributes pane.
Click Switches in the Physical Attributes pane.
Step 2 ![]() Right-click the device in the table.
Right-click the device in the table.
The pop-up menu provides the following options:
•![]() Apply Changes—Applies the changes to the switch.
Apply Changes—Applies the changes to the switch.
•![]() Refresh Values—Refreshes the current values.
Refresh Values—Refreshes the current values.
•![]() Undo Changes—Undoes modifications to the switch.
Undo Changes—Undoes modifications to the switch.
•![]() Export to File—Export the values to a file.
Export to File—Export the values to a file.
•![]() Print Table—Prints the table.
Print Table—Prints the table.
•![]() Detach Table—Detaches the table.
Detach Table—Detaches the table.
•![]() Switch Attributes—Changes the switch properties.
Switch Attributes—Changes the switch properties.
•![]() Interface Attributes—Changes the interface properties.
Interface Attributes—Changes the interface properties.
•![]() Element Manager—Manages this switch.
Element Manager—Manages this switch.
•![]() Command Line Interface—Enables to perform command line operations.
Command Line Interface—Enables to perform command line operations.
•![]() Copy—Copies the switch.
Copy—Copies the switch.
•![]() Purge—Purges the switch.
Purge—Purges the switch.
•![]() Fix Location—Fixes the switch in the current location.
Fix Location—Fixes the switch in the current location.
•![]() Align—Aligns the switch.
Align—Aligns the switch.
•![]() Show End Devices—Shows the end devices.
Show End Devices—Shows the end devices.
•![]() Expand Multiple Links—Expands the links to this switch.
Expand Multiple Links—Expands the links to this switch.
•![]() Other—Other options.
Other—Other options.
•![]() Group—Groups switches.
Group—Groups switches.
ISL Options
When you select the Datacenter node, the ISLs table displays all of the Fibre Channel and Ethernet links. When you select the LAN node, the ISLs table displays all the Ethernet links.
To view the options for the ISLs table, follow these steps:
Step 1 ![]() In the Physical Attributes pane, click ISLs and then click Summary tab.
In the Physical Attributes pane, click ISLs and then click Summary tab.
Step 2 ![]() Right-click the device in the table.
Right-click the device in the table.
The pop-up menu provides the following options:
•![]() Refresh Values—Refreshes the current values.
Refresh Values—Refreshes the current values.
•![]() Copy—Copies information from a specific field.
Copy—Copies information from a specific field.
•![]() Find—Conducts search based on the input string.
Find—Conducts search based on the input string.
•![]() Export to File—Exports the values to a file.
Export to File—Exports the values to a file.
•![]() Print Table—Prints the table.
Print Table—Prints the table.
•![]() Detach Table—Detaches the table.
Detach Table—Detaches the table.
•![]() Interface Attributes—Changes the interface properties.
Interface Attributes—Changes the interface properties.
•![]() Element Manager—Manages the device.
Element Manager—Manages the device.
•![]() FCIP Tunnel Attributes—Changes FCIP tunneling properties.
FCIP Tunnel Attributes—Changes FCIP tunneling properties.
•![]() Create Port Channel—Creates port channel.
Create Port Channel—Creates port channel.
•![]() Re-enable—Reenables a disabled device.
Re-enable—Reenables a disabled device.
•![]() Enable FC-SP—Enables FC-SP.
Enable FC-SP—Enables FC-SP.
•![]() SAN Extention Tuner—Optimizes FCIP performance.
SAN Extention Tuner—Optimizes FCIP performance.
•![]() Purge—Purges the device.
Purge—Purges the device.

Note ![]() When you select a port channel from the table, the pop-up menu will have the following additional options:
When you select a port channel from the table, the pop-up menu will have the following additional options:
•![]() Member Attributes—Changes the member properties.
Member Attributes—Changes the member properties.
•![]() Channel Attributes—Changes the port channel properties.
Channel Attributes—Changes the port channel properties.
•![]() Edit—Edits the channel properties.
Edit—Edits the channel properties.
End Device Options
To view the options for the end devices table, follow these steps:
Step 1 ![]() In the Physical Attributes pane, click End Devices and then click the Summary tab.
In the Physical Attributes pane, click End Devices and then click the Summary tab.
Step 2 ![]() Right-click the device in the table.
Right-click the device in the table.
The pop-up menu provides the following options:
•![]() Apply Changes—Applies the changes to the device.
Apply Changes—Applies the changes to the device.
•![]() Refresh Values—Refreshes the current values.
Refresh Values—Refreshes the current values.
•![]() Copy—Copies the information specific to the field.
Copy—Copies the information specific to the field.
•![]() Paste—Pastes the copied text.
Paste—Pastes the copied text.
•![]() Undo Changes—Undoes modifications to the device.
Undo Changes—Undoes modifications to the device.
•![]() Find—Searches for information depending on the input string.
Find—Searches for information depending on the input string.
•![]() Export to File—Exports the values to a file.
Export to File—Exports the values to a file.
•![]() Print Table—Prints the table.
Print Table—Prints the table.
•![]() Detach Table—Detaches the table.
Detach Table—Detaches the table.
•![]() Device Attributes—Changes the device properties.
Device Attributes—Changes the device properties.
•![]() Interface Attributes—Changes the interface properties.
Interface Attributes—Changes the interface properties.
•![]() Element Manager—Manages this device.
Element Manager—Manages this device.
•![]() Command Line Interface—Enables you to perform command line operations.
Command Line Interface—Enables you to perform command line operations.
•![]() Copy—Copies the switch.
Copy—Copies the switch.
•![]() Purge—Purges the switch.
Purge—Purges the switch.
•![]() Fix Location—Fixes the switch in the current location.
Fix Location—Fixes the switch in the current location.
•![]() Align—Aligns the switch.
Align—Aligns the switch.
•![]() Ping—Pings another device.
Ping—Pings another device.
•![]() Trace Route—Determines the route taken by packets across the network.
Trace Route—Determines the route taken by packets across the network.
•![]() Select Dependent Ports—Selects dependent ports.
Select Dependent Ports—Selects dependent ports.
•![]() Group—Groups devices.
Group—Groups devices.
Information Pane
Use the Information pane to display tables of information associated with the option selected from the menu tree in the Logical Domains or Physical Attributes panes. The Information pane toolbar provides buttons for performing one or more of the operations shown in Table 5-4.
|
|
|
|---|---|

|
Applies configuration changes. |

|
Refreshes table values. |

|
Opens the appropriate dialog box to make a new row in the table. |

|
Deletes the currently highlighted rows from the table. |

|
Copies data from one row to another. |

|
Pastes the data from one row to another. |

|
Undoes the most recent change. |

|
Finds a specified string in the table. |

|
Exports and saves information to a file. |

|
Prints the contents of the Information pane. |

|
Displays a non-editable copy of the table in the Information pane in its own window, which you can move around the screen. |

Note ![]() After making changes, you must save the configuration or the changes will be lost when the device is restarted.
After making changes, you must save the configuration or the changes will be lost when the device is restarted.

Note ![]() The buttons that appear on the toolbar vary according to the option that you select. They are activated or deactivated (dimmed) according to the field or other object that you select in the Information pane.
The buttons that appear on the toolbar vary according to the option that you select. They are activated or deactivated (dimmed) according to the field or other object that you select in the Information pane.
Detachable Tables
Detachable tables in Fabric Manager allow you to detach tables and move them to different areas on your desktop so that you can compare similar tables from different VSANs. You can keep informational tables open from one view while you examine a different area in Fabric Manager. To detach tables, click the Detach Table icon in the Information pane in Fabric Manager.
Fabric Pane
Use the Fabric pane to display the graphical representation of your fabric. Table 5-5 explains the graphics you may see displayed, depending on which devices you have in your fabric.
|
|
|
|---|---|

|
Director class MDS 9000 Fibre Channel switch. |

|
Non-director class MDS 9000 Fibre Channel switch. |

|
Nexus 7000 switch. |

|
Nexus FCoE or Fibre Channel switch. |

|
Catalyst LAN switch. |

|
Generic Fibre Channel switch. |

|
Cisco SN5428. |

|
Dashed or dotted orange line through a device indicates that the device is manageable but there are operational problems. |

|
Dashed or dotted orange X through a device or link indicates that the device or ISL is not working properly. |

|
A red line through a device indicates that the device is not manageable. |

|
A red X through a device or link indicates that the device is down or that the ISL is down. |

|
Fibre Channel HBA (or enclosure). |

|
Fibre Channel target (or enclosure). |

|
iSCSI host. |

|
Fibre Channel ISL and edge connection. |

|
Fibre Channel PortChannel. |

|
IP ISL and edge connection. |

|
IP PortChannel. |

|
DWDM connection. |

|
NPV connection. |

|
Fibre Channel loop (storage). |

|
IP cloud (hosts). This icon is also used to represent a fabric when viewing a SAN (multiple fabrics) in the Fabric Manager Fabric pane. |

|
Any device, cloud, or loop with a box around it means that there are hidden links attached. |
If a switch or director is grayed out, Fabric Manager can no longer communicate with it.
The bottom of the Fabric pane has the following tabs:
•![]() Fabric—When displaying multiple fabrics, each fabric has its own tab. You can switch between fabrics by clicking on their respective tabs.
Fabric—When displaying multiple fabrics, each fabric has its own tab. You can switch between fabrics by clicking on their respective tabs.
•![]() Log—Displays messages that describe Fabric Manager operations, such as fabric discovery.
Log—Displays messages that describe Fabric Manager operations, such as fabric discovery.
•![]() Events—Displays information about the SNMP traps received by the management station. This includes combination events as detected by discovery and important traps such as license, SNMP, and FICON.
Events—Displays information about the SNMP traps received by the management station. This includes combination events as detected by discovery and important traps such as license, SNMP, and FICON.
When viewing large fabrics in the Fabric pane, it is helpful to do the following tasks:
•![]() Turn off end device labels.
Turn off end device labels.
•![]() Collapse loops.
Collapse loops.
•![]() Collapse expanded multiple links (collapsed multiple links are shown as very thick single lines).
Collapse expanded multiple links (collapsed multiple links are shown as very thick single lines).
•![]() Dim or hide portions of your fabric by VSAN.
Dim or hide portions of your fabric by VSAN.

Note ![]() When a VSAN, zone, or zone member is selected in the VSAN tree, the map highlighting changes to identify the selected objects. To remove this highlighting, click the Clear Highlight button on the Fabric pane toolbar or choose Clear Highlight from the pop-up menu.
When a VSAN, zone, or zone member is selected in the VSAN tree, the map highlighting changes to identify the selected objects. To remove this highlighting, click the Clear Highlight button on the Fabric pane toolbar or choose Clear Highlight from the pop-up menu.
Context Menus
When you right-click an icon in the Fabric pane, you see a pop-up menu with options that vary depending on the type of icon selected. The various options available for different objects include the following:
•![]() Open an instance of Device Manager for the selected switch.
Open an instance of Device Manager for the selected switch.
•![]() Open a CLI session for the selected switch.
Open a CLI session for the selected switch.
•![]() Copy the display name of the selected object.
Copy the display name of the selected object.
•![]() Execute a ping or traceroute command for the device.
Execute a ping or traceroute command for the device.
•![]() Show or hide end devices.
Show or hide end devices.
•![]() View attributes.
View attributes.
•![]() Quiesce and disable members for PortChannels.
Quiesce and disable members for PortChannels.
•![]() Set the trunking mode for an ISL.
Set the trunking mode for an ISL.
•![]() Create or add to a PortChannel for selected ISLs.
Create or add to a PortChannel for selected ISLs.
The Fabric pane has its own toolbar with options for saving, printing, and changing the appearance of the map. When you right-click the map, a pop-up menu appears that provides options (duplicated on the toolbar) for changing the appearance of the map.

Note ![]() You can launch web-based or non-web-based applications from the Fabric pane. To do this, you assign an IP address to the storage port or enclosure. Then right-click to bring up the pop-up menu, and select Device Manager.
You can launch web-based or non-web-based applications from the Fabric pane. To do this, you assign an IP address to the storage port or enclosure. Then right-click to bring up the pop-up menu, and select Device Manager.
Saving the Map
You can save the map in the Fabric Pane as an image, or as an editable Visio diagram. You can save the map with or without labels on the links. The created Visio diagram is editable and saved in two layers:
•![]() The default layer includes all switches and links in the fabric.
The default layer includes all switches and links in the fabric.
•![]() The end devices layer includes the end devices and can be turned off to remove end devices from the Visio diagram.
The end devices layer includes the end devices and can be turned off to remove end devices from the Visio diagram.
To save the map as a Visio diagram, select Files > Export > Visio and choose Map or Map with link labels. The saved Visio diagram retains the viewing options that you selected from the Fabric pane. For example, if you collapse multiple links in the map and export the links as a Visio diagram, the Visio diagram shows those multiple links as one solid link.
The Show Tech Support option from the Tools menu also supports saving the map as a Visio diagram.
Purging Down Elements
The Fabric pane allows you to refresh the map at any time by clicking the Refresh Map icon. The Refresh Map icon redraws the map but does not purge elements that are down. To purge down elements you can:
•![]() Click Server > Purge Down Elements. This purges all down elements in the fabric.
Click Server > Purge Down Elements. This purges all down elements in the fabric.
•![]() Right-click the Fabric pane and select Purge Down Elements.
Right-click the Fabric pane and select Purge Down Elements.
•![]() Right-click a down element and select Purge. This action purges only this element from the fabric.
Right-click a down element and select Purge. This action purges only this element from the fabric.

Note ![]() If you select an element that is not down and purge it, that element will reappear on the next fabric discovery cycle.
If you select an element that is not down and purge it, that element will reappear on the next fabric discovery cycle.
Multiple Fabric Display
Fabric Manager can display multiple fabrics in the same pane (see Figure 5-12).
Figure 5-12 Fabric Manager's Multiple Fabric Display Window
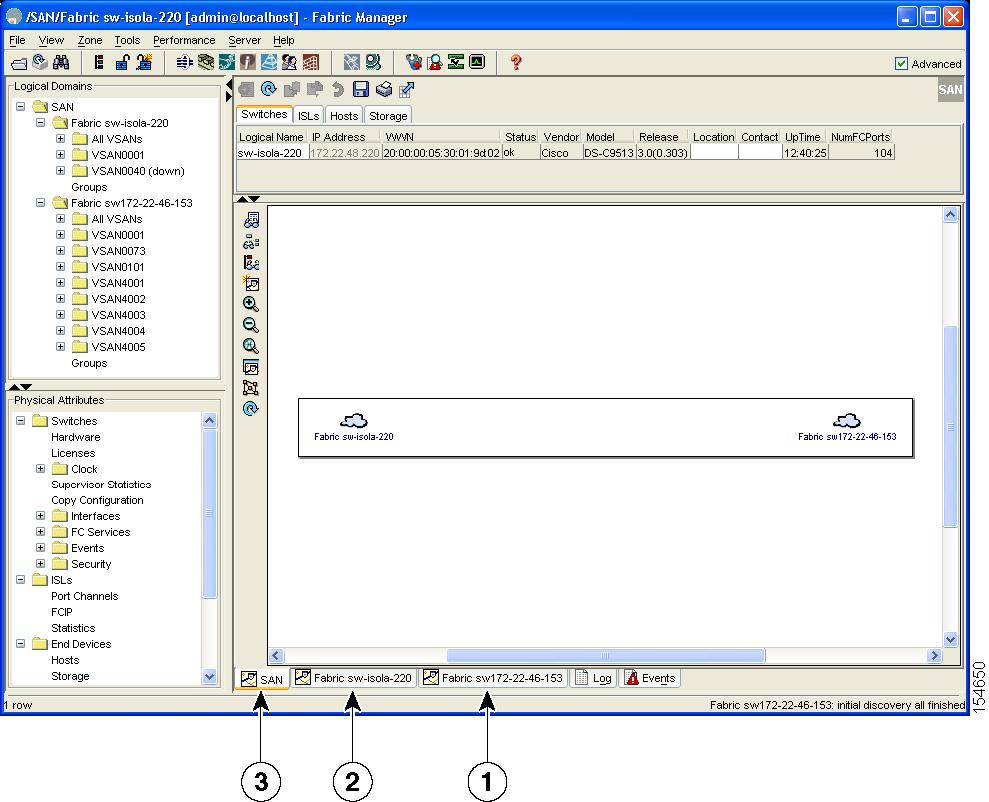
|
|
The Fabric view tab for fabric 172.23.46.152. When selected, the Fabric view displays fabric 172.23.46.152. |
|
|
The Fabric view tab for fabric 172.23.46.153. When selected, the Fabric view displays fabric 172.23.46.153. |
|
|
SAN tab (selected), showing two fabrics. |
The information for both fabrics is displayed; you do not need to select a seed switch. To see details of a fabric, select the tab for that fabric at the bottom of the Fabric pane, or double-click the Cloud icon for the fabric in the SAN tab.

Note ![]() Enclosure names should be unique. If the same enclosure name is used for each port, Fabric Manager shows a host/target enclosure connected to both fabrics. To fix this problem, you can either disable auto-creation or create unique enclosure names.
Enclosure names should be unique. If the same enclosure name is used for each port, Fabric Manager shows a host/target enclosure connected to both fabrics. To fix this problem, you can either disable auto-creation or create unique enclosure names.
Filtering by Groups
You can filter the Fabric pane display by creating groups of switches or end ports. To create a group in Fabric Manager, follow these steps:
Step 1 ![]() Right-click a switch or end port in the Fabric pane map and select Group > Create.
Right-click a switch or end port in the Fabric pane map and select Group > Create.
You see the Edit User Defined Group dialog box shown in Figure 5-13.
Figure 5-13 Edit User Defined Group Dialog Box
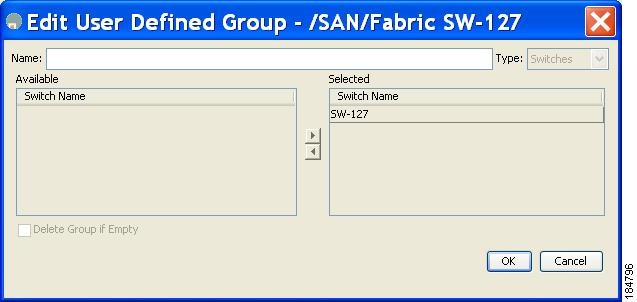
Step 2 ![]() Enter a group name in the Name field.
Enter a group name in the Name field.
Step 3 ![]() Use the arrows to move additional switches or end ports from the Available column to the Selected column.
Use the arrows to move additional switches or end ports from the Available column to the Selected column.
Step 4 ![]() Click OK to save the group.
Click OK to save the group.
To add a switch or end port to an existing group in Fabric Manager, follow these steps:
Step 1 ![]() Right-click a switch or end device and select Group > Add To > YourGroupName.
Right-click a switch or end device and select Group > Add To > YourGroupName.
You see the Edit User Defined Group dialog box (see Figure 5-13).
Step 2 ![]() Use the arrows to move additional switches or end ports from the Available column to the Selected column.
Use the arrows to move additional switches or end ports from the Available column to the Selected column.
Step 3 ![]() Click OK to save the updated group.
Click OK to save the updated group.
To filter the display by a group you have created, follow these steps:
Step 1 ![]() Expand the Groups folder in the Logical Domains pane.
Expand the Groups folder in the Logical Domains pane.
You see the list of groups that you have created as shown in Figure 5-14.
Figure 5-14 Group Highlighted in Fabric Pane Map

Step 2 ![]() Click the name of the group that you want to filter.
Click the name of the group that you want to filter.
In the Fabric pane, the switches or end devices in your group are shown normally; all other switches and end devices are shown in gray.
Step 3 ![]() Click the Groups folder in the Logical Domains pane to return the display to normal.
Click the Groups folder in the Logical Domains pane to return the display to normal.

Note ![]() User-defined groups tables are filtered based on switches in the group except for switches where CFS-controlled features are enabled when all CFS member switches are displayed to avoid misconfigurations.
User-defined groups tables are filtered based on switches in the group except for switches where CFS-controlled features are enabled when all CFS member switches are displayed to avoid misconfigurations.
Status Bar
The status bar at the bottom of the Fabric Manager window shows the last entry displayed by the discovery process, and the possible error message on the right side. The status bar displays a message stating that something has changed in the fabric and a new discovery is needed. The status bar shows both short-term, transient messages (such as the number of rows displayed in the table) and long-term discovery issues.
Setting Fabric Manager Preferences
To set your preferences for the behavior of the Fabric Manager, choose File > Preferences from the Fabric Manager menu bar. You see the Preferences dialog box with the following tabs for setting different components of the application:
•![]() General
General
•![]() SNMP
SNMP
•![]() Map
Map
The default General preferences for Fabric Manager are as follows:
•![]() Show Device Name by—Displays the switches in the Fabric pane by IP address, DNS name, or logical name. The default setting for this value is Logical Name.
Show Device Name by—Displays the switches in the Fabric pane by IP address, DNS name, or logical name. The default setting for this value is Logical Name.
•![]() Show WorldWideName (WWN) Vendor—Displays the world wide name vendor name in any table or listing displayed by Fabric Manager. Check the Prepend Name check box to display the name in front of the IP address of the switch. Check the Replacing Vendor Bytes check box to display the name instead of the IP address. The default is the Prepend Name option.
Show WorldWideName (WWN) Vendor—Displays the world wide name vendor name in any table or listing displayed by Fabric Manager. Check the Prepend Name check box to display the name in front of the IP address of the switch. Check the Replacing Vendor Bytes check box to display the name instead of the IP address. The default is the Prepend Name option.
•![]() Show End Device Using—Displays end devices in the Fabric pane using alias or pWWN alias. The default setting for this value is Alias.
Show End Device Using—Displays end devices in the Fabric pane using alias or pWWN alias. The default setting for this value is Alias.
•![]() Show Shortened iSCSI Names—Displays the default setting for this value is OFF.
Show Shortened iSCSI Names—Displays the default setting for this value is OFF.
•![]() Show Timestamps as Date/Time—Displays timestamps in the date/time format. If this preference is not checked, timestamps are displayed as elapsed time. The default setting is enabled (checked).
Show Timestamps as Date/Time—Displays timestamps in the date/time format. If this preference is not checked, timestamps are displayed as elapsed time. The default setting is enabled (checked).
•![]() Telnet Path—Displays the path for the telnet.exe file on your system. The default is telnet.exe, but you need to browse for the correct location.
Telnet Path—Displays the path for the telnet.exe file on your system. The default is telnet.exe, but you need to browse for the correct location.

Note ![]() If you browse for a path or enter a path and you have a space in the pathname (for example, c:\program files\telnet.exe), then the path will not work. To get the path to work, you must manually place quotes around it (for example, "c:\program files\telnet.exe").
If you browse for a path or enter a path and you have a space in the pathname (for example, c:\program files\telnet.exe), then the path will not work. To get the path to work, you must manually place quotes around it (for example, "c:\program files\telnet.exe").
•![]() Use Secure Shell instead of Telnet—Specifies whether to use SSH or Telnet when using the CLI to communicate with the switch. If enabled, you must specify the path to your SSH application. The default setting is disabled.
Use Secure Shell instead of Telnet—Specifies whether to use SSH or Telnet when using the CLI to communicate with the switch. If enabled, you must specify the path to your SSH application. The default setting is disabled.
•![]() Confirm Deletion—Displays a confirmation pop-up window when you delete part of your configuration using Fabric Manager. The default setting is enabled (checked).
Confirm Deletion—Displays a confirmation pop-up window when you delete part of your configuration using Fabric Manager. The default setting is enabled (checked).
•![]() Export Tables with Format—Specifies the type of file that is created when you export a table using Device Manager. The options are tab-delimited or XML. The default setting is Tab-Delimited.
Export Tables with Format—Specifies the type of file that is created when you export a table using Device Manager. The options are tab-delimited or XML. The default setting is Tab-Delimited.
•![]() Show CFS Warnings—Shows warning messages if CFS is not enabled on all switches for a selected feature.
Show CFS Warnings—Shows warning messages if CFS is not enabled on all switches for a selected feature.
The default SNMP preferences for Fabric Manager are as follows:
•![]() Retry request 1 time(s) after 5 sec timeout—You can set the retry value to 0-5, and the timeout value to 3-30.
Retry request 1 time(s) after 5 sec timeout—You can set the retry value to 0-5, and the timeout value to 3-30.
•![]() Trace SNMP packets in Log—The default setting for this value is ON.
Trace SNMP packets in Log—The default setting for this value is ON.
•![]() Enable Audible Alert when Event Received—The default setting for this value is OFF.
Enable Audible Alert when Event Received—The default setting for this value is OFF.
The default Map preferences for Fabric Manager are as follows:
•![]() Display Unselected VSAN Members—Displays the unselected VSAN members in the Fabric pane. The default setting for this value is ON.
Display Unselected VSAN Members—Displays the unselected VSAN members in the Fabric pane. The default setting for this value is ON.
•![]() Display End Devices—Displays the fabric's end devices in the Fabric pane. The default setting for this value is ON.
Display End Devices—Displays the fabric's end devices in the Fabric pane. The default setting for this value is ON.
•![]() Display End Device Labels—Displays the fabric's end device labels in the Fabric pane. The default setting for this value is OFF.
Display End Device Labels—Displays the fabric's end device labels in the Fabric pane. The default setting for this value is OFF.
•![]() Expand Loops—Displays the loops in the fabric as individual connections in the Fabric pane. The default setting for this value is OFF.
Expand Loops—Displays the loops in the fabric as individual connections in the Fabric pane. The default setting for this value is OFF.
•![]() Expand Multiple Links—Displays multiple links in the Fabric pane as separate lines instead of one thick line. The default setting for this value is OFF.
Expand Multiple Links—Displays multiple links in the Fabric pane as separate lines instead of one thick line. The default setting for this value is OFF.
•![]() Open New Device Manager Each Time—Opens a new instance of Device Manager each time that you invoke it from a switch in your fabric. The default value is OFF, which means that only one instance of Device Manager is open at a time.
Open New Device Manager Each Time—Opens a new instance of Device Manager each time that you invoke it from a switch in your fabric. The default value is OFF, which means that only one instance of Device Manager is open at a time.
•![]() Select Switch or Link from Table—Allows you to select a switch or link in the Fabric pane by clicking the switch or link in a table in the Information pane. The default setting for this value is disabled (unchecked), which means clicking a switch or link in the table does not change the switch or link selection in the Fabric pane.
Select Switch or Link from Table—Allows you to select a switch or link in the Fabric pane by clicking the switch or link in a table in the Information pane. The default setting for this value is disabled (unchecked), which means clicking a switch or link in the table does not change the switch or link selection in the Fabric pane.
•![]() Layout New Devices Automatically—Automatically places new devices in the Fabric pane in an optimal configuration. The default setting for this value is OFF. In this mode, when you add a new device, you must manually reposition it if the initial position does not suit your needs.
Layout New Devices Automatically—Automatically places new devices in the Fabric pane in an optimal configuration. The default setting for this value is OFF. In this mode, when you add a new device, you must manually reposition it if the initial position does not suit your needs.
•![]() Use Quick Layout when Switch has 30 or more End Devices—Displays the default setting for this value (30). You can enter any number in this field. Enter 0 to disable Quick Layout.
Use Quick Layout when Switch has 30 or more End Devices—Displays the default setting for this value (30). You can enter any number in this field. Enter 0 to disable Quick Layout.
•![]() Override Preferences for Non-default Layout—Displays the default setting for this value (ON).
Override Preferences for Non-default Layout—Displays the default setting for this value (ON).
•![]() Automatically Save Layout—If this option is enabled, any changes in the layout are automatically saved. The default setting for this value is ON.
Automatically Save Layout—If this option is enabled, any changes in the layout are automatically saved. The default setting for this value is ON.
•![]() Detach Overview Window—Allows you to easily center the Fabric pane on the area of the fabric that you want to see. (This feature is useful for large fabrics that cannot be displayed entirely within the Fabric pane.) Bring up the overview window by clicking the Show/Hide Overview Window button. It overlays the fabric window and remains there until you click the Show/Hide Overview Window button again. If you enable this preference, you can detach the overview window and move it to one side while you access the Fabric pane. The default setting for this value is disabled (unchecked).
Detach Overview Window—Allows you to easily center the Fabric pane on the area of the fabric that you want to see. (This feature is useful for large fabrics that cannot be displayed entirely within the Fabric pane.) Bring up the overview window by clicking the Show/Hide Overview Window button. It overlays the fabric window and remains there until you click the Show/Hide Overview Window button again. If you enable this preference, you can detach the overview window and move it to one side while you access the Fabric pane. The default setting for this value is disabled (unchecked).
Network Fabric Discovery
Cisco Fabric Manager collects information about the fabric topology through SNMP queries to the switches that are connected to Fabric Manager. The switch replies after having discovered all devices connected to the fabric by using the information from its FSPF technology database and the Name Server database and collected using the Fabric Configuration Server's request/response mechanisms that are defined by the FC-GS-3/4 standard. When you start Fabric Manager, you enter the IP address (or host name) of a seed switch for discovery.
After you start Fabric Manager and the discovery completes, Fabric Manager presents you with a view of your network fabric, including all discovered switches, hosts, and storage devices.
Network LAN Discovery
Starting from NX-OS Release 4.2(0), you can discover Nexus and Catalyst Ethernet switches using Cisco Discovery Protocol (CDP). DataCenter 3(DC3) switches are displayed under Datacenter and LAN nodes. Fabric Manager displays basic information about DC3 switches and its ISLs.
Viewing Ethernet Switches
To view information about Ethernet switches, follow these steps:
Step 1 ![]() Click the LAN node under Datacenter node.
Click the LAN node under Datacenter node.
Step 2 ![]() Click Switches tab in the information pane..
Click Switches tab in the information pane..
You can see the switch information as in Figure 5-15
Figure 5-15 Ethernet Switch Information
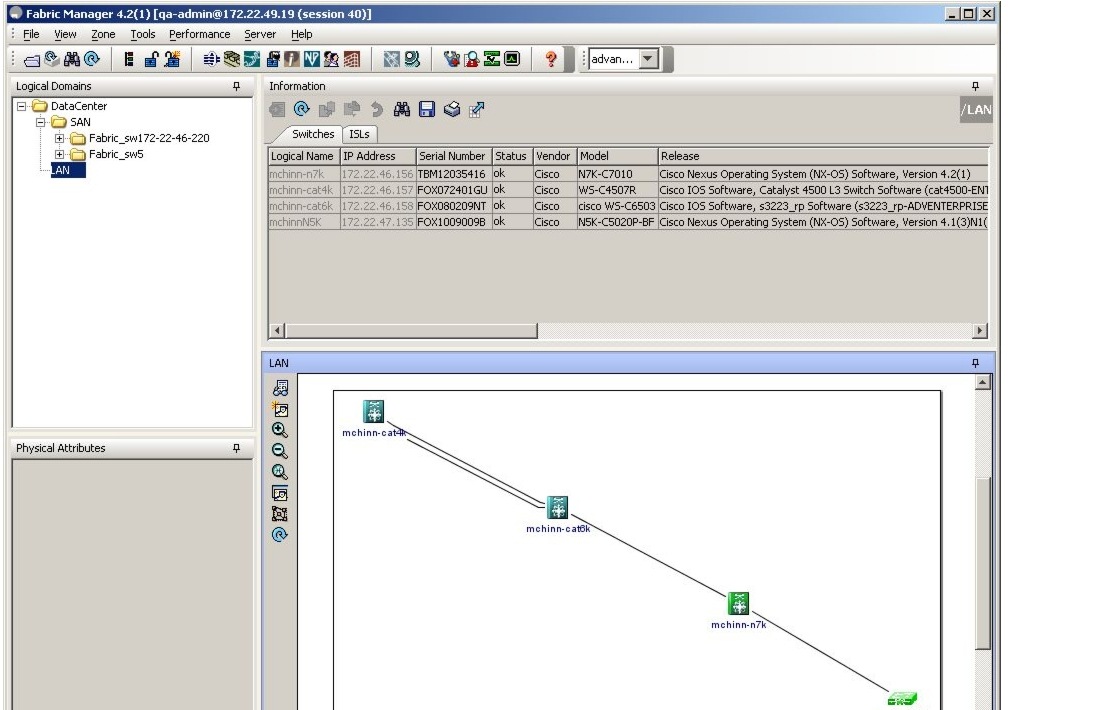

Note ![]() Datacenter is the parent node of SAN and LAN nodes. The SAN node remains in the tree as the parent for all the fabrics.
Datacenter is the parent node of SAN and LAN nodes. The SAN node remains in the tree as the parent for all the fabrics.
Removing a LAN
To remove a discovered LAN from the server, follow these steps:
Step 1 ![]() Choose Server > Admin.
Choose Server > Admin.
You can see the switch information as in Figure 5-16
Figure 5-16
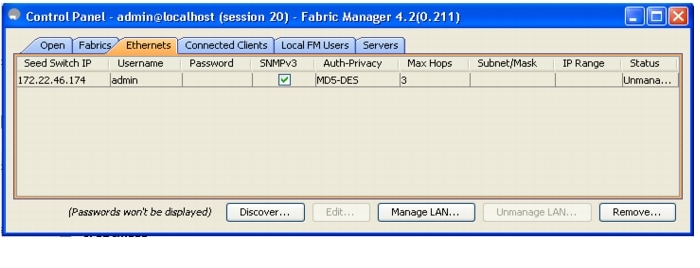
Control Panel
Step 2 ![]() Click to select the switch IP of the LAN you want to remove.
Click to select the switch IP of the LAN you want to remove.
Step 3 ![]() Click Remove.
Click Remove.
Modifying the Device Grouping
Because not all devices are capable of responding to FC-GS-3 requests, different ports of a single server or storage subsystem may be displayed as individual end devices on the Fabric Manager map.
To group end devices in a single enclosure to have them represented by a single icon on the map, Fabric Manager, follow these steps:
Step 1 ![]() Expand End Devices and then select Storage or Hosts in the Physical Attributes pane.
Expand End Devices and then select Storage or Hosts in the Physical Attributes pane.
You see the end devices displayed in the Information pane.
Step 2 ![]() Click one of the devices in the Fabric pane, or click the Enclosures tab of the Information pane, and then click the device name (in the Name field) that you want to include in the enclosure.
Click one of the devices in the Fabric pane, or click the Enclosures tab of the Information pane, and then click the device name (in the Name field) that you want to include in the enclosure.
Step 3 ![]() Enter a name to identify the new enclosure in the Fabric pane map.
Enter a name to identify the new enclosure in the Fabric pane map.
Step 4 ![]() Click once on the device name in the Name field. To select more than one name, press the Shift key and click each of the other names.
Click once on the device name in the Name field. To select more than one name, press the Shift key and click each of the other names.
Step 5 ![]() Press Ctrl-C to copy the selected name(s).
Press Ctrl-C to copy the selected name(s).
Step 6 ![]() Press Ctrl-V to paste the device name into the Name field.
Press Ctrl-V to paste the device name into the Name field.

Note ![]() To remove devices from an enclosure, triple click the device name and press Delete. To remove an enclosure, repeat this step for each device in the enclosure.
To remove devices from an enclosure, triple click the device name and press Delete. To remove an enclosure, repeat this step for each device in the enclosure.
Using Alias Names as Enclosures
To create an enclosure that uses the alias name as the name of the enclosure using Fabric Manager, follow these steps:
Step 1 ![]() Expand End Devices and select Hosts or Storage from the Physical Attributes pane.
Expand End Devices and select Hosts or Storage from the Physical Attributes pane.
You see the list of devices in the Information pane. The NxPorts tab is the default.
Step 2 ![]() Right-click the enclosure names that you want to convert to alias names and select Alias > Enclosure as shown in Figure 5-17.
Right-click the enclosure names that you want to convert to alias names and select Alias > Enclosure as shown in Figure 5-17.
Figure 5-17 Alias Enclosure
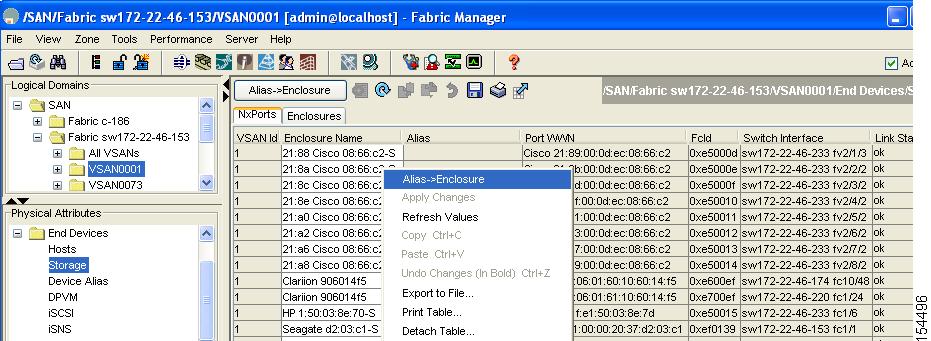
The Ailas > Enclosures window appears as shown in Figure 5-18. It contains a list of expressions. You can also add expressions to the list and modify expressions in the current list.
Figure 5-18
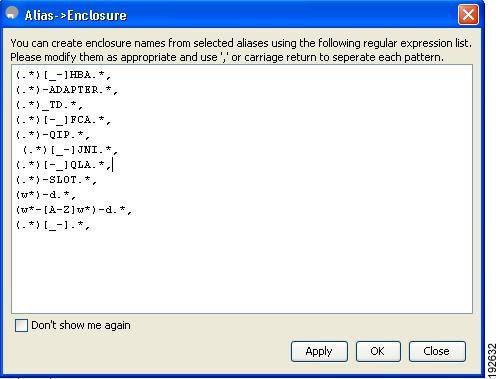
List of Expressions
Step 3 ![]() Click the Apply Changes icon to save the changes and then click Close.
Click the Apply Changes icon to save the changes and then click Close.

Note ![]() Fabric Manager uses the regular expressions to convert multiple alias names into one enclosure. The alias names should be in the same expression pattern rule. You can create enclosure names from selected aliases using the regular expresssions list.
Fabric Manager uses the regular expressions to convert multiple alias names into one enclosure. The alias names should be in the same expression pattern rule. You can create enclosure names from selected aliases using the regular expresssions list.
Using Alias Names as Descriptions
To create descriptions that uses alias names as the name of the description using Fabric Manager, follow these steps:
Step 1 ![]() Select End Devices and from the Physical Attributes pane.
Select End Devices and from the Physical Attributes pane.
Step 2 ![]() Click the General tab.
Click the General tab.
You see the list of devices in the Information pane.
Step 3 ![]() Select the device names that you want to populate the description with alias names and then click Alias > Enclosure button as shown in Figure 5-19.
Select the device names that you want to populate the description with alias names and then click Alias > Enclosure button as shown in Figure 5-19.
You see the alias names are copied to corresponding rows in the description column.
Figure 5-19 Data Population: Alias to Description
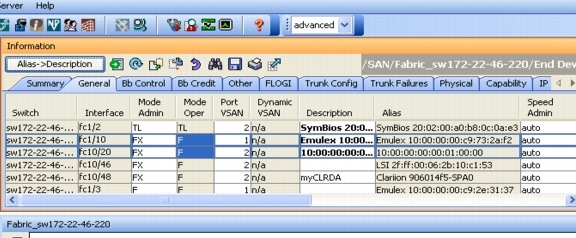

Note ![]() Fabric Manager does not parse or format the alias name while copying.
Fabric Manager does not parse or format the alias name while copying.
Controlling Administrator Access with Users and Roles
Cisco MDS 9000 Family switches support role-based management access whether using the CLI or Cisco Fabric Manager. This lets you assign specific management privileges to particular roles and then assign one or more users to each role.
The default-role contains the access permissions needed by a user to access the GUI (Fabric Manager and Device Manager). These access permissions are automatically granted to all users in order for them to use the GUI.
Cisco Fabric Manager uses SNMPv3 to establish role-based management access. After completing the setup routine, a single role, user name, and password are established. The role assigned to this user allows the highest level of privileges, which includes creating users and roles. Use the Cisco Fabric Manager to create roles and users and to assign passwords as required for secure management access in your network.
Using Fabric Manager Wizards
Fabric Manager Client provides the following wizards to facilitate common configuration tasks:
•![]() VSAN—Creates VSANs on multiple switches in the fabric and sets VSAN attributes including interop mode, load balancing, and FICON.
VSAN—Creates VSANs on multiple switches in the fabric and sets VSAN attributes including interop mode, load balancing, and FICON.
•![]() Zone Edit Tool—Creates zone sets, zones, and aliases. Adds members to zones and edits the zone database.
Zone Edit Tool—Creates zone sets, zones, and aliases. Adds members to zones and edits the zone database.
•![]() IVR Zone—Creates IVR zone sets, zones, and aliases. Enables IVR NAT and auto-topology. Adds members to IVR zones, and edits the IVR zone database.
IVR Zone—Creates IVR zone sets, zones, and aliases. Enables IVR NAT and auto-topology. Adds members to IVR zones, and edits the IVR zone database.
•![]() PortChannel—Creates PortChannels from selected ISLs either manually or automatically. Sets PortChannel attributes such as channel ID and trunking mode.
PortChannel—Creates PortChannels from selected ISLs either manually or automatically. Sets PortChannel attributes such as channel ID and trunking mode.
•![]() FCIP—Creates FCIP links between Gigabit Ethernet ports. Enables Fibre Channel write acceleration and IP compression.
FCIP—Creates FCIP links between Gigabit Ethernet ports. Enables Fibre Channel write acceleration and IP compression.
•![]() DPVM—Establishes dynamic port VSAN membership, enables autolearning, and activates the DPVM database.
DPVM—Establishes dynamic port VSAN membership, enables autolearning, and activates the DPVM database.
•![]() Port Security—Prevents unauthorized access to Cisco MDS switches and reports these intrusions to the administrator.
Port Security—Prevents unauthorized access to Cisco MDS switches and reports these intrusions to the administrator.
•![]() iSCSI—Creates zones for iSCSI initiators and adds a VSAN to a target-allowed VSAN list.
iSCSI—Creates zones for iSCSI initiators and adds a VSAN to a target-allowed VSAN list.
•![]() NPV—Reduces the number of Fibre Channel domain IDs in SANs.
NPV—Reduces the number of Fibre Channel domain IDs in SANs.
•![]() QoS—Sets QoS attributes for zones in the selected VSAN.
QoS—Sets QoS attributes for zones in the selected VSAN.
•![]() IP ACL—Creates ordered IP access control lists and distributes to selected switches in the fabric.
IP ACL—Creates ordered IP access control lists and distributes to selected switches in the fabric.
•![]() License Install—Facilitates download and installation of licenses in selected switches in the fabric.
License Install—Facilitates download and installation of licenses in selected switches in the fabric.
•![]() Software Install—Verifies image compatibility and installs software images on selected switches in the fabric.
Software Install—Verifies image compatibility and installs software images on selected switches in the fabric.
Fabric Manager Troubleshooting Tools
Fabric Manager has several troubleshooting tools available from the toolbar or Tools menu
•![]() Zone Merge Analysis—The zone merge analysis tool (available from the Zone menu) enables you to determine if zones will merge successfully when two Cisco MDS switches are interconnected. If the interconnected switch ports allow VSANs with identical names or contain zones with identical names, then Fabric Manager verifies that the zones contain identical members. The merge analysis tool can be run before attempting a merge or after fabrics are interconnected to determine zone merge failure causes.
Zone Merge Analysis—The zone merge analysis tool (available from the Zone menu) enables you to determine if zones will merge successfully when two Cisco MDS switches are interconnected. If the interconnected switch ports allow VSANs with identical names or contain zones with identical names, then Fabric Manager verifies that the zones contain identical members. The merge analysis tool can be run before attempting a merge or after fabrics are interconnected to determine zone merge failure causes.
•![]() End-to-End Connectivity—Fabric Manager's end-to-end connectivity analysis tool uses FC Ping to verify interconnections between Cisco MDS switches and end-device (HBAs and storage devices) in a particular VSAN. In addition to basic connectivity, Fabric Manager can optionally verify the following:
End-to-End Connectivity—Fabric Manager's end-to-end connectivity analysis tool uses FC Ping to verify interconnections between Cisco MDS switches and end-device (HBAs and storage devices) in a particular VSAN. In addition to basic connectivity, Fabric Manager can optionally verify the following:
–![]() Paths are redundant.
Paths are redundant.
–![]() Zones contain at least two members.
Zones contain at least two members.
End devices are connected to a manageable switch (have a currently active in-band or out-of-band management path.)
•![]() Switch Health Analysis—You can run an in-depth switch health analysis with Fabric Manager. It verifies the status of all critical Cisco MDS switches, modules, ports, and Fibre Channel services. Over 40 conditions are checked. This tool provides a very fast, simple, and thorough way to assess Cisco MDS switch health.
Switch Health Analysis—You can run an in-depth switch health analysis with Fabric Manager. It verifies the status of all critical Cisco MDS switches, modules, ports, and Fibre Channel services. Over 40 conditions are checked. This tool provides a very fast, simple, and thorough way to assess Cisco MDS switch health.
•![]() Fabric Configuration Analysis—Fabric Manager includes a fabric configuration analysis tool. It compares the configurations of all Cisco MDS switches in a fabric to a reference switch or a policy file. You can define what functions to check and what type of checks to perform. The analysis can look for mismatched values, and missing or extra values. If all configuration checking is performed for all functions, over 200 checks are performed for each Cisco MDS switch.
Fabric Configuration Analysis—Fabric Manager includes a fabric configuration analysis tool. It compares the configurations of all Cisco MDS switches in a fabric to a reference switch or a policy file. You can define what functions to check and what type of checks to perform. The analysis can look for mismatched values, and missing or extra values. If all configuration checking is performed for all functions, over 200 checks are performed for each Cisco MDS switch.
After the analysis is run, the results are displayed with details about the issues that were discovered. You can automatically resolve configuration differences by selecting them and clicking the Resolve button. Fabric Manager automatically changes the configuration to match the reference switch or policy file.
 Feedback