- Managing Cisco NFVI
- Cisco VIM REST API
- Monitoring Cisco NFVI Performance
- Managing Cisco NFVI Security
- Managing Cisco NFVI Storage
- Overview to Cisco VIM Insight
- Managing Cisco VIM through Insight
- Managing Blueprints
- Managing Pod Through Cisco VIM Insight
- Day 2 Operations of Cisco VIM Insight
- Overview to the Cisco Virtual Topology System
- Managing Backup and Restore Operations
- Troubleshooting
Cisco Virtual Infrastructure Manager Administrator Guide, Release 2.2.11
Bias-Free Language
The documentation set for this product strives to use bias-free language. For the purposes of this documentation set, bias-free is defined as language that does not imply discrimination based on age, disability, gender, racial identity, ethnic identity, sexual orientation, socioeconomic status, and intersectionality. Exceptions may be present in the documentation due to language that is hardcoded in the user interfaces of the product software, language used based on RFP documentation, or language that is used by a referenced third-party product. Learn more about how Cisco is using Inclusive Language.
- Updated:
- January 19, 2018
Chapter: Managing Cisco NFVI
- Managing Cisco NFVI Pods
- Managing Nova Compute Scheduler Filters and User Data
- Utilizing NUMA in Cisco NFV Infrastructure
- Monitoring Cisco NFVI Health with CloudPulse
- Assessing Cisco NFVI status with cloud-sanity
- Service Catalog URL
- Checking Network Connections
- Enabling NFVBench Post Deployment
- NFVBench Usage
Managing Cisco
NFVI
The following topics provide general management procedures that you can perform if your implementation is Cisco VIM by itself or is Cisco VIM and Cisco VIM Insight.
- Managing Cisco NFVI Pods
- Managing Nova Compute Scheduler Filters and User Data
- Utilizing NUMA in Cisco NFV Infrastructure
- Monitoring Cisco NFVI Health with CloudPulse
- Assessing Cisco NFVI status with cloud-sanity
- Service Catalog URL
- Checking Network Connections
- Enabling NFVBench Post Deployment
- NFVBench Usage
- Enabling or Disabling Autobackup of Management Node
- Forwarding ELK logs to External Syslog Server
- Adding and Reconfiguring VIM Administrators
- Reconfigure of Proxy Post Install
- Enabling Custom Policy for VNF Manager Post Install
- Updating Containers in a Running Cisco VIM Cloud
- Updating Cisco VIM Software Using a USB
- Updating Cisco VIM Software Using Network Installation
- Upgrading Containers in a Running Cisco VIM Cloud
- Upgrading VIM Software Using a USB
- Upgrading Cisco VIM Software Using Network Installation
- VM Resizing
- Nova Migrate
Managing Cisco NFVI Pods
You can perform OpenStack management operations on Cisco NFVI pods including addition and removal of Cisco NFVI compute and Ceph nodes, and replacement of controller nodes. Each action is mutually exclusive. Only one pod management action can be performed at any time. Before you perform a pod action, verify that the following requirements are met:
-
The node is part of an existing pod.
-
The node information exists in the setup_data.yaml file, if the pod management task is removal or replacement of a node.
-
The node information does not exist in the setup_data.yaml file, if the pod management task is to add a node.
To perform pod actions, see the Managing Hosts in Cisco VIM or NFVI Podssection.
- General Guidelines for Pod Management
- Identifying the Install Directory
- Managing Hosts in Cisco VIM or NFVI Pods
- Recovering Cisco NFVI Pods
General Guidelines for Pod Management
The setup_data.yaml file is the only user-generated configuration file that is used to install and manage the cloud. While many instances of pod management dictates that the setup_data.yaml file is modified, the administrator does not update the system generated setup_data.yaml file directly.
 Note | To avoid translation errors, we recommend that you avoid cutting and pasting commands from the documents to the Linux CLI. |
To update the setup_data.yaml file, do the following:
- Copy the setup data into a
local directory
[root@mgmt1 ~]# cd /root/
[root@mgmt1 ~]# mkdir MyDir
[root@mgmt1 ~]# cd MyDir
[root@mgmt1 ~]# cp /root/openstack-configs/setup_data.yaml <my_setup_data.yaml>
- Update the setup data
manually.
[root@mgmt1 ~]# vi my_setup_data.yaml (update the targeted fields for the setup_data)
- Run the reconfiguration
command:
[root@mgmt1 ~]# ciscovim –-setupfile ~/MyDir/<my_setup_data.yaml>
<pod_management_action>
In Cisco VIM 2.2, you can edit and enable a selected set of options in the setup_data.yaml file using the reconfigure option. After installation, you can change the values of the feature parameters. But, Cisco VIM 2.2 does not support deconfiguring of the feature .
The following table summarizes the list of features that can be reconfigured after the installation of the pod.
|
Features that can be enabled post pod deployment |
Comments |
|---|---|
|
Optional OpenStack Services |
|
|
Pod Monitoring |
|
|
Export of EFK logs to External Syslog Server |
Reduces single point of failure on management node and provides data aggregation. |
|
Admin Source Networks |
White list filter for accessing management node admin service. |
|
NFVBench |
Tool to help measure cloud performance. Management node needs a 10G Intel NIC (4x10G 710, or 2x10G 520 Intel NIC). |
|
EFK settings |
EFK rotation frequency and size. |
|
OpenStack service password |
Implemented for security reasons, so that OpenStack passwords can be reset on-demand. |
| CIMC Password Reconfigure Post Install | Implemented for security reasons, so that CIMC passwords for C-series pod, can be reset on-demand.(New in 2.2) |
|
SwiftStack Post Install |
Integration with third party Object-Store. SwiftStack install is done independent of VIM and ahead of time; only works with Keystone v2. |
|
TENANT_VLAN_RANGES and PROVIDER_VLAN_RANGES |
Ability to increase the tenant and provider VLAN ranges on a pod that is up and running. It gives the customer the flexibility in network planning. |
|
Export Logs to External Syslog Server |
Ability to offload the OpenStack logs to an external syslog server post-install. |
|
Replace of Failed APIC Hosts and add more leaf nodes |
Ability to replace Failed APIC Hosts, and add more leaf nodes to increase the fabric influence. |
|
Auto backup of Management Node |
Ability to enable/disable auto-backup of Management Node. |
|
VIM Admins |
Ability to configure non-root VIM Administrators. |
|
EXTERNAL_LB_VIP_FQDN |
Ability to enable TLS on external_vip through FQDN. |
|
EXTERNAL_LB_VIP_TLS |
Ability to enable TLS on external_vip through an IP address. |
|
http_proxy and/or https_proxy |
Ability to reconfigure http and/or https proxy servers. |
|
Admin Privileges for VNF Manager (ESC) from a tenant domain |
Ability to enable admin privileges for VNF Manager (ESC) from a tenant domain. |
Identifying the Install Directory
[root@mgmt1 ~]# cd /root/
[root@mgmt1 ~]# ls –lrt | grep openstack-configs
lrwxrwxrwx.  1 root root      38 Mar 12 21:33 openstack-configs -> /root/installer-<tagid>/openstack-configs
From the output, you can understand that the OpenStack-configs is a symbolic link to the installer directory.
Verify that the REST API server is running from the same installer directory location, by executing the following command:
# cd installer-<tagid>/tools
#./restapi.py -a status
Status of the REST API Server:   active (running) since Thu 2016-08-18 09:15:39 UTC; 9h ago
REST API launch directory: /root/installer-<tagid>/
Managing Hosts in Cisco VIM or NFVI Pods
To perform actions on the pod, run the commands specified in the following table. If you log in as root, manually change the directory to /root/installer-xxx to get to the correct working directory for these Cisco NFVI pod commands.
When you add a compute or storage node to a UCS C-Series pod, you can increase the management/provision address pool. Similarly, for a UCS B-Series pod, you can increase the Cisco IMC pool to provide routing space flexibility for pod networking. Along with server information, these are the only items you can change in the setup_data.yaml file after the pod is deployed. To make changes to the management or provisioning sections and/or CIMC (for UCS B-Series pods) network section, you must not change the existing address block as defined on day 0. You can add only to the existing information by adding new address pool block(s) of address pool as shown in the following example:
NETWORKING:
  :
  :

  networks:
  -
    vlan_id: 99
    subnet: 172.31.231.0/25
    gateway: 172.31.231.1
    ## 'pool' can be defined with single ip or a range of ip
    pool:
      - 172.31.231.2, 172.31.231.5 -→ IP address pool on Day-0
      - 172.31.231.7 to 172.31.231.12 -→ IP address pool ext. on Day-n
      - 172.31.231.20
    segments:
    ## CIMC IP allocation. Needs to be an external routable network
      - cimc
  -
    vlan_id: 2001
    subnet: 192.168.11.0/25
    gateway: 192.168.11.1
    ## 'pool' can be defined with single ip or a range of ip
    pool:
      - 192.168.11.2 to 192.168.11.5   -→ IP address pool on Day-0
      - 192.168.11.7 to 192.168.11.12  → IP address pool on day-n
      - 192.168.11.20 → IP address pool on day-n
    segments:
    ## management and provision goes together
      - management
   - provision
  :
  :
The IP address pool is the only change allowed in the networking space of the specified networks management/provision and/or CIMC (for B-series). The overall network must have enough address space to accommodate for future enhancement on day-0. After making the changes to servers, roles, and the corresponding address pool, you can execute the add compute/storage CLI shown above to add new nodes to the pod.
Recovering Cisco NFVI Pods
This section describes the recovery processes for Cisco NFVI control node and the pod that is installed through Cisco VIM. For recovery to succeed, a full Cisco VIM installation must have occurred in the past, and recovery is caused by failure of one or more of the controller services for example, Rabbit MQ, MariaDB, and other services. The management node must be up and running and all the nodes must be accessible through SSH without passwords from the management node. You can also use this procedure to recover from a planned shutdown or accidental power outage.
Cisco VIM supports the following control node recovery command:
# ciscovim cluster-recovery
The control node will recover after the network partition is resolved.
To make sure Nova services are good across compute nodes, execute the following command:
# source /root/openstack-configs/openrc
# nova service-list
To check for the overall cloud status, execute the following:
#  cd installer-<tagid>/tools
# ./cloud_sanity.py -c all
In case of a complete pod outage, you must follow a sequence of steps to bring the pod back. The first step is to bring up the management node, and check that the management node containers are up (and not in exited state) using docker ps –a command. After you bring up the management node, bring up all the other pod nodes. Make sure every node is reachable through password-less SSH from the management node. Verify that no network IP changes have occurred. You can get the node SSH IP access information from /root/openstack-config/mercury_servers_info.
Execute the following command sequence:
-
Check the setup_data.yaml file and runtime consistency on the management node:
# cd /root/installer-<tagid>/tools
# ciscovim run --perform 1,3 -y
-
Execute the cloud sanity command:
# cd/root/installer-<tagid>/tools
# ./cloud_sanity.py -c all
-
Check the status of the REST API server and the corresponding directory where it is running:
# cd/root/installer-<tagid>/tools
#./restapi.py -a status
Status of the REST API Server:  active (running) since Thu 2016-08-18 09:15:39 UTC; 9h ago
REST API launch directory: /root/installer-<tagid>/
-
If the REST API server is not running from the right installer directory, execute the following to get it running from the correct directory:
# cd/root/installer-<tagid>/tools
#./restapi.py -a setup

Check if the REST API server is running from the correct target directory
#./restapi.py -a status
Status of the REST API Server:  active (running) since Thu 2016-08-18 09:15:39 UTC; 9h ago
REST API launch directory: /root/new-installer-<tagid>/
-
Verify Nova services are good across the compute nodes, execute the following command: # source /root/openstack-configs/openrc # nova service-list
If cloud-sanity fails, execute cluster-recovery (ciscovim cluster-recovery), then re-execute the cloud-sanity and nova service-list steps as listed above.
Recovery of compute and OSD nodes requires network connectivity and reboot so that they can be accessed using SSH without password from the management node. To shutdown, bring the pod down in the following sequence:
-
Shut down all VMs, then all the compute nodes.
-
Shut down all storage nodes serially.
-
Shut down all controllers one at a time.
-
Shut down the management node.
-
Shut down the networking gears.
Bring the nodes up in reverse order, that is, start with networking gears, then the management node, storage nodes, control nodes, and compute nodes. Make sure each node type is completely booted up before you move on to the next node type. Then validate the Cisco API server. ciscovim run -–perform 1,3 -y
After the pod is up, run the partition-recovery playbook (ciscovim partition-recovery) on the management node, which will determine the correct order to bring up the Galera cluster by commit ID and start the remaining downed services.
Validate if all the VMs are up (not in shutdown state). If any of the VMs are in down state, bring them UP using the horizon dashboard.
Managing Nova Compute Scheduler Filters and User Data
OpenStack Nova is an OpenStack component that provides on-demand access to compute resources by provisioning large networks of virtual machines (VMs). In addition to the standard Nova filters, Cisco VIM supports the following additional scheduler filters:
-
ServerGroupAffinityFilter—Ensures that an instance is scheduled onto a host from a set of group hosts. To use this filter, you must create a server group with an affinity policy and pass a scheduler hint using group as the key and the server group UUID as the value. Use the nova command-line tool and the --hint flag. For example:
$ nova server-group-create --policy affinity group-1
$ nova boot --image IMAGE_ID --flavor 1 --hint group=SERVER_GROUP_UUID server-1
-
ServerGroupAntiAffinityFilter—Ensures that each group instance is on a different host. To use this filter, you must create a server group with an anti-affinity policy and pass a scheduler hint, using group as the key and the server group UUID as the value. Use the nova command-line tool and the --hint flag. For example:
$ nova server-group-create --policy anti-affinity group-1
$ nova boot --image IMAGE_ID --flavor 1 --hint group=SERVER_GROUP_UUID server-1
-
SameHostFilter—Within an instance set, schedules one instance on the same host as another instance. To use this filter, pass a scheduler hint using same_host as the key and a list of instance UUIDs as the value. Use the nova command-line tool and the --hint flag. For example:
$ nova boot --image IMAGE_ID --flavor 1 --hint same_host=INSTANCE_ID server-1
-
DifferentHostFilter—Within an instance set, schedules one instance on a different host than another instance. To use this filter, pass a scheduler hint using different_host as the key and a list of instance UUIDs as the value. The filter is the opposite of SameHostFilter. Use the novacommand-line tool and the --hint flag. For example:
$ nova boot --image IMAGE_ID --flavor 1 --hint different_host=INSTANCE_ID server-1
In addition to scheduler filters, you can set up user data files for cloud application initializations. A user data file is a special key in the metadata service that holds a file that cloud-aware applications in the guest instance can access. For example, one application that uses user data is the cloud-init system, an open-source package that is available on various Linux distributions. The cloud-init system handles early cloud instance initializations. The typical use case is to pass a shell script or a configuration file as user data during the Nova boot, for example:
$ nova boot --image IMAGE_ID --flavor 1 --hint user-data FILE_LOC server-1
Utilizing NUMA in Cisco NFV Infrastructure
Non-uniform memory access (NUMA) is a method of configuring microprocessor clusters in a multiprocessing system so that they can share memory locally, improving performance, and future system expansion. NUMA is used in symmetric multiprocessing (SMP) systems.
Cisco VIM supports the nova scheduler ability to choose the hypervisor to spawn VMs based on NUMA topologies. If the instances do not have NUMA topologies specified, the filter places no constraints on the compute hosts selection. NUMA allows applications, such as NFV applications, to benefit from CPU pinning and huge pages supported for better performance.
To utilize NUMA, you must define and maintain a list of compute hosts to serve as the NFV hosts. You can configure this list in the setup_data.yaml NFV_HOSTS field. After Cisco VIM is deployed, you must create the host aggregation and NFV flavors that contain the compute hosts where the NFV instances will be scheduled.
By default, CPU has two cores to run host-level general purpose tasks; no additional cores are isolated for host level tasks. The huge page size of Cisco VIM is two MB.
-
While most of the NUMA configurations are enabled on day-0, you can roll-in the disable hyperthreading feature on a newly added compute node. To disable the hyper-threading on a new compute node, update the setup_data.yaml file with the following option and then initiate the addition of the compute nodes:
DISABLE_HYPERTHREADING: True or False; this is optional and
default value is false.
Note
You can not revert the disable hyperthreading feature as the disable-hyperthreading is a non-reversible option in the setup_data.yaml file.
- To disable hyper-threading, on existing computes on day-n, the administrator should remove the existing compute nodes and add new computes.
Note | We recommend you to not run a pod in an hybrid-mode; that is, a sub-set of compute nodes have hyper-threading disabled in them. The administrator has to remove the existing compute nodes and add them as new compute nodes, so that the hyper-threading feature is disabled in all the compute nodes in a pod. |
Monitoring Cisco NFVI Health with CloudPulse
You can query the state of various Cisco NFVI OpenStack end points using CloudPulse, an OpenStack health-checking tool. By default, the tool automatically polls OpenStack Cinder, Glance, Nova, Neutron, Keystone, Rabbit, Mariadb, and Ceph every four minutes. However, you can use a CLI REST API call from the management node to get the status of these services in real time. Also you can integrate the CloudPulse API into your applications and get the health of the OpenStack services on demand. You can find additional information about using CloudPulse in the following OpenStack sites:
-
https://wiki.openstack.org/wiki/Cloudpulse/DeveloperNotes
-
https://wiki.openstack.org/wiki/Cloudpulse/OperatorTests
CloudPulse has two set of tests: endpoint_scenario (runs as a cron or manually) and operator test (run manually). The supported Cloudpulse tests groups include:
Operator tests include:
-
ceph_check—Executes the command, "ceph -f json status" on the Ceph-mon nodes and parses the output. If the result of the output is not “HEALTH_OK” ceph_check will report an error.
-
docker_check—Finds out if all the Docker containers are in the running state in all the nodes. It will report an error if any containers are in the Exited state. It runs the command “docker ps -aq --filter 'status=exited'”.
-
galera_check—Executes the command, "mysql 'SHOW STATUS;” on the controller nodes and displays the status.
-
node_check—Checks if all the nodes in the system are up and online. It also compares the result of “nova hypervisor list” and finds out if all the computes are available.
-
rabbitmq_check—Runs the command, “rabbitmqctl cluster_status” on the controller nodes and finds out if the rabbitmq cluster is in quorum. If nodes are offline in the cluster rabbitmq_check will report as failed.
CloudPulse servers are installed in containers on all control nodes. The CloudPulse client is installed on the management node by the Cisco VIM installer. To execute CloudPulse, source the openrc file in the openstack-configs directory and execute the following:
[root@MercRegTB1 openstack-configs]# cloudpulse --help
usage: cloudpulse [--version] [--debug] [--os-cache]
                  [--os-region-name <region-name>]
                  [--os-tenant-id <auth-tenant-id>]
                  [--service-type <service-type>]
                  [--endpoint-type <endpoint-type>]
                  [--cloudpulse-api-version <cloudpulse-api-ver>]
                  [--os-cacert <ca-certificate>] [--insecure]
                  [--bypass-url <bypass-url>] [--os-auth-system <auth-system>]
                  [--os-username <username>] [--os-password <password>]
                  [--os-tenant-name <tenant-name>] [--os-token <token>]
                  [--os-auth-url <auth-url>]
                  <subcommand> ...
# cd /root/openstack-configs
# source openrc
# cloudpulse result
+--------------------------------------+------+-------------------+----------+---------+
| uuid                                 | id   | name              | testtype | state   |
+--------------------------------------+------+-------------------+----------+---------+
| bf7fac70-7e46-4577-b339-b1535b6237e8 | 3788 | glance_endpoint   | periodic | success |
| 1f575ad6-0679-4e5d-bc15-952bade09f19 | 3791 | nova_endpoint     | periodic | success |
| 765083d0-e000-4146-8235-ca106fa89864 | 3794 | neutron_endpoint  | periodic | success |
| c1c8e3ea-29bf-4fa8-91dd-c13a31042114 | 3797 | cinder_endpoint   | periodic | success |
| 04b0cb48-16a3-40d3-aa18-582b8d25e105 | 3800 | keystone_endpoint | periodic | success |
| db42185f-12d9-47ff-b2f9-4337744bf7e5 | 3803 | glance_endpoint   | periodic | success |
| 90aa9e7c-99ea-4410-8516-1c08beb4144e | 3806 | nova_endpoint     | periodic | success |
| d393a959-c727-4b5e-9893-e229efb88893 | 3809 | neutron_endpoint  | periodic | success |
| 50c31b57-d4e6-4cf1-a461-8228fa7a9be1 | 3812 | cinder_endpoint   | periodic | success |
| d1245146-2683-40da-b0e6-dbf56e5f4379 | 3815 | keystone_endpoint | periodic | success |
| ce8b9165-5f26-4610-963c-3ff12062a10a | 3818 | glance_endpoint   | periodic | success |
| 6a727168-8d47-4a1d-8aa0-65b942898214 | 3821 | nova_endpoint     | periodic | success |
| 6fbf48ad-d97f-4a41-be39-e04668a328fd | 3824 | neutron_endpoint  | periodic | success |
+--------------------------------------+------+-------------------+----------+---------+
# cd /root/openstack-configs
# source openrc
# cloudpulse test-list
# cd /root/openstack-configs
# source openrc
# cloudpulse run --name <test_name>
# cloudpulse run  --all-tests
# cloudpulse run --all-endpoint-tests
# cloudpulse run --all-operator-tests
# cloudpulse run –-name neutron_endpoint
+------------+--------------------------------------+
| Property   | Value                                |
+------------+--------------------------------------+
| name       | neutron_endpoint                     |
| created_at | 2016-03-29T02:20:16.840581+00:00     |
| updated_at | None                                 |
| state      | scheduled                            |
| result     | NotYetRun                            |
| testtype   | manual                               |
| id         | 3827                                 |
| uuid       | 5cc39fa8-826c-4a91-9514-6c6de050e503 |
+------------+--------------------------------------+
#cloudpulse show 5cc39fa8-826c-4a91-9514-6c6de050e503
+------------+--------------------------------------+
| Property   | Value                                |
+------------+--------------------------------------+
| name       | neutron_endpoint                     |
| created_at | 2016-03-29T02:20:16+00:00            |
| updated_at | 2016-03-29T02:20:41+00:00            |
| state      | success                              |
| result     | success                              |
| testtype   | manual                               |
| id         | 3827                                 |
| uuid       | 5cc39fa8-826c-4a91-9514-6c6de050e503 |
+------------+--------------------------------------+
To see the CloudPulse options, source the openrc file in openstack-configs dir and execute:
#cloudpulse --help
The cloudpulse project has a RESTful Http service called the Openstack Health API. Through this API cloudpulse allows the user to list the cloudpulse tests, create new cloudpulse tests and see the results of the cloudpulse results.
All API calls described in this documentation require keystone authentication. We can use the keystone v2 or v3 version for the authentication. The corresponding configuration should be configured properly in the cloudpulse config in order that the cloudpulse can reach the v2 or the v3 keystone API
The Identity service generates authentication tokens that permit access to the Cloudpulse REST APIs. Clients obtain this token and the URL endpoints for other service APIs by supplying their valid credentials to the authentication service. Each time you make a REST API request to Cloudpulse, you supply your authentication token in the X-Auth-Token request header.
Assessing Cisco NFVI status with cloud-sanity
The cloud-sanity tool is designed to give you a quick overall status of the Pods health. Cloud-sanity can run tests on all node types in the Pod: management, control, compute and ceph storage.
The following are test areas supported in cloud-sanity:
-
RAID Disk health checks.
-
Basic network connectivity between the management node and all other nodes in the Pod.
-
Mariadb cluster size.
-
RabbitMQ operation and status.
-
Nova service and hypervisor list.
-
CEPHMon operation and status.
-
CEPHOSD operation and status.
To run the cloud-sanity tool, login to the management node and navigate to the tools directory for the installation currently running. Below are the cloud-sanity run options, cloud-sanity can be run on all nodes or a particular target role.
| Step 1 | To run the cloud
sanity complete the following steps:
# cd /root/installer-<tag>/tools
# ./cloud_sanity.py –h
usage: cloud_sanity.py [-h] [--check CHECK] [--list] [--verbose]

cloud sanity helper

optional arguments:
  -h, --help            show this help message and exit
  --check CHECK, -c CHECK
                        all - Run all sanity checks. [default action]
                        control - Run controller sanity checks.
                        compute - Run compute sanity checks.
                        cephmon - Run cephmon sanity checks.
                        cephosd - Run cephosd sanity checks.
                        management - Run Management node sanity checks
  --list, -l            List all the available sanity checks.
  --verbose, -v         Run the sanity in verbose mode.
| ||
| Step 2 | To run all the
cloud-sanity tests select "all" as the check option.
./cloud_sanity.py --check all
Executing All Cloud Sanity in quiet mode. This will take some time.
Cloud Sanity Results
+-------------+------------------------------------------------------------+---------+
| Role        | Task                                                       | Result  |
+-------------+------------------------------------------------------------+---------+
| Management  | Management - Disk maintenance RAID Health **************** | PASSED  |
|             |                                                            |         |
| Management  | Management - Disk maintenance VD Health ****************** | PASSED  |
|             |                                                            |         |
| Control     | Control - Ping All Controller Nodes ********************** | PASSED  |
|             |                                                            |         |
| Control     | Control - Ping internal VIP ****************************** | PASSED  |
|             |                                                            |         |
| Control     | Control - Check Mariadb cluster size ********************* | PASSED  |
|             |                                                            |         |
| Control     | Control - Check RabbitMQ is running ********************** | PASSED  |
|             |                                                            |         |
| Control     | Control - Check RabbitMQ cluster status ****************** | PASSED  |
|             |                                                            |         |
| Control     | Control - Check Nova service list ************************ | PASSED  |
|             |                                                            |         |
| Control     | Control - Disk maintenance RAID Health ******************* | PASSED  |
|             |                                                            |         |
| Control     | Control - Disk maintenance VD Health ********************* | PASSED  |
|             |                                                            |         |
| Compute     | Compute - Ping All Compute Nodes ************************* | PASSED  |
|             |                                                            |         |
| Compute     | Compute - Check Nova Hypervisor list ********************* | PASSED  |
|             |                                                            |         |
| Compute     | Compute - Disk maintenance RAID Health ******************* | PASSED  |
|             |                                                            |         |
| Compute     | Compute - Disk maintenance VD Health ********************* | PASSED  |
|             |                                                            |         |
| CephMon     | CephMon - Check cephmon is running *********************** | PASSED  |
|             |                                                            |         |
| CephMon     | CephMon - CEPH cluster check ***************************** | PASSED  |
|             |                                                            |         |
| CephMon     | CephMon - Check Ceph Mon status ************************** | PASSED  |
|             |                                                            |         |
| CephMon     | CephMon - Check Ceph Mon results ************************* | PASSED  |
|             |                                                            |         |
| CephOSD     | CephOSD - Ping All Storage Nodes ************************* | PASSED  |
|             |                                                            |         |
| CephOSD     | CephOSD - Check OSD result with osdinfo ****************** | PASSED  |
|             |                                                            |         |
| CephOSD     | CephOSD - Check OSD result without osdinfo *************** | PASSED  |
|             |                                                            |         |
+-------------+------------------------------------------------------------+---------+
[PASSED] Cloud Sanity All Checks Passed
The cloud-sanity tests use the disk-maintenance and osd-maintenance tools to assess overall health and status of RAID disks and OSD status.
|
Service Catalog URL
The OpenStack Keystone service catalog allows API clients to dynamically discover and navigate to cloud services. Cloudpulse has its own service URL which is added to the keystone service catalog. Send a token request to Keystone to find the service URL of cloudpulse . The token request will list all the catalog of services available.
- Get Token from Keystone
- Get Service Catalog URL for Cloudpulse
- List of Cloudpulse Tests
- Get detailed result of 1 test
- Get List of Tests Available
- Schedule a manual cloudpulse test:
- Remove the results of a test
Get Token from Keystone
To get the token from keystone we have to use the following request:
Resource URI
|
Verb |
URI |
|---|---|
|
POST |
http://<controller_lb_ip>:5000/v2.0/tokens |
Example
JSON Request
POST / v2.0/tokens
Accept: application/json
{
    "auth": {
        "passwordCredentials":{
                  "username": "admin",
                  "password": "iVP1YciVKoMGId1O"
        }
    }
}

JSON Response
200 OK
Content-Type: application/json
{
  "access": {
    "token": {
      "issued_at": "2017-03-29T09:54:01.000000Z",
      "expires": "2017-03-29T10:54:01Z",
      "id": "gAAAAABY24Q5TDIqizuGmhOXakV2rIzSvSPQpMAmC7SA2UzUXZQXSH-ME98d3Fp4Fsj16G561a420B4BK0fylcykL22EcO9",
…………
……..
}
Get Service Catalog URL for Cloudpulse
Resource URI
|
Verb |
URI |
|---|---|
|
GET |
http://<controller_ip>:35357/v2.0/endpoints |
Example
JSON Request
GET /v2.0/endpoints
Accept: application/json

JSON Response
200 OK
Content-Type: application/json
{"endpoints": [
     {"internalurl": "http://<controller>:9999",
      "adminurl": "http://<controller>:9999",
      "publicurl":"http://<controller>:9999"
}]}
}
Cloudpulse API's
The following are a list of API's and the corresponding functions that the API performs. The cloudpulse API's should always be accessed with the X-Auth-Token which contains the token which is received from the keystone token generation API mentioned i the preceding section.
List of Cloudpulse Tests
To get the list of cloudpulse tests:
Resource URI
|
Verb |
URI |
|---|---|
|
GET |
http://<controller_ip>:9999/cpulse |
Example
JSON Request
GET /cpulse
Accept: application/json

JSON Response
200 OK
Content-Type: application/json
{
  "cpulses": [
    {
      "name": "galera_check",
      "state": "success",
      "result":"ActiveNodes:16.0.0.37,16.0.0.17,16.0.0.27",
      "testtype": "periodic",
      "id": 4122,
      "uuid": "a1b52d0a-ca72-448a-8cc0-5bf210438d89"
    }]
}
Get detailed result of 1 test
To get detailed result of the test.
Resource URI
|
Verb |
URI |
|---|---|
|
GET |
http://<controller_ip>:9999/cpulse/<uuid> |
Uuid : uuid of the test
Example
JSON Request
GET /cpulse/e6d4de91-8311-4343-973b-c507d8806e94
Accept: application/json

JSON Response
200 OK
Content-Type: application/json
{
      "name": "galera_check",
      "state": "success",
      "result":"ActiveNodes:16.0.0.37,16.0.0.17,16.0.0.27",
      "testtype": "periodic",
      "id": 4122,
      "uuid": " e6d4de91-8311-4343-973b-c507d8806e94"
}
Get List of Tests Available
To get a list of available cloudpulse tests:
Resource URI
|
Verb |
URI |
|---|---|
|
GET |
http://<controller_ip>:9999/cpulse/list_tests |
Example
JSON Request
GET /cpulse/list_tests
Accept: application/json

JSON Response
200 OK
Content-Type: application/json
{
  "endpoint_scenario": "all_endpoint_tests\ncinder_endpoint\nglance_endpoint\nkeystone_endpoint\nneutron_endpoint\nnova_endpoint",
  "operator_scenario": "all_operator_tests\nceph_check\ndocker_check\ngalera_check\nnode_check\nrabbitmq_check"
}
Schedule a manual cloudpulse test:
To schedule a manual test of cloudpulse
Resource URI
|
Verb |
URI |
|---|---|
|
POST |
http://<controller_ip>:9999/cpulse |
Example
JSON Request
POST /cpulse
Accept: application/json
{
"name": "galera_check"
}

JSON Response
200 OK
Content-Type: application/json
{
      "name": "galera_check",
      "state": "scheduled",
      "result":"NotYetRun",
      "testtype": "manual",
      "id": 4122,
      "uuid": " e6d4de91-8311-4343-973b-c507d8806e94"
}
Remove the results of a test
To remove the results of a test.
Resource URI
|
Verb |
URI |
|---|---|
|
DELETE |
http://<controller_ip>:9999/cpulse/<uuid> |
Uuid : uuid of the test
Example
JSON Request
DELETE /cpulse/68ffaae3-9274-46fd-b52f-ba2d039c8654
Accept: application/json

JSON Response
204 No Content
Checking Network Connections
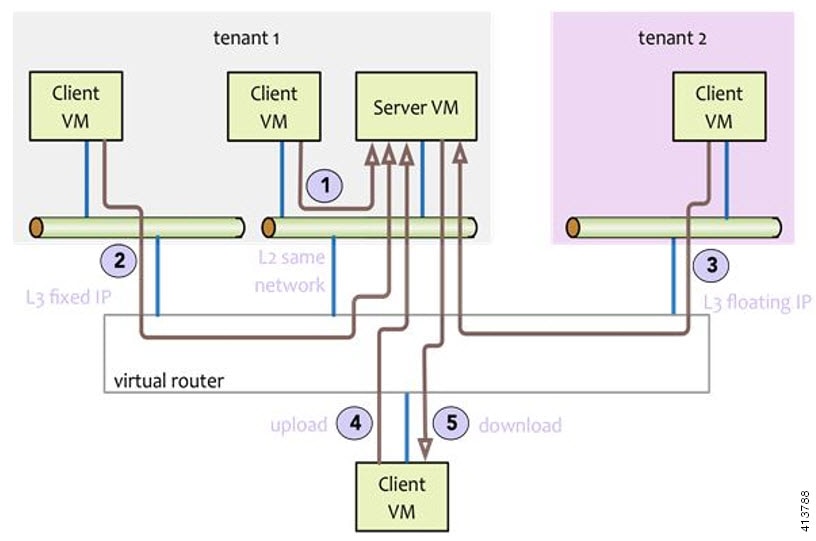
You can use Virtual Machine Through Put (VMTP) to check Layer 2 and Layer 3 data plane traffic between Cisco NFVI compute nodes. VMTP performs ping connectivity, round trip time measurement (latency), and TCP/UDP throughput measurement for the following Cisco NFVI east to west VM-to-VM flows:
-
Same network (private fixed IP, flow number 1).
-
Different network using fixed IP (same as intra-tenant L3 fixed IP, flow number 2).
-
Different network using floating IP and NAT (same as floating IP inter-tenant L3, flow number 3.)
-
When an external Linux host is available for testing north to south flows, external host to VM download and upload throughput and latency (L3/floating IP, flow numbers 4 and 5).
The following figure shows the traffic flows VMTP measures. Cloud traffic flows are checked during Cisco VIM installation and can be checked at any later time by entering the following command:
$ ciscovim run --perform 8 –y
Enabling NFVBench Post Deployment
NFVBench is a data plane performance benchmark tool for NFVI that can be optionally installed after the pod deployment.
NFVBench is used to:
-
Verify that the data plane is working properly and efficiently when using well defined packet paths that are typical of NFV service chains.
-
Measure the actual performance of your data plane so that you can estimate what VNFs can expect from the infrastructure when it comes to receiving and sending packets.
While VMTP only measures VM to VM traffic, NFVBench measures traffic flowing from an integrated software traffic generator (TRex) running on the management node to the ToR switches to test VMs running in compute nodes.
In Cisco VIM, the NFVBench (performance benchmark) is an optional tool. You can deploy NFVBench after the installation of the pod.
-
A 10GE Intel NIC (Intel X710 NIC (4 x 10G)) must be installed on a management node.
-
A TRex traffic generator which uses DPDK interface to interact with Intel NIC and makes use of hardware, instead of software to generate packets. This approach is more scalable and enables NFVBench to perform tests without software limitations.
-
Wire two physical interfaces of the Intel NIC to the TOR switches (as shown in the following figure).
Figure 2. NFVBench topology setup 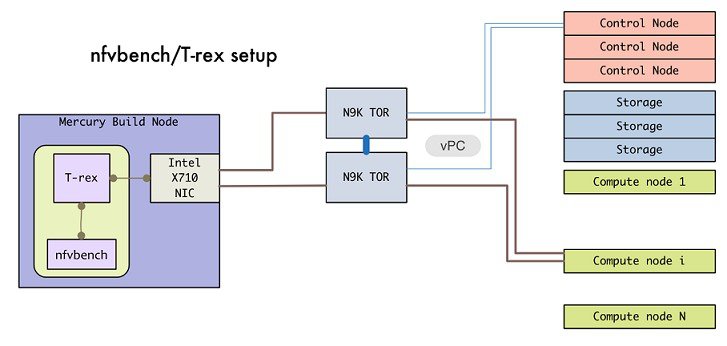
| Command or Action | Purpose | |
|---|---|---|
| Step 1 | Enable the NFVBench configuration in the setup_data.yaml file. |
Sample configuration files for OVS/VLAN or VPP mechanism driver: NFVBENCH:
enabled: True # True or False
tor_info: {TORa: eth1/42, TORb: eth1/42} # mandatory
# tor_info: {TOR: 'eth1/42,eth1/43'} # use if there is only one TOR switch
# nic_ports: 3,4 # Optional input, indicates which 2 of the 4 available ports
# of 10G Intel NIC on the management node is NFVbench tool using
# to send and receive traffic.
# Defaults to the first 2 ports of NIC (ports 1 and 2) if not specified.
# Port number must be between 1 and 4, one port cannot be used twice.
# Example:
# nic_ports: 1,4 # the first and the last port of Intel NIC are used
Sample configuration for VTS mechanism driver: NFVBENCH:
enabled: True # True or False
tor_info: {TORa: eth1/42, TORb: eth1/42} # mandatory
vtep_vlans: 1500,1501 # Mandatory and needed only for VTS/VXLAN.
# Specify any pair of unused VLAN ids to be used
# for VLAN to VxLAN encapsulation in TOR switch.
# tor_info: {TOR: 'eth1/42,eth1/43'} # Use if there is only one TOR switch.
# nic_ports: 3,4 # Optional input, indicates which 2 of the 4 available ports
# of 10G Intel NIC on the management node is NFVbench tool using
# to send and receive traffic.
# Defaults to the first 2 ports of NIC (ports 1 and 2) if not specified.
# Port number must be between 1 and 4, one port cannot be used twice.
# Example:
# nic_ports: 1,4 # the first and the last port of Intel NIC are used
VTS_PARAMETERS:
…
VTS_DAY0: '<True|False>’# Required parameter when VTS enabled
VTS_USERNAME: '<vts_username>'# Required parameter when VTS enabled
VTS_PASSWORD: '<vts_password>'# Required parameter when VTS enabled
VTS_NCS_IP: '11.11.11.111'# '<vts_ncs_ip>', mandatory when VTS enabled
VTC_SSH_USERNAME: 'admin'# '<vtc_ssh_username>', mandatory for NFVbench
VTC_SSH_PASSWORD: 'my_password'# '<vtc_ssh_password>', mandatory for NFVbench
|
| Step 2 | Configuring minimal settings of NFVBench: |
# Minimal settings required for NFVbench
TORSWITCHINFO:
   CONFIGURE_TORS: <True or False>	# True if switches should be configured to support NFVbench
   …
   SWITCHDETAILS:
   - hostname: 'TORa'			# Hostname matching 'tor_info' switch name.
     username: 'admin'			# Login username for switch user.
     password: 'my_password'  # Login password for switch user.
     ssh_ip: '172.31.230.123' # SSH IP for switch.
   - hostname: 'TORb'
     username: 'admin'
     password: 'my_password'
     ssh_ip: '172.31.230.124'
TOR switches will be configured based on information provided in tor_info. Two ports specified by interfaces are configured in trunk mode. In order to access them and retrieve TX/RX counters you need the Login details for TOR switches. It is not required to set 'CONFIGURE_TORS' to 'True', but then manual configuration is necessary. With VTS as mechanism driver additional settings are needed. NFVBench needs access to VTS NCS to perform cleanup after it detaches the traffic generator port from VTS. Also a pair of VTEP VLANs is required for VLAN to VxLAN mapping. Value can be any pair of unused VLAN ID. |
| Step 3 | Reconfigure Cisco VIM to create a NFVBench container. To reconfigure add necessary configuration to the setup_data.yaml file, run the reconfigure command as follows. |
[root@mgmt1 ~]# cd /root/
[root@mgmt1 ~]# mkdir MyDir
[root@mgmt1 ~]# cp /root/openstack-configs/setup_data.yaml /root/MyDir/
[root@mgmt1 ~]# cd /root/
[root@mgmt1 ~]# # update the setup_data to include NFVBENCH section
[root@mgmt1 ~]# cd /root/MyDir/
[root@mgmt1 ~]# vi setup_data.yaml
[root@mgmt1 ~]# cd ~/installer-xxxx
[root@mgmt1 ~]# ciscovim --setupfile /root/MyDir/setup_data.yaml reconfigure
After reconfiguration is done, you can see NFVBench container up and is ready to use. |
NFVBench Usage
Built-in packet paths
NFVBench can setup and stage three different packet paths.
The default packet path is called PVP (Physical - VM - Physical) and represents a typical service chain made of 1 VNF/VM:
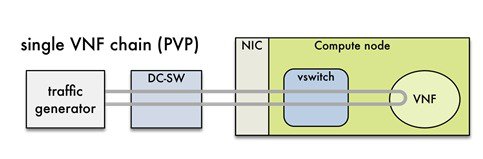
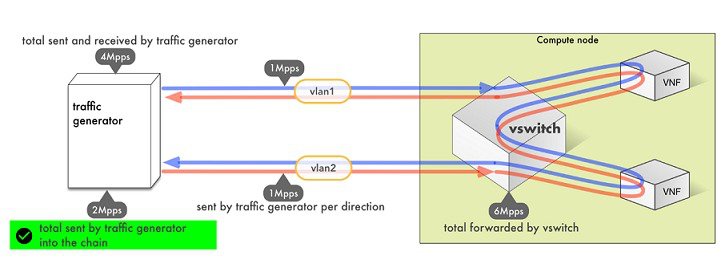
The traffic generator runs inside the NFVBench container on the management node. DC-SW represents the top of rack switch(es). The VNF is a test VM that contains a fast L3 router based on FD.io VPP. This VNF image can also be configured to run an L2 forwarder based on DPDK testpmd (both options generally yield roughly similar throughput results).
Traffic is made of UDP packets generated on the 2 physical interfaces (making it a bi-directional traffic). Packets are forwarded by the switch to the appropriate compute node before arriving to the virtual switch, then to the VNF before looping back to the traffic generator on the other interface. Proper stitching of the traffic on the switch is performed by NFVbench by using the appropriate mechanism (VLAN tagging for VLAN based deployments, VxLAN VTEP in the case of VTS deployments).
The performance of the PVP packet path provides a very good indication of the capabilities and efficiency of the NFVi data plane in the case of a single service chain made of 1 VNF/VM.
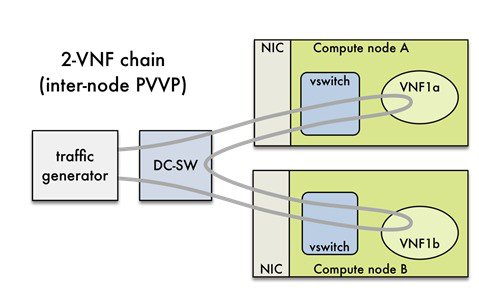
NFVBench also supports more complex service chains made of 2 VM in sequence and called PVVP (Physical-VM-VM-Physical).
In a PVVP packet path, the 2 VMs can reside on the same compute node (PVVP intra-node) or on different compute nodes (PVVP inter-node).
PVVP intra-node is more efficient when a virtual switch is used as packets do not have to go through the switch between the 2 VMs:
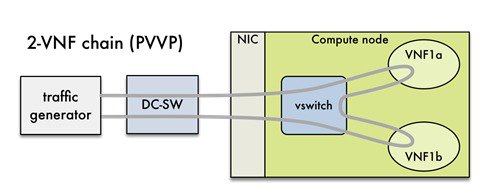
PVVP inter-node requires packets to go through the switch and back between the 2 VMs.
NFVBench Command Line Options
The common NFVBench command line options can be displayed using the --help option:
[root@mgmt1 ~]# nfvbench --help
Control Plane Verification
If you are trying NFVBench for the first time, verify that the tool can stage the default packet path properly without sending any traffic.
The --no-traffic option will exercise the control plane by creating a single test service chain with one VM but does not send any traffic.
The following command will only stage the default PVP packet path (but will not generate any traffic):
[root@mgmt1 ~]# nfvbench --no-traffic
Fixed Rate Run Test
The data plane traffic test is to generate traffic at a fixed rate for a fixed duration. For example, to generate a total of 10,000 packets per second (which is 5,000 packets per second per direction) for the default duration (60 seconds) and using the default frame size of 64 bytes::
[root@mgmt1 ~]# nfvbench --help
- Packet Sizes
- NDR and PDR Test
- Multi-chain Test
- Multi-flow Test
- External Chain Test
- NFVBench Result Generation and Storage
- Interpretation of Results
Packet Sizes
You can specify any list of frame sizes using the -frame-size option (pass as many as desired), including IMIX.
Following is an example, to run a fixed rate with IMIX and 1518 byte frames:
[root@mgmt1 ~]# nfvbench --rate 10kpps –frame-size IMIX –frame-size 1518
NDR and PDR Test
NDR and PDR test is used to determine the performance of the data plane in terms of throughput at given drop rate.
-
No Drop Rate(NDR)-- It is the highest throughput achieved while allowing zero packet drop. (allows a very low drop rate usually lesser than 0.001%).
-
Partial Drop Rate (PDR)--It is the highest throughput achieved while allowing most at a given drop rate (typically less than 0.1%).
NDR is always less or equal to PDR.
To calculate the NDR and PDR for your pod run the following command:
[root@mgmt1 ~]# nfvbench --rate ndr_pdr
Multi-chain Test
In multi-chain test, each chain represents an independent packet path symbolizing real VNF chain. You can run multiple concurrent chains and better simulate network conditions in real production environment. Results with single chain versus with multiple chains usually vary because of services competing for resources (RAM, CPU, and network).
To stage and measure multiple service chains at the same time, use --service-chain-count flag or shorter -scc version.
The following example shows how to run the fixed rate run test with ten PVP chains:
[root@mgmt1 ~]# nfvbench -scc 10 --rate 100kpps
The following example shows how to run the NDR/PDR test with ten PVP chains:
[root@mgmt1 ~]# nfvbench -scc 10 --rate ndr_pdr
Multi-flow Test
One flow is defined by a source and destination MAC/IP/port tuple in the generated packets. It is possible to have many flows per chain. The maximum number of flows supported is in the order of 1 million flows per direction.
The following command will run three chains with a total of 100K flows per direction (for all chains):
[root@mgmt1 ~]# nfvbench -scc 3 -fc 100k
External Chain Test
NFVBench measures the performance of chains that are pre-staged (using any means external to NFVBench). Such chains can be real VNFs with L3 routing capabilities or L2 forwarding chains.
This test is used when user wants to use NFVBench for only traffic generation. In this case, NFVBench sends traffic from traffic generator and reports results without performing any configuration.
You must do necessary configurations such as creating networks and VMs with configuration that allows generated traffic to pass. NFVBench needs to know the 2 edge networks to which the traffic generator will be attached.
If the external chains only support L2 forwarding, the NFVBench configuration must:
-
Enable VLAN tagging and define the VLAN IDs to use - if applicable (or disable vlan tagging if it is not needed).
-
The destination MAC to use in each direction (this will depend on the L2 forwarding mode in place in the service chain).
If the external chains support IPv4 routing, the NFVBench configuration must:
-
Define the public IP addresses of the service chain end points (gateway IP) that will be used to discover destination MAC using ARP.
-
Set the vlan tagging appropriately.
To measure performance for external chains, use the --service-chain EXT (or -sc EXT) option:
[root@mgmt1 ~]# nfvbench -sc EXT
Note | NFVBench will not access ToR switches or v-switch in compute node. |
NFVBench Result Generation and Storage
NFVBench detailed results can be stored in JSON format if passed the --json option with a destination file name or the --std-json option with a destination folder pathname (if you want to use a standard file name generated by NFVBench). It is also possible to use both methods to generate the output in to two different files at the same time:
[root@mgmt1 ~]# nfvbench -scc 3 -fc 10 -fs 64 --json /tmp/nfvbench/my.json --std-json /tmp/nfvbench
The above command will create two JSON files in /tmp/nfvbench container directory, which is mapped to the host directory. The first file will be named my.json.
With the--std-jsonoption, the standard NFVBench filename format follows this pattern:
<service-chain-type>-<service-chain-count>-<flow-count>-<frame-sizes>.json
Default chain is PVP and flag -fs was used to override traffic profile in configuration file. With 3 chains and 10 flows specified, file PVP-3-10-64.json was created
Interpretation of Results
NFVBench prints data to command line in a table form. The data includes the current configuration, test devices details, and results computed based on traffic statistics.
Fixed Rate
Run the following command on NFVBench to view the traffic generated at fixed rate at different components of the packet path:
[root@mgmt1 ~]# nfvbench --rate 5kpps -fs IMIX
NFVBench summary consists of multiple blocks. In some cases, NFVBench displays lesser data. For example, in the output, the EXT chain does not access some path components (like switch). Therefore, the summary does not display
========== NFVBench Summary ==========
Date: 2017-03-28 19:59:53
NFVBench version 0.3.5
Openstack Neutron:
  vSwitch: VTS
  Encapsulation: VxLAN
Benchmarks:
> Networks:
  > Components:
    > TOR:
        Type: N9K
        Version:
          10.28.108.249:
            BIOS: 07.34
            NXOS: 7.0(3)I2(2b)
          10.28.108.248:
            BIOS: 07.34
            NXOS: 7.0(3)I2(2b)
    > VTC:
        Version:
          build_date: 2017-03-03-05-41
          build_number: 14
          git_revision: 0983910
          vts_version: 2.3.0.40
          git_branch: vts231newton
          job_name: vts231newton_gerrit_nightly
    > Traffic Generator:
        Profile: trex-local
        Tool: TRex≠
        Version:
          build_date: Feb 16 2017
          version: v2.18
          built_by: hhaim
          build_time: 18:59:02
  > Service chain:
    > PVP:
      > Traffic:
          VPP version:
            sjc04-pod3-compute-4: v17.04-rc0~98-g8bf68e8
          Profile: custom_traffic_profile
          Bidirectional: True
          Flow count: 1
          Service chains count: 1
          Compute nodes: [u'nova:sjc04-pod3-compute-4']

            Run Summary:

              +-----------------+-------------+----------------------+----------------------+----------------------+
              |  L2 Frame Size  |  Drop Rate  |   Avg Latency (usec) |   Min Latency (usec) |   Max Latency (usec) |
              +=================+=============+======================+======================+======================+
              |      IMIX       |   0.0000%   |                16.50 |                10.00 |               241.00 |
              +-----------------+-------------+----------------------+----------------------+----------------------+

            L2 frame size: IMIX
            Chain analysis duration: 73 seconds

            Run Config:

              +-------------+------------------+--------------+-----------+
              |  Direction  |   Duration (sec) |     Rate     |   Rate    |
              +=============+==================+==============+===========+
              |   Forward   |               60 | 7.6367 Mbps  | 2,500 pps |
              +-------------+------------------+--------------+-----------+
              |   Reverse   |               60 | 7.6367 Mbps  | 2,500 pps |
              +-------------+------------------+--------------+-----------+
              |    Total    |               60 | 15.2733 Mbps | 5,000 pps |
              +-------------+------------------+--------------+-----------+

            Chain Analysis:

              +----------------------+----------+-----------------+---------------+---------------+-----------------+---------------+---------------+
              |      Interface       |  Device  |  Packets (fwd)  |  Drops (fwd)  |  Drop% (fwd)  |  Packets (rev)  |  Drops (rev)  |  Drop% (rev)  |
              +======================+==========+=================+===============+===============+=================+===============+===============+
              |  traffic-generator   |   trex   |     150,042     |               |               |     150,042     |       0       |    0.0000%    |
              +----------------------+----------+-----------------+---------------+---------------+-----------------+---------------+---------------+
              |       vni-5098       |   n9k    |     150,042     |       0       |    0.0000%    |     150,042     |       0       |    0.0000%    |
              +----------------------+----------+-----------------+---------------+---------------+-----------------+---------------+---------------+
              |    vxlan_tunnel0     |   vpp    |     150,042     |       0       |    0.0000%    |     150,042     |       0       |    0.0000%    |
              +----------------------+----------+-----------------+---------------+---------------+-----------------+---------------+---------------+
              | VirtualEthernet0/0/1 |   vpp    |     150,042     |       0       |    0.0000%    |     150,042     |       0       |    0.0000%    |
              +----------------------+----------+-----------------+---------------+---------------+-----------------+---------------+---------------+
              | VirtualEthernet0/0/0 |   vpp    |     150,042     |       0       |    0.0000%    |     150,042     |       0       |    0.0000%    |
              +----------------------+----------+-----------------+---------------+---------------+-----------------+---------------+---------------+
              |    vxlan_tunnel1     |   vpp    |     150,042     |       0       |    0.0000%    |     150,042     |       0       |    0.0000%    |
              +----------------------+----------+-----------------+---------------+---------------+-----------------+---------------+---------------+
              |       vni-5099       |   n9k    |     150,042     |       0       |    0.0000%    |     150,042     |       0       |    0.0000%    |
              +----------------------+----------+-----------------+---------------+---------------+-----------------+---------------+---------------+
              |  traffic-generator   |   trex   |     150,042     |       0       |    0.0000%    |     150,042     |               |               |
              +----------------------+----------+-----------------+---------------+---------------+-----------------+---------------+---------------+

Run as:
nfvbench -c /tmp/nfvbench/nfvbench.cfg --rate 5kpps -fs IMIX
Summary Interpretation:
Lines 1-34: General information about host system and used components.
Lines 35-45: Test-specific information about service chain, traffic profile, and compute nodes.
Lines 46-53: Summary of traffic profile run with results. A new row is added in the table for every packet size in test. The output displays the run summary for the IMIX packet size, but lines for 64B and 1518B can also be present as well. Table contains following columns:
The run summary table includes the following columns:
- Drop Rate: The percentage of total drop rate for all chains and flows from the total traffic sent.
- Avg Latency: Average latency of average chain latencies in microseconds.
- Min Latency: Minimum latency of all chain latencies in microseconds.
- Max Latency: Maximum latency of all chain latencies in microseconds.
Lines 54-68: Length of test in seconds for given packet size and table displaying rate and duration which was used for running traffic in the test.
Lines 69-89: Detailed analysis of test. Each row represents one interface on packet path in order they are visited. Left side of the table is for forward direction (from traffic generator port 0 to port 1), right side is for reverse direction (from traffic generator port 1 to port 0).
The chain analysis table has following columns:
- Interface: Interface name on devices in packet path.
- Device: Device name on which the interface is displayed in the first column is available.
- Packets (fwd): RX counter on given interface, only the first row is TX counter (it is the beginning of packet path).
- Drops (fwd): Amount of packets being dropped between current and previous interface.
- Drop% (fwd): Percentage of dropped packets on this interface to the total packet drops.
- Packets (rev): Similar as Packets (fwd) but for reverse direction.
- Drops (rev): Similar as Drops (fwd) but for reverse direction.
- Drop% (rev): Similar as Drop% (fwd) but for reverse direction.
This type of summary is very useful for finding bottlenecks or to verify if the system can handle certain fixed rate of traffic.
NDR/PDR
The test result shows throughput values in different units for both NDR and PDR with latency statistics (minimum, maximum, average) for each test.
[root@mgmt1 ~]# nfvbench --rate ndr_pdr -fs IMIX
========== NFVBench Summary ==========
Date: 2017-03-28 20:20:46
NFVBench version 0.3.5
Openstack Neutron:
  vSwitch: VTS
  Encapsulation: VxLAN
Benchmarks:
> Networks:
  > Components:
    > TOR:
        Type: N9K
        Version:
          10.28.108.249:
            BIOS: 07.34
            NXOS: 7.0(3)I2(2b)
          10.28.108.248:
            BIOS: 07.34
            NXOS: 7.0(3)I2(2b)
    > VTC:
        Version:
          build_date: 2017-03-03-05-41
          build_number: 14
          git_revision: 0983910
          vts_version: 2.3.0.40
          git_branch: vts231newton
          job_name: vts231newton_gerrit_nightly
    > Traffic Generator:
        Profile: trex-local
        Tool: TRex
        Version:
          build_date: Feb 16 2017
          version: v2.18
          built_by: hhaim
          build_time: 18:59:02
  > Measurement Parameters:
      NDR: 0.001
      PDR: 0.1
  > Service chain:
    > PVP:
      > Traffic:
          VPP version:
            sjc04-pod3-compute-4: v17.04-rc0~98-g8bf68e8
          Profile: custom_traffic_profile
          Bidirectional: True
          Flow count: 1
          Service chains count: 1
          Compute nodes: [u'nova:sjc04-pod3-compute-4']
Run Summary:
                        +-----+-----------------+------------------+------------------+-----------------+----------------------+----------------------+----------------------+
              |  -  |  L2 Frame Size  |  Rate (fwd+rev)  |  Rate (fwd+rev)  |  Avg Drop Rate  |   Avg Latency (usec) |   Min Latency (usec) |   Max Latency (usec) |
              +=====+=================+==================+==================+=================+======================+======================+======================+
              | NDR |      IMIX       |   4.5703 Gbps    |  1,496,173 pps   |     0.0006%     |               131.33 |                10.00 |               404.00 |
              +-----+-----------------+------------------+------------------+-----------------+----------------------+----------------------+----------------------+
              | PDR |      IMIX       |   4.7168 Gbps    |  1,544,128 pps   |     0.0553%     |               205.72 |                20.00 |               733.00 |
              +-----+-----------------+------------------+------------------+-----------------+----------------------+----------------------+----------------------+
                        L2 frame size: IMIX
            Chain analysis duration: 961 seconds
            NDR search duration: 661 seconds
            PDR search duration: 300 seconds
                        Run Config:
                          +-------------+------------------+-------------+---------------+
              |  Direction  |   Duration (sec) |    Rate     |     Rate      |
              +=============+==================+=============+===============+
              |   Forward   |               60 | 2.3584 Gbps |  772,064 pps  |
              +-------------+------------------+-------------+---------------+
              |   Reverse   |               60 | 2.3584 Gbps |  772,064 pps  |
              +-------------+------------------+-------------+---------------+
              |    Total    |               60 | 4.7168 Gbps | 1,544,128 pps |
              +-------------+------------------+-------------+---------------+
Lines 1-48: Similar to the fixed rate run output explained above.
Lines 49-58: Summary of test run with benchmark data. For each packet size, there is a row with NDR/PDR or both values depending on chosen rate. The output displays the run summary for the IMIX packet size.
The table includes the following columns:
- L2 Frame Size: Packet size used in test, can be one of 64B, IMIX, 1518B
- Rate (fwd+rev): Total rate satisfying NDR/PDR condition in a unit bps/pps
- Avg Drop Rate: Average drop rate of test iteration which satisfied NDR/PDR condition
- Avg Latency: Average packet latency of test iteration which satisfied NDR/PDR condition in microseconds
- Min Latency: Minimum latency of test iteration which satisfied NDR/PDR condition in microseconds
- Max Latency: Maximum latency of test iteration which satisfied NDR/PDR condition in microseconds
The NDR and PDR values along with the latency information are good indicators of NFVI solution.
The following figure explains different approaches to interpret the same results.
NFVBench always reports measured rate from the traffic generator perspective as total amount sent into the chain.
Advanced Configuration
More advanced use-cases require customization of the NFVbench configuration file. Steps below are optional.
The default NFVbench configuration file can be obtained by using the -show-default-config option.
For example, go to the host directory mapped to container (/root/nfvbench) and copy default NFVbench configuration file as follows:
[root@mgmt1 ~]# cd /root/nfvbench
[root@mgmt1 ~]# nfvbench –-show-default-config > nfvbench.cfg
You can then edit the nfvbench.cfg using any Linux text editor (read and follow nested comments to do custom configuration) and pass the new configuration file to NFVBench using the -c option.
Cisco VIM CLI
An alternative way to NFVBench CLI is to use ciscovimclient. Ciscovimclient is meant to provide an interface that is more consistent with the CiscoVIM CLI and can run remotely while the NFVBench CLI is executed on the management node.
Pass JSON configuration matching structure of the NFVBench config file to start a test:
[root@mgmt1 ~]# ciscovim nfvbench --config ‘{“rate”: “10kpps”}
+------------------+--------------------------------------+
| Name             | Value                                |
+------------------+--------------------------------------+
| status           | not_run                              |
| nfvbench_request | {"rate": "5kpps"}                    |
| uuid             | 0f131259-d20f-420f-840d-363bdcc26eb9 |
| created_at       | 2017-06-26T18:15:24.228637           |
+------------------+--------------------------------------+
Run the following command with the returned UUID to poll status:
[root@mgmt1 ~]# ciscovim nfvbench --stat  0f131259-d20f-420f-840d-363bdcc26eb9
+------------------+--------------------------------------+
| Name             | Value                                |
+------------------+--------------------------------------+
| status           | nfvbench_running                     |
| nfvbench_request | {"rate": "5kpps"}                    |
| uuid             | 0f131259-d20f-420f-840d-363bdcc26eb9 |
| created_at       | 2017-06-26T18:15:24.228637           |
| updated_at       | 2017-06-26T18:15:32.385080           |
+------------------+--------------------------------------+

+------------------+--------------------------------------+
| Name             | Value                                |
+------------------+--------------------------------------+
| status           | nfvbench_completed                   |
| nfvbench_request | {"rate": "5kpps"}                    |
| uuid             | 0f131259-d20f-420f-840d-363bdcc26eb9 |
| created_at       | 2017-06-26T18:15:24.228637           |
| updated_at       | 2017-06-26T18:18:32.045616           |
+------------------+--------------------------------------+
Once the test is done, retrieve results in a JSON format:
[root@mgmt1 ~]# ciscovim nfvbench --json 0f131259-d20f-420f-840d-363bdcc26eb9
{"status": "PROCESSED", "message": {"date": "2017-06-26 11:15:37", …}}
NFVBench REST Interface
When enabled, the NFVBench container can also take benchmark request from a local REST interface. Access is only local to the management node in the current Cisco VIM version (that is the REST client must run on the management node).
Details on the REST interface calls can be found in Chapter 2, Cisco VIM REST API Resources.
Enabling or Disabling Autobackup of Management Node
Cisco VIM 2.2 introduces the backup and recovery of the management node. By default, the feature is enabled. Auto-snapshots of the management node happens during pod management operation. You can disable the autobackup of the management node.
To enable or disable the management node, update the setup_data.yaml file as follows:
# AutoBackup Configuration
# Default is True
#autobackup: <True or False>
Take a backup of setupdata file and update it manually with the configuration details by running the following command:
[root@mgmt1 ~]# cd /root/
[root@mgmt1 ~]# mkdir MyDir
[root@mgmt1 ~]# cp /root/openstack-configs/setup_data.yaml /root/MyDir/
[root@mgmt1 ~]# # update the setup_data to change autobackup
[root@mgmt1 ~]# cd /root/MyDir/
[root@mgmt1 ~]# vi setup_data.yaml
[root@mgmt1 ~]# cd ~/installer-xxxx
[root@mgmt1 ~]# ciscovim --setupfile /root/MyDir/setup_data.yaml reconfigure
Forwarding ELK logs to External Syslog Server
Cisco VIM, supports backup and recovery of the management node. To keep the process predictable and to avoid loss of logs, the software supports the capability of forwarding the ELK logs to an external syslog server. Capability has been introduced to enable this feature after the pod is up and running, with Cisco VIM, through the reconfigure option.
The Syslog Export reconfigure option supports the following options:
-
Enable forwarding of ELK logs to External Syslog Server on a pod that is already up and running.
-
Reconfigure existing External Syslog Setting to point to a different syslog cluster.
The following section needs to be configured in the setup_data.yaml file.
###################################
## SYSLOG EXPORT SETTINGS
################################### SYSLOG_EXPORT_SETTINGS:
remote_host: <Syslog_ipv4_or_v6_addr>	# required
protocol  : udp	# defaults to udp
facility  : <string> # required; possible values local[0-7]or user
severity  : <string; suggested value: debug>
port      : <int>; # defaults, port number to 514
clients   : 'ELK'	# defaults and restricted to ELK;
# Please note other than the remote host info, most of the other info is not needed; Also the client list in 2.2 is restricted to ELK only
Take a backup of the setupdata file and update the file manually with the configs listed in the preceding section, then run the reconfigure command as follows:
[root@mgmt1 ~]# cd /root/
[root@mgmt1 ~]# mkdir MyDir
[root@mgmt1 ~]# cp /root/openstack-configs/setup_data.yaml /root/MyDir/
[root@mgmt1 ~]# # update the setup_data to include Syslog Export info
[root@mgmt1 ~]# cd /root/MyDir/
[root@mgmt1 ~]# vi setup_data.yaml
[root@mgmt1 ~]# cd ~/installer-xxxx
[root@mgmt1 ~]# ciscovim --setupfile /root/MyDir/setup_data.yaml reconfigure
With this configuration, you should now be able to use export ELK logs to an external syslog server. On the remote host, verify if the logs are forwarded from the management node.
Adding and Reconfiguring VIM Administrators
Cisco VIM supports management of VIM Administrators. A VIM administrator will have permissions to login to the management node through SSH or the console using the configured password. By configuring to one VIM admin account, administrators do not have to share credentials. Administrators will have individual accountability.
To enabled one or more VIM administrators, post VIM install follow the steps listed below.
| Step 1 | Take a backup
of the setupdata file and update the file manually with the configs listed as,
vim_admins:
- vim_admin_username: <username>
  vim_admin_password_hash: <sha512-password-hash>
- vim_admin_username: <username>
  vim_admin_password_hash: <sha512-password-hash>
- vim_admin_username: <username>
  vim_admin_password_hash: <sha512-password-hash>

The value of password hash must be in the standard sha512 format. # To generate the hash admin_password_hash should be the output from on the management node
#  python -c "import crypt; print crypt.crypt('<plaintext password>')"
|
| Step 2 | Run the
reconfigure commands as follows:
[root@mgmt1 ~]# cd /root/ [root@mgmt1 ~]# mkdir MyDir [root@mgmt1 ~]# cp /root/openstack-configs/setup_data.yaml /root/MyDir/ # update the setup_data to include vim_admin info [root@mgmt1 ~]# cd /root/MyDir/ [root@mgmt1 ~]# vi setup_data.yaml [root@mgmt1 ~]# cd ~/installer-xxxx [root@mgmt1 ~]# ciscovim --setupfile /root/MyDir/setup_data.yaml reconfigure |
Reconfigure of Proxy Post Install
During post install one can update the http/https proxy server information listed in NETWORKING section of the setup_data.yaml.
To update the proxy in the post VIM install follow the steps listed below:
| Step 1 | Take a backup
of the setupdata file and update the file manually with the configs listed as,
http_proxy_server: <a.b.c.d:port> # optional, needed if install is through internet, and the pod is behind a proxy and/or https_proxy_server: <a.b.c.d:port> # optional, needed if install is through internet, and the pod is behind a proxy |
| Step 2 | Run the
reconfigure commands follows:
[root@mgmt1 ~]# cd /root/ [root@mgmt1 ~]# mkdir MyDir [root@mgmt1 ~]# cp /root/openstack-configs/setup_data.yaml /root/MyDir/ # update the setup_data to update the proxy info [root@mgmt1 ~]# cd /root/MyDir/ [root@mgmt1 ~]# vi setup_data.yaml [root@mgmt1 ~]# cd ~/installer-xxxx [root@mgmt1 ~]# ciscovim --setupfile /root/MyDir/setup_data.yaml reconfigure |
Enabling Custom Policy for VNF Manager Post Install
During the post installation of a cloud, Cisco VIM helps to enable a VNF Manager (such as ESC) to operate and manage tenant VMs in the OpenStack cloud, with additional privileged features.
Following are the steps to enable the custom policy for VNF Manager:
| Step 1 | Take a backup
of the setupdata file and update the file manually with the configs listed as,
ENABLE_ESC_PROV: True |
| Step 2 | Run the
reconfigure commands follows:
[root@mgmt1 ~]# cd /root/ [root@mgmt1 ~]# mkdir MyDir [root@mgmt1 ~]# cp /root/openstack-configs/setup_data.yaml /root/MyDir/ # update the setup_data to update the proxy info [root@mgmt1 ~]# cd /root/MyDir/ [root@mgmt1 ~]# vi setup_data.yaml [root@mgmt1 ~]# cd ~/installer-xxxx [root@mgmt1 ~]# ciscovim --setupfile /root/MyDir/setup_data.yaml reconfigure |
Updating Containers in a Running Cisco VIM Cloud
Cisco VIM allows you to update all OpenStack and infrastructure services such as RabbitMQ, MariaDB, HAProxy, and management node containers such as Cobbler, ELK, VMTP and repo containers with almost no impact to the Cisco NFVI implementation. Updates allows you to integrate Cisco VIM patch releases without redeploying the Cisco NFVI stack from the beginning. Updates have minimal service impact because they run serially component by component one node at a time. If an error occurs during an update, auto-rollback is triggered to return the cloud to its pre-update state. After an update you can check for any functional impacts on the cloud. If everything is fine you can commit the update, which deletes the old containers and old images from the nodes. Should you see any functional cloud impact you can perform a manual rollback to start the old containers again.
Before you begin a container update, keep the following in mind:
-
Updates are not supported for registry-related containers and authorized_keys.
-
You cannot roll back the repo containers on the management node to an older version after they are updated because rollbacks will delete node packages and might cause the cloud to destabilize.
-
To prevent double-faults, a cloud sanity check is performed before the update is started. A cloud sanity check is performed as the last step of the update.
The following table provides an overview to the methods to start the OpenStack update using Cisco VIM. The Internet options refer to management node connectivity to the Internet. If your management server lacks Internet access, you must have a staging server with Internet access to download the Cisco VIM installation artifacts to a USB stick. Cisco recommends selecting one method and staying with it for the full pod lifecycle.
|
Without Cisco VIM Insight |
With Cisco VIM Insight |
|
|---|---|---|
|
Without Internet |
|
|
|
With Internet |
|
|
Updating Cisco VIM Software Using a USB
The following procedure tells you how to load the Cisco VIM installation files onto a Cisco NFVI management node that does not have Internet access. Installation files include: buildnode-K9.iso, mercury-installer.tar.gz, nova-libvirt.tar, registry-2.3.1.tar.gz, and respective checksums..
This procedure requires a CentOS 7 staging server (VM, laptop, or UCS server) with a 64 GB USB 2.0 stick. The staging server must have Internet access (wired access is recommended) to download the Cisco VIM installation files, which you will load onto the USB stick. You then use the USB stick to load the installation files onto the management node. The installation files are around 24 GB in size, downloading them to the USB stick might take several hours, depending on the speed of your Internet connection, so plan accordingly. Before you begin, disable the CentOS sleep mode.
| Step 1 | On the staging server, use yum to install the following packages: | ||
| Step 2 | Connect to the Cisco VIM software download site using a web
browser and login credentials provided by your account representative and
download the
getartifacts.py script from external registry.
# download the new getartifacts.py file (see example below) curl -o getartifacts.py https://<username>:<password>@cvim-registry.com/mercury-releases/mercury-rhel7-osp8/releases/<1.0.1>/getartifacts.py curl -o getartifacts.py-checksum.txt https://<username>:<password>@cvim-registry.com/mercury-releases/mercury-rhel7-osp8/releases/1.0.1/getartifacts.py-checksum.txt # calculate the checksum and verify that with one in getartifacts.py-checksum.txt sha512sum getartifacts.py # Change the permission of getartificats.py chmod +x getartifacts.py | ||
| Step 3 | Run the
getartifacts.py script. The script formats the USB 2.0 stick
and downloads the installation artifacts. You will need to provide the registry
username and password, the tag ID, and the USB partition on the staging server.
For example:
To identify the USB drive, execute the lsblk command before and after inserting the USB stick. (The command displays a list of available block devices.) The output delta will help find the USB drive location. Provide the entire drive path in the –d option, instead of any partition. sudo ./ getartifacts.py -t <tag_id> -u <username> -p <password> -d </dev/sdc>
| ||
| Step 4 | Verify the integrity of the downloaded artifacts and the container
images:
# create a directory sudo mkdir -p /mnt/Cisco # /dev/sdc is the USB drive, same as supplied in get artifacts.py python script sudo mount /dev/sdc1 /mnt/Cisco cd /mnt/Cisco # execute the verification script ./test-usb # failures will be explicitly displayed on screen, sample success output below # sample output of ./test-usb execution with 2.2.x release [root@mgmtnode Cisco]# ./test-usb INFO: Checking the integrity of this USB stick INFO: Checking artifact buildnode-K9.iso INFO: Checking artifact mercury-version.txt INFO: Checking artifact registry-2.3.1.tar.gz INFO: Checking artifact nova-libvirt-K9.tar.gz INFO: Checking required layers: INFO: 395 layer files passed checksum. [root@mgmtnode Cisco]# | ||
| Step 5 | To resolve download artifact failures, unmount the USB and run the
getartifacts command again with the --retry option:
sudo ./getartifacts.py -t <tag_id> -u <username> -p <password> -d </dev/sdc> --retry | ||
| Step 6 | Mount the USB and then run the test-usb command to validate all
the files are downloaded:
# /dev/sdc is the USB drive, same as supplied in get artifacts.py python script sudo mount /dev/sda1 /mnt/Cisco cd /mnt/Cisco # execute the verification script ./test-usb # In case of failures the out of the above command will explicitly display the same on the screen | ||
| Step 7 | After the synchronization finishes, unmount the USB stick:
sudo umount /mnt/Cisco | ||
| Step 8 | After the synchronization finishes, remove the USB stick from the staging server then insert it into the management node. | ||
| Step 9 | Complete the following steps to import the Cisco NFVI installation
artifacts onto the management node:
| ||
| Step 10 | Verify the image version and change ID for the software update.
cat /var/cisco/artifacts/mercury-version.txt | ||
| Step 11 | Execute the update from the old working directory:
cd $old_workspace/installer;
ciscovim update --file /var/cisco/artifacts/mercury-installer.tar.gz
After the update is complete, use the newly created directory from here onwards (unless a rollback is planned). | ||
| Step 12 | Commit the update by running the following command:
ciscovim commit # from the new workspace | ||
| Step 13 | To revert the update changes before entering the commit command,
enter:
ciscovim rollback # and then use older workspace
|
Updating Cisco VIM Software Using Network Installation
| Step 1 | From the download site provided by your Cisco account
representative, download the mercury-installer.gz
curl -o mercury-installer.tar.gz
https://{username}:{password}@cvim-registry.cisco.com/
mercury-releases/mercury-rhel7-osp10/releases/{release number}/
mercury-installer.tar.gz
The link to the tar ball above is an example. | ||
| Step 2 | Execute the update from the old working directory:
cd /root/installer-<tagid>
ciscovim update –file /root/mercury-installer.tar.gz
After the update is complete, use the newly created directory from here onwards (unless a rollback is planned). | ||
| Step 3 | Commit the update by running the following command:
ciscovim commit | ||
| Step 4 | To revert the update changes before entering the commit command,
enter:
ciscovim rollback # and then use older workspace |
Upgrading Containers in a Running Cisco VIM Cloud
Cisco VIM 2.2 allows you to upgrade all OpenStack services, infrastructure services such as RabbitMQ, MariaDB, HAProxy, and management node containers such as Cobbler, ELK, VMTP and repo containers. You can upgrade to new releases of OpenStack without redeploying the Cisco NFVI stack from the beginning. During upgrade, you can expect limited service impact as the upgrade is run serially on component by component (one node at a time).
Cisco VIM 2.2 supports upgrade from a known version of VIM running Liberty (1.0.40) to the current version of Newton (2.2.0). As OpenStack does not support the skipping of major releases during upgrade, the VIM upgrade internally moves the stack to Mitaka and then to Newton release of OpenStack.
As part of the VIM cloud upgrade,
-
The runner.py script is used to automatically upgrade the REST API server managing the VIM orchestrator.
-
The setup_data.yaml is automatically translated so that the setup_data.yaml file is compatible to the target release version.
Before you begin a container update, consider the following points:
- Plan for the downtime as the upgrade involves moving the Kernel version.
- Updates are not supported for registry-related containers and authorized_keys.
- The repo containers on the management node cannot be rolled back to an older version after the upgrade, as the rollbacks will delete the node packages and destabilize the cloud.
- A cloud sanity check is performed before the update is started to prevent double-faults,. A cloud sanity check is performed as the last step of the update.
Before you begin a Pod upgrade, keep the following in mind:
-
There is no roll-back in Upgrades, so it is better to stage it in the lab, and test it few times as issues related to specific customer environment might surface.
-
The upgrade script, vim_upgrade_orchestrator.py, is available as part of the 2.2 artifacts and needs to be copied to /root/ location before starting the execution.
-
For disconnected upgrade, 2 USBs 2.0 (64GB) should be pre-populated with artifacts from 1.5.2 and 2.2.0.
-
Upgrade from 1.0.x to 2.2.x is restricted to specific starting and end point.
-
Upgrade of the cloud is supported in both connected and disconnected mode.
-
In 2.2.x, UCSD is no longer supported, instead the UI has been replaced by VIM Insight; Post Upgrade customer should bring up the Insight service on its own and register the pod to it
-
We recommended you not to change the upgrade mode and the install mode.
-
Upgrade is a one-way operation ( there no rollback); so planning should be done before executing the upgrade. In the off chance, if one faces an issue, reach out to Cisco TAC/BU to recover the cloud.
At a high level, the upgrade script, vim_upgrade_orchestrator.py, is broken into three steps with logic to abort on fail. In case of failure, it is important to call Cisco support and not recover the cloud on your own.
The following are the three high level steps into which the vim_upgrade_orchestrator.py is broken into:
-
Pre-Upgrade Check
-
Registry connectivity (if connected install).
-
Setup_data pre check: No UCSM_PLUGIN, sufficient storage pool size.
-
Backup setup_data.yaml, before performing translation.
-
Check and Update INSTALL_MODE in setup_data.yaml (connected or disconnected);
-
run cloud - sanity from stable/liberty.
-
Check for reachability to all nodes including compute, controller and storage.
-
For a cloud running with VTS; additional steps need to be taken at this point, as VTC is not managed by Cisco VIM.
At a high level listed following are the manual steps:
-
Power down the VTS 2.3 master and slave instances.
-
Keep the VTS 2.3 XRNC/XRVR master and slave instance running.
-
Bring up new VTS 2.5 master and slave instance.
-
Login to master and slave VTS 2.5 UI and change admin password.
-
Enable the VTS High availability with same assigned VIP IP address in VTS 2.3 deployment.
-
Bring up new VTSR 2.5 master and slave instance.
-
Login to VTS HA VIP IP address and execute the Underlay Loopback and OSPF Template.
-
Power down the VTS 2.3 XRNC/XRVR Master and slave instance before performing vtc upgrade only.
After executing the manual steps, excute the vim_upgrade_orchestrator.py with vtcupgradeonly option to have the VIM cloud working with VTS 2.5.
-
Connect to the CIMC of the management node and validate the boot-order list SDCARD as the first choice.
-
Power-cycle the management node to complete the management node upgrade.
-
Manually move the Pod from Software Raid to Hardware Raid.
The following table provides an overview to the methods to start the OpenStack update using Cisco VIM. The Internet options refer to management node connectivity to the Internet. If your management server lacks Internet access, you must have a staging server with Internet access to download the Cisco VIM installation artifacts to a USB stick. We recommend you to select one method and stay with it for the full pod lifecycle.
|
Upgrade Method |
Without Cisco VIM Insight |
|---|---|
|
Without Internet |
|
|
With Internet |
Copy the vim_upgrade_orchestrator.py and follow the upgrade steps in the upgrade without Internet procedure |
Upgrading VIM Software Using a USB
The following procedure tells you how to load the Cisco VIM installation files onto a Cisco NFVI management node that does not have Internet access. Installation files include: build node-K9.iso, mercury-installer.tar.gz, nova-libvirt.tar, registry-2.3.1.tar.gz, and respective checksums..
This procedure requires a CentOS 7 staging server (VM, laptop ,or UCS server) with two 64 GB USB 2.0 stick. The staging server must have Internet access(wired access is recommended) to download the Cisco VIM installation files, which you will load onto the USB stick. You then use the USB stick to load the installation files onto the management node. The installation files are around 24 GB in size, downloading them to the USB stick might take several hours, depending on the speed of your Internet connection, so plan accordingly. Before you begin, disable the CentOS sleep mode.
| Step 1 | On the staging server, use yum to install the following packages: | ||
| Step 2 | Connect to the
Cisco VIM software download site using a web browser and login credentials
provided by your account representative and download the
getartifacts.py script from external registry.
# download the new getartifacts.py file (see example below) curl -o getartifacts.py https://<username>:<password>@cvim-registry.com/mercury-releases/mercury-rhel7-osp9/releases/<1.5.2>/getartifacts.py curl -o getartifacts.py-checksum.txt https://<username>:<password>@cvim-registry.com/mercury-releases/mercury-rhel7-osp9/releases/1.5.2/getartifacts.py-checksum.txt # calculate the checksum and verify that with one in getartifacts.py-checksum.txt sha512sum getartifacts.py # Change the permission of getartificats.py chmod +x getartifacts.py | ||
| Step 3 | Run the
getartifacts.py script. The script formats the USB 2.0 stick
and downloads the installation artifacts. You will need to provide the registry
username and password, the tag ID, and the USB partition on the staging server.
For example:
To identify the USB drive, execute the lsblk command before and after inserting the USB stick. (The command displays a list of available block devices.) The output delta will help find the USB drive location. Provide the entire drive path in the –d option, instead of any partition. sudo ./ getartifacts.py -t <tag_id> -u <username> -p <password> -d </dev/sdc>
| ||
| Step 4 | Verify the
integrity of the downloaded artifacts and the container images:
# create a directory sudo mkdir -p /mnt/Cisco # /dev/sdc is the USB drive, same as supplied in get artifacts.py python script sudo mount /dev/sdc1 /mnt/Cisco cd /mnt/Cisco # execute the verification script ./test-usb # failures will be explicitly displayed on screen, sample success output below # sample output of ./test-usb execution with 2.2.x release [root@mgmtnode Cisco]# ./test-usb INFO: Checking the integrity of this USB stick INFO: Checking artifact buildnode-K9.iso INFO: Checking artifact mercury-version.txt INFO: Checking artifact registry-2.3.1.tar.gz INFO: Checking artifact nova-libvirt-K9.tar.gz INFO: Checking required layers: INFO: 395 layer files passed checksum. [root@mgmtnode Cisco]# | ||
| Step 5 | To resolve
download artifact failures, unmount the USB and run the getartifacts command
again with the --retry option:
sudo ./getartifacts.py -t <tag_id> -u <username> -p <password> -d </dev/sdc> --retry | ||
| Step 6 | Mount the USB
and then run the test-usb command to validate all the files are downloaded:
# /dev/sdc is the USB drive, same as supplied in get artifacts.py python script sudo mount /dev/sda1 /mnt/Cisco cd /mnt/Cisco # execute the verification script ./test-usb # In case of failures the out of the above command will explicitly display the same on the screen | ||
| Step 7 | After the
synchronization finishes, unmount the USB stick:
sudo umount /mnt/Cisco | ||
| Step 8 | After the synchronization finishes, remove the USB stick from the staging server then insert it into the management node. | ||
| Step 9 | Repeat step 2 to step 8 for pre-population of CVIM 2.2.x artifacts onto the 2nd USB | ||
| Step 10 | Insert the 2 pre-populated USBs into the management node of the pod running 1.0.41. | ||
| Step 11 | Copy the vim_upgrade_orchestrator.py script available in CVIM 2.2 artifacts in the /root/ folder of the management node of the pod running 1.0.41 | ||
| Step 12 | Execute the
update from the /root/ location:
# cd /root/
# ./vim_upgrade_orchestrator.py –i disconnected [-y]		# -y if you don’t want any interactive mode

After the upgrade is complete, use the newly created directory from here onwards.
| ||
| Step 13 | Copy the management node back up created during the upgrade, into a separate server via rsync (refer to chapter 12 for details). | ||
| Step 14 | Check that the SDCARD is state as priority 1 for the boot order, from the CIMC of the management node. If not, set it accordingly. Reboot the management node, and wait for it to come all the way up. | ||
| Step 15 | Only if VTS is running on the pod, manually move the VTC to 2.5 | ||
| Step 16 | Execute the
update from the /root/ location:
# cd /root/
# ./vim_upgrade_orchestrator.py –i disconnected -s VTCSSHUSERNAME -p VTCSSHPASSWORD –vtsupgradeonly  [-y]
| ||
| Step 17 | Manually
switch the management node of the pod to Hardware Raid. At a high level
following steps need to be followed on the management node:
| ||
| Step 18 | Move the pod
to Hardware Raid, execute the following:
[root@mgmt1 ~]# cd /root/
[root@mgmt1 ~]# mkdir MyDir
[root@mgmt1 ~]# cd MyDir
[root@mgmt1 ~]# cp /root/openstack-configs/setup_data.yaml <my_setup_data.yaml>

    Update the kickstart line in setup_data in /root/Save/:
		kickstart:
			block_storage: storage-flexflash-c240m4.ks
			compute: compute-flexflash-c220m4.ks
			control: control-flexflash-c220m4.ks
to
 		kickstart:
  			control: ucs-b-and-c-series.ks
  			compute: ucs-b-and-c-series.ks
  			block_storage: ucs-b-and-c-series.ks

 [root@mgmt1 ~]# ciscovim –-setupfile ~/MyDir/<my_setup_data.yaml> run –perform 1
|
Upgrading Cisco VIM Software Using Network Installation
| Step 1 | From the download site provided by your Cisco account representative, download the vim_upgrade_orchestrator.py curl -o vim_upgrade_orchestrator.py https://{username}:{password}@cvim-registry.cisco.com/ mercury-releases/mercury-rhel7-osp10/releases/{release number}/vim_upgrade_orchestrator.py The link to the tar ball above is an example. | ||
| Step 2 | Execute the
upgrade from /root/ directory:
 $ cd /root/
$ ./vim_upgrade_orchestrator.py –i connected
After the upgrades are complete, use the newly created directory from here onwards |
VM Resizing
VM resize is the process of changing the flavor of an existing VM. Thus, using VM resize you can upscale a VM according to your needs. The size of a VM is indicated by the flavor based on which the VM is launched.
Resizing an instance means using a different flavor for the instance.
By default, the resizing process creates the newly sized instance on a new node, if more than one compute node exists and the resources are available. By default, the software, allows you to change the RAM size, VDISK size, or VCPU count of an OpenStack instance using nova resize. Simultaneous or individual adjustment of properties for the target VM is allowed. If there is no suitable flavor for the new properties of the VM, you can create a new one.
nova resize [--poll] <server> <flavor>
The resize process takes some time as the VM boots up with the new specifications. For example, the Deploying a Cisco CSR (size in MB) would take approximately 60mins. After the resize process, execute nova resize-confirm <server> to overwrite the old VM image with the new one. If you face any issue, you revert to the old VM using the nova-resize-revert <server> command. to drop the new VM image and use the old one. At this point, you can access the VM through SSH and check if the right image is configured.
Note | OpenStack will shutdown the VM before the resize, so you have to plan for a downtime. |
Note | We recommend you not to resize a vdisk to a smaller value, as there is the risk of losing data. |
Nova Migrate
The nova migrate command is used to move an instance from one compute host to another compute host. The scheduler chooses the destination compute host based on the availability of the zone settings. This process does not assume that the instance has shared storage available on the target host.
To initiate the cold migration of the VM, you can execute the following command:
nova migrate [--poll] <server>
The VM migration can take a while, as the VM boots up with the new specifications. After the VM migration process, you can execute nova resize-confirm <server> --to overwrite the old VM image with the new one.. If you face any issue, use the nova-resize-revert <server> command to revert to the old VM image. At this point, access the VM through SSH and check the right image is configured.
Note | OpenStack will shutdown the VM before the migrate, so plan for a downtime. |
 Feedback