Telemetry Configuration Guide for Cisco NCS 560 Series Routers, IOS XR Release 7.6.x
Bias-Free Language
The documentation set for this product strives to use bias-free language. For the purposes of this documentation set, bias-free is defined as language that does not imply discrimination based on age, disability, gender, racial identity, ethnic identity, sexual orientation, socioeconomic status, and intersectionality. Exceptions may be present in the documentation due to language that is hardcoded in the user interfaces of the product software, language used based on RFP documentation, or language that is used by a referenced third-party product. Learn more about how Cisco is using Inclusive Language.
Scale-Up Your Network Monitoring Strategy Using Telemetry
Are you monitoring your network using traditional polling methods such as SNMP, Syslog, and CLI? If yes, does the data that
you extract from your network help you answer these questions?
What percentage of the network bandwidth does the network traffic currently consume?
Do all the links in the network run at a hundred percent utilization rate?
If an unmanned router fails, is the network operator notified in real time about the issue and its related consequences?
Is the CPU over- or under-utilized?
Can the efficiency of the network be calculated based on traffic and data loss?
What are the possible performance issues that cause traffic loss or network latency?
How do you proactively prevent issues that may arise? Does the data support the study of network patterns in real time?
These traditional methods use a pull model to request information at regular intervals. The data that you collect may help you to efficiently monitor your network
of a manageable size. However, as your network grows in complexity and scale, the data that you poll may be insufficient for
efficient and effective monitoring. Additionally, the polling methods are resource-intensive, and network operators face information
gaps in the data that they collect. With the pull model, the network device (the server) sends data only when the data collector
(the client) requests it. Initiating such requests requires continual manual intervention. This manual intervention makes
this model unsuitable, and limits automation and the ability to scale. It inhibits the visibility of the network and therefore
provides inefficient control of the network. You need monitoring strategy that adds resiliency and stability to your network.
Telemetry does just that. Telemetry uses a push model that automatically streams data from a network device. Instead of a collector requesting data at periodic intervals,
the network device streams operational data in real time.
Telemetry focuses on the power of scale, speed, and automation. With the power of flexibility, you can select data of interest
from the routers and transmit it in a structured format to remote management stations for monitoring. Using the finer granularity
and higher frequency of data available through telemetry, DevOps (development and operations) engineers in your organization
can quickly locate and investigate issues as soon as they occur. They can, thus, collaborate to monitor and have better control
over the network.
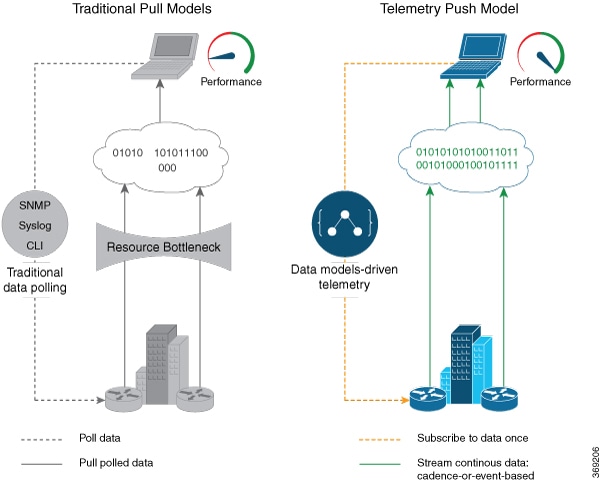
The following image shows the comparative benefits of streaming telemetry data using the telemetry push model over traditional
pull models. The pull models create resource bottlenecks that prevent retrieving valuable operational data from the router.
On the other hand, the push model is designed to remove such bottlenecks and deliver data efficiently.
Figure 1. Comparison Between Traditional Pull Models and Telemetry Push Model
Watch this video to see how telemetry data can unlock the intelligence of data in your network to proactively predict and troubleshoot issues.
Note
Starting from Cisco IOS XR, Release 7.0.1, Telemetry is part of the base image (<platform>-mini-x.iso). In earlier releases,
Telemetry was part of the Manageability package (<platform>-mgbl-3.0.0.0-<release>.x86_64.rpm).
This article describes the benefits of using telemetry data and the various methods to stream meaningful data from your network
device:
Benefits of Shifting Network Monitoring from Pull Models to Telemetry Push Model
Real-time telemetry data is useful in:
Managing network remotely: The primary benefit of telemetry is the ability it offers you as an end user to monitor the state of a network element remotely.
After the network is deployed, you cannot be physically present at the network site to find out what works, and what is cumbersome.
With telemetry, those insights can be analyzed, leveraged, and acted upon from a remote location.
Optimizing traffic: When link utilization and packet drops in a network are monitored at frequent intervals, it is easier to add or remove links,
re-direct traffic, modify policing, and so on. With technologies like fast reroute, the network can switch to a new path and
re-route faster than the traditional SNMP poll interval mechanism. Streaming telemetry data helps in providing quick response
time for faster transport of traffic.
Preventive troubleshooting: Network state indicators, network statistics, and critical infrastructure information are exposed to the application layer,
where they are used to enhance operational performance and to reduce troubleshooting time. The finer granularity and higher
frequency of data available through telemetry enables better performance monitoring and therefore, better troubleshooting.
Visualizing data: Telemetry data acts as a data lake that analytics toolchains and applications use to visualize valuable insights into your
network deployments.
Monitoring and controlling distributed devices: The monitoring function is decoupled from the storage and analysis functions. This decoupling helps to reduce device dependency,
while providing flexibility to transform data using pipelines. These pipelines are utilities that consume telemetry data, transform it, and forward the resulting content to a downstream,
typically off-the-shelf, consumer. The supported downstream consumers include Apache Kafka, Influxdata, Prometheus, and Grafana.
Streaming telemetry, thus, converts the monitoring process into a Big Data proposition that enables the rapid extraction and
analysis of massive data sets to improve decision-making.
Review Mechanisms to Stream Telemetry Data from a Router to a Destination
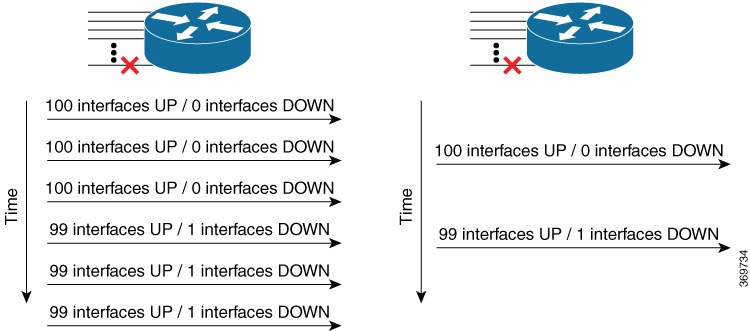
Telemetry data can be streamed using either cadence-driven or event-driven mechanisms.
Figure 2. Cadence-driven and Event-driven Telemetry
Cadence-driven Telemetry
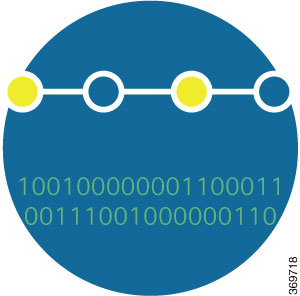
Cadence-driven telemetry continually streams data (operational statistics and state transitions) at a configured cadence.
The higher frequency of the data that is continuously streamed helps you closely identify emerging patterns in the network.
The following image shows a continuous stream of data after a configured time interval:
Figure 3. Cadence-driven Telemetry
Event-driven Telemetry
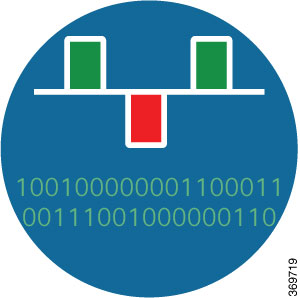
Event-driven telemetry optimizes data that is collected at the receiver and streams data only when a state transition occurs
and thus optimizes data that is collected at the receiver. For example, EDT streams data about interface state transitions,
IP route updates, and so on.
The following image shows a stream of data after a state change:
Figure 4. Event-driven Telemetry
Learn About the Elements that Enable Streaming Telemetry Data
These elements are the building blocks in enabling telemetry in a network.
Sensor Path
Table 1. Feature History Table
Feature Name
Release Information
Description
Stream Digital Optical Monitoring (DOM) Data
Release 7.3.1
This feature streams fiber optic transceiver parameters such as optical input or output levels, temperature, laser bias current,
supply voltage, receiver power, bias threshold in real-time. This helps network operators to easily locate a fiber link failure,
thereby simplifying the maintenance process, and improving overall system reliability.
The sensor path describes a YANG path or a subset of data definitions in a YANG data model within a container. In a YANG model,
the sensor path can be specified to end at any level in the container hierarchy.
A YANG module defines a data model through the data of the router, and the hierarchical organization and constraints on that
data.
YANG defines four node types. Each node has a name. Depending on the node type, the node either defines a value or contains
a set of child nodes. The nodes types for data modeling are:
leaf node - contains a single value of a specific type
leaf-list node - contains a sequence of leaf nodes
list node - contains a sequence of leaf-list entries, each of which is uniquely identified by one or more key leaves
container node - contains a grouping of related nodes that have only child nodes, which can be any of the four node types
To get started with using the data models, see the Programmability Configuration Guide.
The following table shows few examples of sensor paths:
Use specific paths to avoid streaming data that you may not be interested. For example, if you want to stream information
about only the summary of MPLS-TE, use sensor-path Cisco-IOS-XR-mpls-te-oper:mpls-te/autotunnel/mesh/summary instead of sensor-path Cisco-IOS-XR-mpls-te-oper:mpls-te sensor path.
The router streams telemetry data at predefined gather points in the data model even if sensor-path configuration is to an
individual leaf. The gather points are collection units; collection always happens at that level for operational data.
Starting from release 7.2.1, the router supports the following sensor-path resolutions:
Streaming data at the leaf-level or at the container-level under a gather point for cadence-based subscriptions.
If a subscritpion has multiple sensor-paths that resolve to the same gather point and have the same cadence and encoding,
data is pushed in a single collection stream for all the leaves. For example:
This subscription pushes one message with two leaves because the gather point full-interface-stats is same for both the sensor-paths bytes-sent and bytes-received. This grouping of the leaves happens at the subscription level. If these paths are configured under different subscriptions,
data is streamed as different collections with separate messages each including one leaf bytes-sent or bytes-received.
For event-driven subscriptions, streaming is always at the gather point in the model, even if specific leaves or leaf is configured
as sensor-path. There is configuration to restrict streaming specific leaves for event-driven subscriptions. If this configuration
is used, the sensor-path of the configured leaf streams data even if there is a change in one of its adjacent leaves. This
indicates that even if there is no change in value of the configured leaf, data can stream out to the collector. The collector
must be set to check if the leaf value changed before taking action on the streamed data.
telemetry model-driven
include select-leaves-on-events
Note
It is not recommended to configure sensor-paths with the same gather point into different subscriptions.
In the sensor path configuration, the schema node identifier can be configured with or without a leading slash.
An MDT-capable device, such as a router, associates the sensor path to the nearest container path in the model. The router
encodes and streams the container path within a single telemetry message. A receiver receives data about all the containers
and leaf nodes at and below this container path. The router streams telemetry data, for one or more sensor-paths, at the configured
frequency (Cadence-driven Telemetry), or when an event occurs (Event-driven Telemetry), to one or more collectors through subscribed sessions.
Subscription
A subscription binds one or more sensor paths and destinations.
The collector uses the subscription to receive updates about the state of data on the router. A subscription can consist of
one or more sensor paths. The data for the paths that you have subscribed starts streaming until the session is terminated
by the collector or the telemetry subscription configuration is removed to cancel the subscription.
The following example shows subscription SUB1 that associates a sensor-group, sample interval and destination group.
With a strict-timer configured for the sample interval, the data collection starts exactly at the configured time interval allowing a more deterministic
behavior to stream data. In 32-bit platforms, strict-timer can be configured only under the subscription. Whereas, 64-bit platforms support configurtion at global level in addition
to the subscription level. However, configuring at the global level will affect all configured subscriptions.
Data that is streamed from a router can be encoded using one of these formats:
GPB encoding: Configuring for GPB encoding requires metadata in the form of compiled .proto files. A .proto file describes the GPB message format which is used to stream data. The .proto files are available at Cisco Network Telemetry Proto in Github.
Compact GPB encoding: Data is streamed in a compressed format and not in a self-descriptive format. A .proto file corresponding to each sensor-path must be used by the collector to decode the streamed data.
Self-describing GPB encoding: Data streamed for each sensor path is in a self-describing and ASCII text format. A single .proto file, telemetry.proto, is used by the collector to decode any sensor path data. Self-describing GPB encoding is easier to manage because it needs
single .proto file to decode any sensor path data, even though the message size is large.
JSON encoding: Data is streamed in strings of keys and its values in a human-readable format.
Transport
In the telemetry push model, the router streams telemetry data using a transport protocol. The generated data is encapsulated
into the desired format using encoders.
Model-Driven Telemetry (MDT) data is streamed through these supported transport protocols:
Google Protocol RPC (gRPC): used for both dial-in and dial-out modes.
Note
gRPC protocol is not supported over Multiprotocol Label Switching (MPLS) including explicit-null label.
Transmission Control Protocol (TCP): used for only dial-out mode.
User Datagram Protocol (UDP): used for only dial-out mode. Because UDP is connectionless, the UDP destination is shown as
Active irrespective of the state of the collector.
UDP for Telemetry is not recommended for production networks as it doesn't support models that send messages larger than the
UDP size limit of 65507 bytes.
If a message is dropped by the network before it reaches the collector, the protocol does not resend the data.
Note
Telemetry data is streamed out of the router using an Extensible Manageability Services Deamon (emsd) process. The data of
interest is subscribed through subscriptions and streamed through gRPC, TCP or UDP sessions. However, a combination of gRPC,
TCP and UDP sessions with more than 150 active sessions leads to emsd crash or process restart.
gRPC Network Management Interface
gRPC Network Management Interface (gNMI) is a gRPC-based network management protocol used to modify, install or delete configuration
from network devices. It is also used to view operational data, control and generate telemetry streams from a target device
to a data collection system. It uses a single protocol to manage configurations and stream telemetry data from network devices.
For the list of gNMI RPCs, see the Programmability Configuration Guide.
gNMI Subscription Modes
gNMI defines 3 modes for a streaming subscription that indicates how the router must return data in a subscription:
A SAMPLE mode is cadence-based subscription supported for all the operational models.
An ON_CHANGE mode is event-based subscription. In this mode, only the state leaf supports on_change events.
A TARGET_DEFINED mode allows the target to determine the best type of subscription to be created on a per-leaf basis.
When a client creates a subscription specifying the TARGET_DEFINED mode, the target, here the router, determine the best type of subscription to be created on a per-leaf basis. If the path
specified within the message refers to some leaves which are event-driven, then an ON_CHANGE subscription is created.
Note
In Cisco IOS XR Release 7.2.1, the TARGET_DEFINED subscription mode is supported only for sensor paths of OpenConfig model; native model is not supported. The supported models
are: OC Interfaces, OC Telemetry, OC Shell Util, OC System NTP and OC Platform.
An initial synchronization is established with all the leaves. If a new client has the same request information, then the
initial synchronization is sent to all the clients connected at that point. This indicates that if multiple clients request
the same subscription information, then the initial synchronization is resent even to the older connections.
The telemetry model-driven gnmi-target-defined command can be used to determine the cadence for the leaves (set to be cadence-driven) using the following prameters:
cadence-factor: Multiplier factor for cadence of target-defined subscriptions. The range is 1 to 10. The default value is 2.
minimum-cadence: Minimum cadence for target-defined subscriptions in seconds. The range is 1 to 65535. The default value is 30 seconds.
If cadence is specified as part of the gNMI request, this cadence is used for the first collection of data. Once the collection
time is calculated, use the following formula to calculate the cadence.
Cadence = Maximum (Global minimum-cadence defined, (Collection time for one collection * cadence-factor))
If cadence is not specified as part of the request, the default value of 30 secs is used. This value can be modified using
the following commands:
gRPC Network Operations Interface (gNOI) defines a set of gRPC-based microservices for executing operational commands on network
devices. Extensible Manageability Services (EMS) gNOI is the Cisco IOS XR implementation of gNOI. gNOI uses gRPC as the transport
protocol and the configuration is same as that of gRPC.
For the list of gNOI RPCs, see the Programmability Configuration Guide.
TLS Authentication
The gRPC protocol supports Transport Layer Security (TLS) for encrypting data. By default, model-driven telemetry uses TLS
to dial-out.
When TLS is enabled, the server sends a certificate to authenticate it with the collector. The collector validates the certificate
verifying which certificate authority has signed it and generates session keys to encrypt the session.
To bypass the TLS option, use grpc no-tls command.
Note
Although TLS provides secure communication between servers and clients, TLS version 1.0 may pose a security threat. You can
now disable TLS version 1.0 using the grpc tlsv1-disable command.
Dial-out scenario
Verify that the gRPC protocol is configured for dial-out mode, as it supports TLS by default.
Copy the TLS certificate to the /misc/config/grpc/dialout/ path on the router. This certificate is used to authenticate the server with the collector.
In the certificate, set the Common Name (CN) to match the command, which defaults to the IP address of the destination if not specified.
protocol grpc tls-hostname
Disable TLS 1.0: For security reasons, you can disable TLS version 1.0 using the tlsv1-disable command .
grpc
            tlsv1-disable
This output shows the certificate that gRPC uses to establish a dialout session:
Use the certificate generated by EMS located in /misc/config/grpc/[ems.pem|ca.cert|ems.key]. To use your own certificates, replace them with the same names in the grpc directory and restart the process.
Filter Telemetry Data Using Regex Key
Table 3. Feature History Table
Feature Name
Release Information
Description
Filter Telemetry Data Using Regex Keys in Sensor Paths
Release 7.4.1
Streaming huge telemetry data can create congestion in the network.
With this feature, you can use the regular expression (regex) keys in the sensor path configuration on the router. The keys
limit the amount of data that can be streamed, thereby ensuring better bandwidth utilization.
You can stream telemetry data from your network device using sensor paths and subscriptions.
The regular expression (regex) keys are used in sensor paths to limit the amount of data getting streamed from the router.
The keys can be specified for any lists in the sensor paths that are subscribed. This allows you to filter data at the source
(router) instead of filtering data at the collector. Regex keys help in better bandwidth utilization because only the data
of interest is streamed from the router. Regex keys are supported for native models, open-config (OC) models and events.
Note
Filtering data using regex key is not supported for System admin data models.
The syntax re in the sensor path indicates a filtered data using regex key. The characters '*', '.', '[', ']' and '\' are supported. For
example, re'Gig.*' matches all Gigabit interfaces.
Note
Telemetry supports only the POSIX regular expressions.
Example: Regex Key Filtering on Gigabit InterfacesThe sensor path with specific keys:
To this sensor path, apply regex keys to matche all IP addresses that starts with 100.100.100. In this example, the asterix (*) entry matches a range of addresses from 1 to 256.
Explore the Methods to Establish a Telemetry Session
A telemetry session can be initiated using: either the dial-out mode or the dial-in mode. Although the modes to establish
a telemetry session are different, both modes use the same data model and stream the same data.
Dial-Out Mode
In a dial-out mode, the router dials out to the receiver to establish a subscription-based telemetry session. Because the router initiates
the connection, there is no need to manage the ports for inbound traffic. In this default mode of operation, the protocols
you use to establish a session gives you the flexibility to chose between simplicity (TCP) and security (gRPC). A simple protocol
requires only accessibility to the socket on the collector. A secure protocol, additionally, offers security capabilities
to authenticate and encrypt the session. You can, therefore, secure your collector, and establish a much advanced method of
communication with the router. If the connection between the router and the destination is lost, the router re-establishes
the connection with the destination and continues to push data again. However, data transmitted during the time of reconnection
is lost.
In a dial-in mode, a collector dials in to the router, and subscribes dynamically to one or more sensor paths specified in a subscription.
The router is open for connections from the collector. This mode is useful to establish a single channel of communication
with the router. Because the collector establishes the session, there is no need to create destinations in the configuration.
Additionally, the protocol (gRPC) used to establish a session provides advanced security capabilities to authenticate and
encrypt the session. If the connection between the router and the collector is lost, the session is cancelled. The collector
must reconnect to the router to restart streaming data. Only gRPC supports dial-in session.
Identify the Telemetry Session Suitable for Your Network
The transport protocols and encoding formats in your network help you determine which mode is suitable for your needs. The
encoding efficiency is determined by the space that data occupies on the wire, memory utilization, and the amount of data
that you plan to stream from the router.
Use TCP dial-out mode if you plan to stream telemetry data using a simple setup with a single router and collector. It is
simple to configure and does not require extensive knowledge about protocols. It removes the need to manage ports for inbound
connections.
Use gRPC dial-out mode if your setup involves scaling out to many devices or needs encryption of your data. This mode removes
the need to manage ports for inbound connections.
Use gRPC dial-in mode if you are already using gRPCin your network and you want your sessions to be dynamic without having
the data streamed to fixed destinations. This mode is convenient if you prefer a centralized way configuring your network
and requesting operational data.

 Feedback