Configuring and Using the Profiler Application

Adding Nutanix AHV to the Profiler

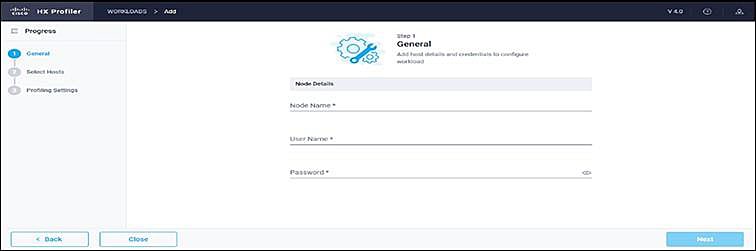
At the first login following installation of the HX Workload Profiler, you are redirected to the landing page where you can find the + Add Workload option on the top right corner of the page. You can select Nutanix, then you can add multiple Nutanix clusters.

To calculate the metrics for a host, the Profiler captures the metrics for all the VMs on the Host.

The workflow includes:

  • Node Details tab: Records your Nutanix AHV prism details and then connects to the Nutanix REST API. If the connection succeeds, the Next button displays enabling you to select the hosts for profiling.

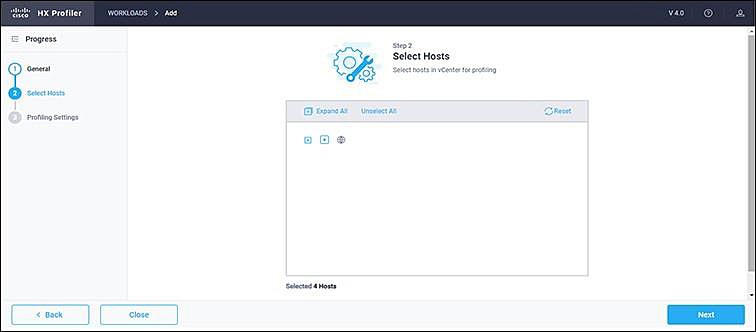
  • Select Hosts tab: Provides hierarchy of Hosts, with the option to select hosts to Profile.

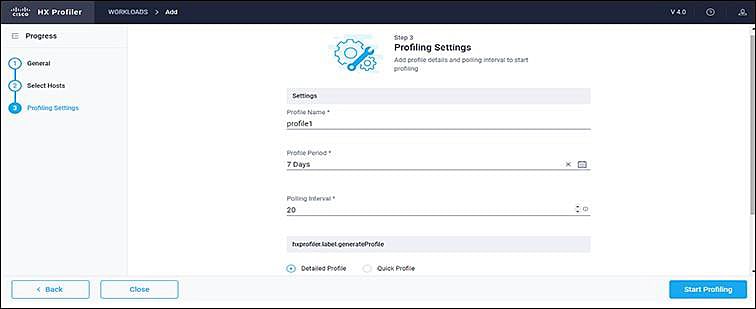
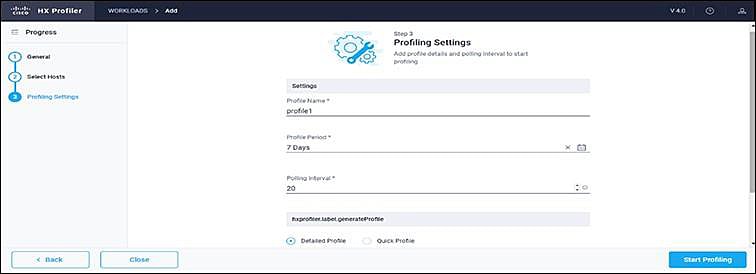
  • Profiling Setting tab, which provides:

    • Profile Name: The name of the profile. Profile names must be unique.

    • Profile period: User defined number of polling days. The default is 7 days, and the minimum is 1 day.

    • Polling Interval: Frequency for which polling should occur.

Procedure


Step 1

Log into the Profiler. See Logging in to the Profiler.

Step 2

Follow the steps provided to enter values for the following options:
Item

Description

Node Name

Nutanix AHV Prism central IP/Cluster External IP you are adding.

User Name

Name of the user as part of the login credentials for the Prism central.

Password

The password set as part of the login credentials for Prism central.

Polling Interval

The interval at which you want polling to occur. The default is 20 seconds. You can change the interval to between 20-120 seconds, based on the number of hosts and VMs being polled in that Nutanix AHV.

Step 3

Click Start Profiling. The Profiler service starts automatically.

Step 4

When the connection status indicates successful connection, click Next.

Step 5

On the Poll filter tab, review the hierarchy values.


Starting Nutanix AHV Data Profiling

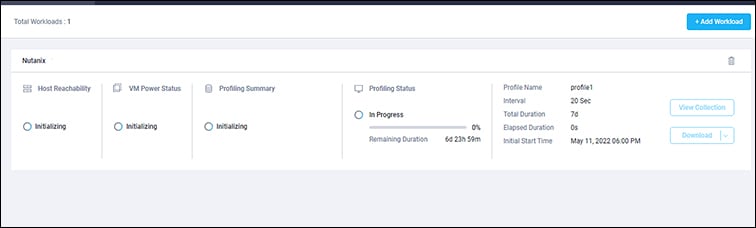
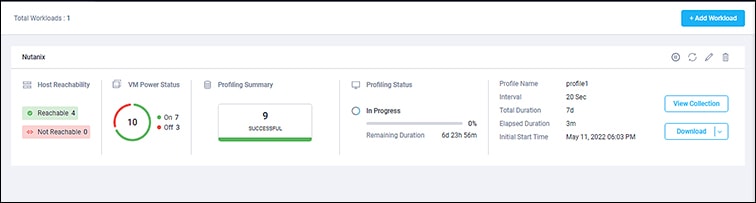
Following the successful addition of a Nutanix AHV workload, the new Nutanix AHV displays on the Data Inventory (home) page. You configure the profiling attributes by providing the profile name and duration.

Table 1. Profiling Operation Options

Item

Description

Delete (trash can)

Deletes a previously added Nutanix AHV.

Edit (pen)

Edit Nutanix AHV properties to add or remove hosts for polling.

Stop ( || symbol)

Stops the profiling so you can resume it later.

Reset (refresh symbol)

Performs a reset operation, which creates a new profile and starts polling. When you trigger reset, the profiler stops the active/running profile and creates a new one. A prompt asks for confirmation.

View Collection

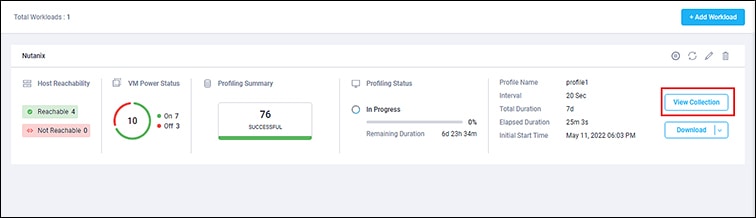
Opens the View Collection page so you can browse through the collected data as part of the profiling to review the HOST and VM level data.

Polling starts as soon as you enter the profiler name, days, and polling period.

Procedure


Step 1

In the dialog that displays, perform the following steps:

  1. Enter a name for the profile.

  2. Select a duration value from the Profiling Period down-drop list.

  3. Click Ok.

Following successful profile creation, the Profiler begins polling the selected hosts and all the VMs on those hosts. When the polling starts, the data collector runs as a background process. The Datacenter Inventory page displays information about the hosts and polling, showing number of hosts and the status of the polling.
Step 2

(Optional) To stop an in-progress profiling operation so you can resume it later, see Stopping the Profiler Service.

Step 3

(Optional) To stop an in-progress profiling operation, click Reset. You can then start a new one.

Step 4

(Optional) To browse through the collected data, see Viewing Data Collections from Nutanix AHV Server .

Step 5

(Optional) To download profiling data, see Downloading Nutanix AHV Profiling Results.


Downloading Nutanix AHV Profiling Results

Procedure


Step 1

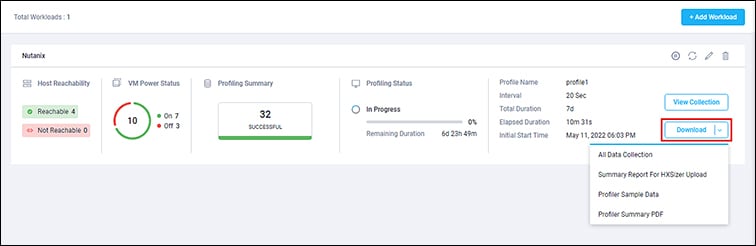
On the Datacenter Inventory page, locate and select the profile whose data you want to download.

Step 2

Use the Download option to select one of the following:

Option

Description

All Data Collection

Downloads sizer summary, time series, and CVS for both the host and VM along with PDF report.

Summary Report for HxSizer Upload

The download provides the output in CSV format and can be directly uploaded to the Compute and Capacity Workload of HxSizer.

Profiler Sample Data

Downloads the sampled data for the selected profile in the following formats:

  • Summarize host data (CVS)

  • Summarize VM data (CVS)

  • Time series data of host (zipped CSV file)

  • Time series data of VM (zipped CSV file)

Profiler Summary PDF

PDF download

Step 3

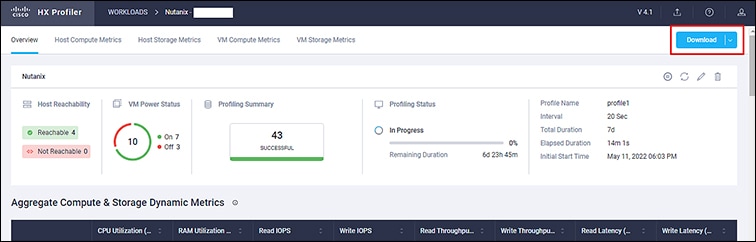
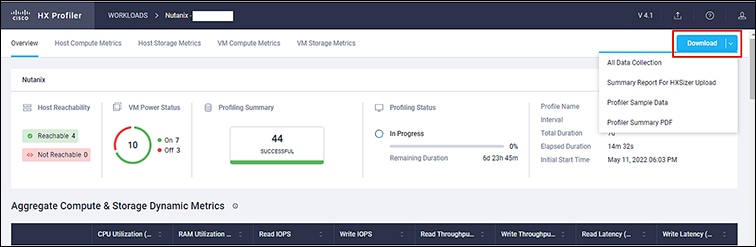
You can still download the profiling results when viewing the compute, storage, and network data of various hosts and VMs by clicking on the Download button on the top right corner of the UI.


Viewing Data Collections from Nutanix AHV Server

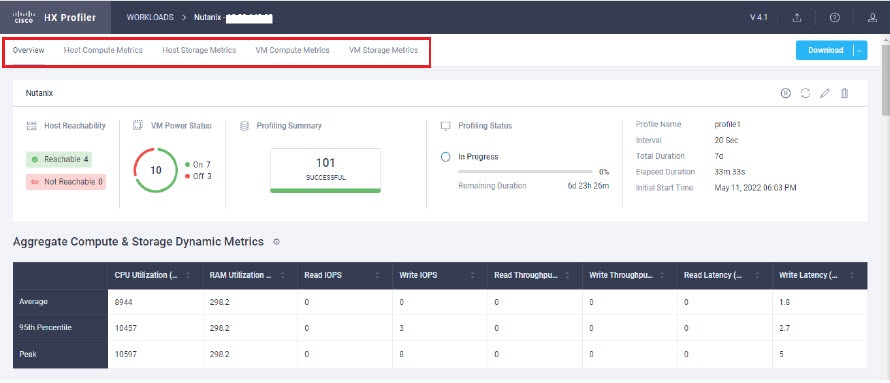
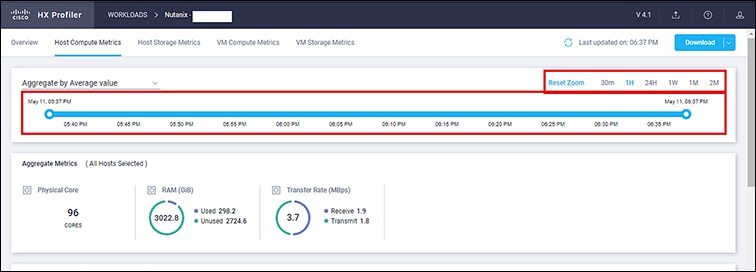
The View Collection page has five tabs at the top left of the page, Overview, Host Compute Metrics, Host Storage Metrics, VM Compute Metrics, VM Storage Metrics. When clicked, they show summary data described in his section. The View Collection page also provides the summarized data for Compute Summary and Storage Summary of individual host and VMs. You can also fetch the data for specific period of profiling using the predefined filter present on the top right corner of the page with the minimum being 30minutes or the user can also use the time line to select the time period. The following sections describe the summary data shown through filter tool use and in that shown in each tab and view.

Table 2. Host View Filter Options

Item

Description

Aggregation

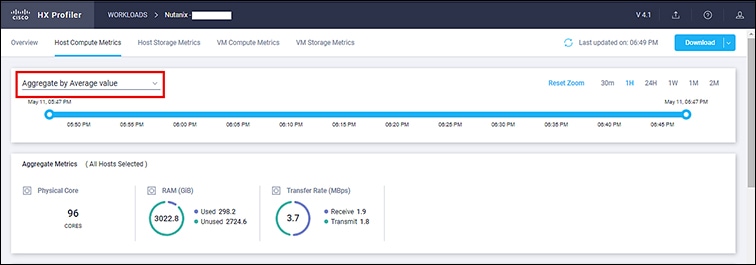
Filters to view the summarizations based on peak or average selections. Your selection determines the display of the table metrics and trends. The summarized values represent the following:

  • Peak: Peak value of all the metrics in the selected interval

  • Average: Averages of all the values in the selected interval

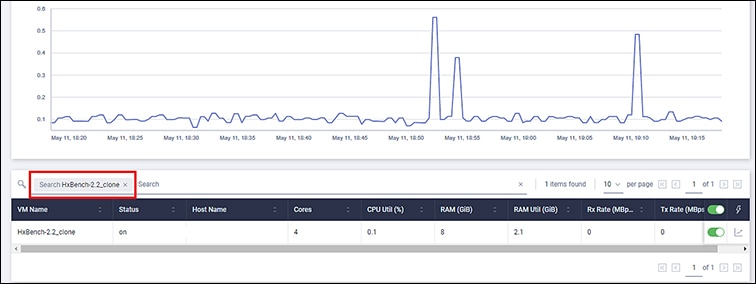
You can filter Host metrics using the search option by host name only. For VM metrics, you can filter either by the Host name to which the VM belongs or directly with the VM name, using the search option.

Host and VM Summarized Metrics

Based on your time period and parameters selections, the Profiler computes and populates the compute and storage metrics. Metrics display for the following values:

Host View Compute Table

  • Host_Name

  • Processor Type

  • Clock (GHz)

  • #Physical Cores

  • CPU Util (%)

  • RAM (GB)

  • RAM Util (GB)

  • Network Throughput- Rx (MBps)

  • Network Throughput- Tx (MBps)

Host View Storage Table

  • Provisioned Capacity (TB)

  • Used Storage Capacity (TB)

  • Read Throughput (MBps)

  • Write Throughput (MBps)

  • Read (%)

  • Write (%)

  • Read IOPS

  • Write IOPS

  • Read Latency (ms)

  • Write Latency (ms)

VM View Compute Table

  • Cores

  • VM Name

  • Status

  • Host_Name

  • CPU Util (%)

  • RAM (GiB)

  • RAM Util (GiB)

  • Network Throughput- Rx (MBps)

  • Network Throughput- Tx (MBps)

VM View Storage Table

  • VM Name

  • Host_Name

  • Disk Capacity (GiB)

  • Disk Used (GiB)

  • Read Throughput (MBps)

  • Write Throughput (MBps)

  • Read (%)

  • Write (%)

  • Read IOPS

  • Write IOPS

  • Read Latency (ms)

  • Write Latency (ms)

Host and VM Trends

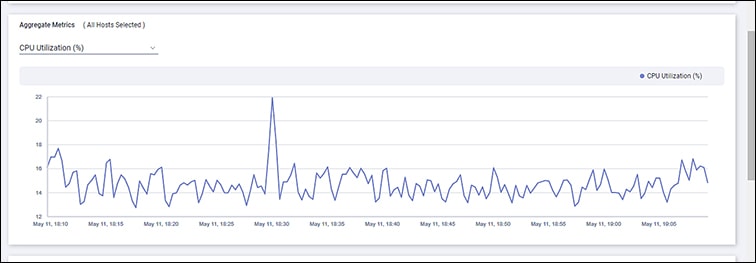
The View Collection page provides trend charts and an overview of various parameters at a host level and VM level for both compute and storage parameters. The overview provides information aggregate storage and compute matrix. You can view the trend charts by selecting the host or the VM from the table.

Metrics for the following values display in the trend charts:

Host View Compute Trends

  • CPU Utilization (%)

  • RAM Utilization (GiB)

  • Receive Rate (Mbps)

  • Transmit Rate (Mbps)

VM View Compute Trends

  • CPU Utilization (%)

  • RAM Utilization (GB)

  • Receive Rate (Mbps)

  • Transmit Rate (Mbps)

Host and VM View Storage Trends

  • Read Throughput (MBps)

  • Write Throughput (MBps)

  • Read Ratio

  • Write Ratio

  • Read IOPS

  • Write IOPS

  • Read Latency (ms)

  • Write Latency (ms)

Viewing a Nutanix AHV Collection

You can also use the filter tool or the filter and search tool in the Hosts and VM views to display only those hosts and VMs that you want to see.

Procedure


Step 1

In the Datacenter Inventory page, click View Collection to browse through the collected data.

Step 2

In the View Collection page, select between Host Compute Metrics, Host Storage Metrics, VM Compute Metrics or VM Storage Metrics

Step 3

In the Select VMs tab, select or unselect the toggle switch for the VMs you want to view, then click Next. All VMs are selected by default.

Step 4

To view data for a different time period, select from the options in the top right corner with the default minimum value of 30 minutes. Use the time slider above the fixed time period selection to view data for a specific time range from the selected time period.


Upload 30-Days Sizing Summary Report

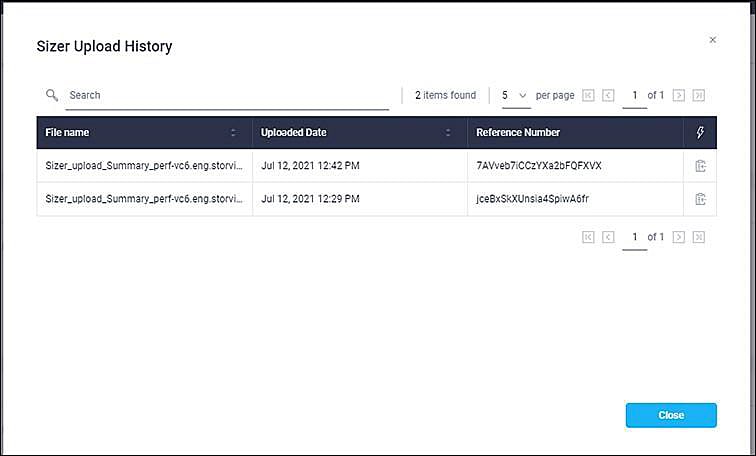
You can upload the 30-Days Sizing Summary Report to the HxSizer application from HxProfiler. When the report upload is successful, a reference number is generated. View the history of uploads along with the reference number from the HxProfiler application. In addition to identifying the report, the refence number may be used to claim the scenario from the HxSizer application.

Perform the following steps in the Cisco HX Profiler dashboard to upload the 30-Days Sizing Summary report:

Procedure


Step 1

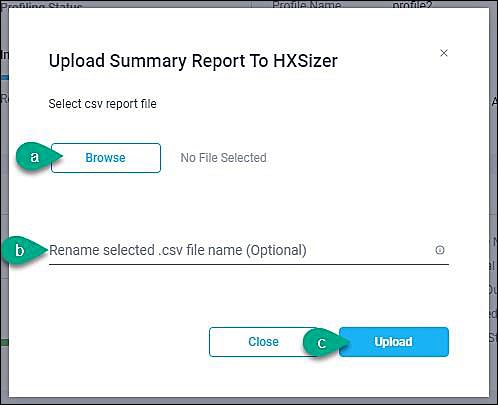
Click the Upload icon on the HX Profiler ribbon and select Upload To HXSizer. The Upload Summary Report To HXSizer window appears.

Step 2

Click the Browse button to navigate to the local .csv file that needs to be uploaded to the HXSizer portal.

  1. Select the desired .csv file.

  2. (Optional) To modify the csv file name, type a new name in the Rename selected .csv file name field.

  3. Click Upload.

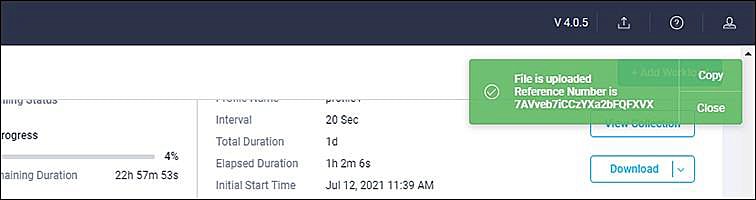
A reference number indicates a successful upload. Use the Copy button to copy the reference number and use it to claim the scenario in the HXSizer application.

Step 3

(Optional) View Upload History

  1. Click the Upload icon on the HX Profiler ribbon and select Upload History to view the list of 30-Days sizing summary .csv files that have been uploaded to the sizer application from profiler.