
Platform Overview
Supported Services
Cisco Nexus Dashboard is a central management console for multiple data center sites and a common platform for hosting Cisco data center operation services, such as Nexus Dashboard Insights and Nexus Dashboard Orchestrator. These services are available for all the data center sites and provide real time analytics, visibility, assurance for network policies and operations, as well as policy orchestration for the data center fabrics, such as Cisco ACI or Cisco NDFC.
Nexus Dashboard provides a common platform and modern technology stack for the above-mentioned micro-services-based applications, simplifying the life cycle management of the different modern applications and reducing the operational overhead to run and maintain these applications. It also provides a central integration point for external 3rd party applications with the locally hosted applications.
Nexus Dashboard cluster typically consists of 1 or 3 primary nodes. For 3-node clusters, you can also provision a number of worker nodes to enable horizontal scaling and standby nodes for easy cluster recovery in case of a primary node failure. For maximum number of worker and standby nodes supported in this release, see the "Verified Scalability Limits" sections of the Cisco Nexus Dashboard Release Notes. For more information about extending your cluster with additional nodes, see Infrastructure Management.
Hardware vs Software Stack
Nexus Dashboard is offered as a cluster of specialized Cisco UCS servers (Nexus Dashboard platform) with the software framework (Nexus Dashboard) pre-installed on it. The Cisco Nexus Dashboard software stack can be decoupled from the hardware and deployed in a number of virtual form factors. For the purposes of this document, we will use "Nexus Dashboard hardware" specifically to refer to the hardware and "Nexus Dashboard" to refer to the software stack and the GUI console.

Root access to the Nexus Dashboard software is restricted to Cisco TAC only. A special user rescue-user is created for all Nexus Dashboard deployments to enable a set of operations and troubleshooting commands. For additional information about the available rescue-user commands, see the "Troubleshooting" chapter of the Nexus Dashboard User Guide.
This guide describes how to use the Nexus Dashboard; for hardware installation, see Nexus Dashboard Hardware Setup Guide and for deployment planning and Nexus Dashboard software installation, see the Nexus Dashboard Deployment Guide.
Services
Nexus Dashboard is a standard appliance platform to build and deploy services that would allow you to consume all Nexus Dashboard products in a consistent and uniform manner. You can deploy services like Insights, Orchestrator, Fabric Controller, and Data Broker with the Nexus Dashboard platform providing the necessary capacity and life cycle management operations for these services.
Typically, the Nexus Dashboard platform is shipped with only the software required for managing the lifecycle of these services, but no actual services are packaged with the appliance. If you allow public network connectivity from your data centers, you can download and install the services with a few clicks. However, without public network connectivity, you will need to manually download these services' images, upload them to the platform, and perform installation operations before you can use them.
If you are ordering the physical Nexus Dashboard servers, you have the option to choose some services to be pre-installed on the hardware before it is shipped to you. For more information, see the Nexus Dashboard Ordering Guide. Note that if you are deploying the virtual or cloud form factors of the Nexus Dashboard, you will need to deploy the services separately after the cluster is ready.
Available Form Factors
This release of Cisco Nexus Dashboard can be deployed using a number of different form factors. Keep in mind however, you must use the same form factor for all nodes, mixing different form factors within the same cluster is not supported. The physical form factor currently supports two different UCS servers (UCS-C220-M5 and UCS-C225-M6) for the cluster nodes, which you can mix within the same cluster.
Not all services are supported on all form factors. When planning your deployment, ensure to check the Nexus Dashboard Cluster Sizing tool for form factor and cluster size requirements.
-
Cisco Nexus Dashboard physical appliance (.iso)
This form factor refers to the original physical appliance hardware that you purchased with the Cisco Nexus Dashboard software stack pre-installed on it.
The later sections in this document describe how to configure the software stack on the existing physical appliance hardware to deploy the cluster. Setting up the original Cisco Nexus Dashboard platform hardware is described in Cisco Nexus Dashboard Hardware Setup Guide.
-
VMware ESX (.ova)
Virtual form factor that allows you to deploy a Nexus Dashboard cluster using VMware ESX virtual machines with one of two resource profiles:
-
Data node — node profile designed for data-intensive applications, such Nexus Dashboard Insights
-
App node — node profile designed for non-data-intensive applications, such Nexus Dashboard Orchestrator
-
-
Linux KVM (.qcow2)
Virtual form factor that allows you to deploy a Nexus Dashboard cluster using Linux KVM virtual machines.
-
Amazon Web Services (.ami)
Cloud form factor that allows you to deploy a Nexus Dashboard cluster using AWS instances.
-
Microsoft Azure (.arm)
Cloud form factor that allows you to deploy a Nexus Dashboard cluster using Azure instances.
-
In an existing Red Hat Enterprise Linux (RHEL) system
Beginning with Release 2.2(1), you can run Nexus Dashboard node in an existing Red Hat Enterprise Linux server.
Cluster Sizing Guidelines
As mentioned previously, Nexus Dashboard cluster is first deployed using 1 or 3 primary nodes. Depending on the type and number of services you choose to run, you may be required to deploy additional worker nodes in your cluster after the initial deployment. For cluster sizing information and recommended number of nodes based on specific use cases, see the Nexus Dashboard Capacity Planning tool.
Single-node clusters are supported for a limited number of services and cannot be extended to a 3-node cluster after the initial deployment.
Only 3-node clusters support additional worker nodes.
If you deploy a single-node cluster and want to extended it to a 3-node cluster or add worker nodes, you will need to redeploy it as a base 3-node cluster.
For 3-node clusters, at least 2 primary nodes are required for the cluster to remain operational. If 2 primary nodes fail, the cluster will go offline and cannot be used until you recover it as described in this guide.
Adding worker nodes to your cluster is described in Managing Worker Nodes..
Adding standby nodes to your cluster is described in Managing Standby Nodes..
For the full list of supported applications and the associated compatibility information, see the Data Center Networking Services Compatibility Matrix.
Requirements and Guidelines
The following sections cover some deployment requirements which you have already completed during cluster configuration and bootstrap as well as reference information which you may need while using the cluster and deploying services.
Network Time Protocol (NTP) and Domain Name System (DNS)
The Nexus Dashboard nodes require valid DNS and NTP servers for all deployments and upgrades.
Lack of valid DNS connectivity (such as if using an unreachable or a placeholder IP address) can prevent the system from deploying or upgrading successfully.
Nexus Dashboard acts as both a DNS client and resolver. It uses an internal Core DNS server which acts as DNS resolver for internal services. It also acts as a DNS client to reach external hosts within the intranet or the Internet, hence it requires an external DNS server to be configured.
Additionally, Nexus Dashboard does not support DNS servers with wildcard records.
Beginning with release 3.0(1), Nexus Dashboard also supports NTP authentication using symmetrical keys. You can configure NTP keys where each key can be assigned to multiple NTP servers. Enabling and configuring NTP authentication is described as part of the deployment steps in the later sections.
BGP Configuration and Persistent IPs
Previous releases of Nexus Dashboard allowed you to configure one or more persistent IP addresses for services (such as Nexus Dashboard Insights) that require retaining the same IP addresses even in case they are relocated to a different Nexus Dashboard node. However, in those releases, the persistent IPs had to be part of the management and data subnets and the feature could be enabled only if all nodes in the cluster were part of the same Layer 3 network. Here the services used Layer 2 mechanisms like Gratuitous ARP or Neighbor Discovery to advertise the persistent IPs within it’s Layer 3 network
Beginning with Release 2.2(1), the Persistent IPs feature is supported even if you deploy the cluster nodes in different Layer 3 networks. In this case, the persistent IPs are advertised out of each node’s data links via BGP, which we refer to as "Layer 3 mode". The IPs must also be part of a subnet that is not overlapping with any of the nodes' management or data subnets. If the persistent IPs are outside the data and management networks, this feature will operate in Layer 3 mode by default; if the IPs are part of those networks, the feature will operate in Layer 2 mode.
BGP can be enabled during cluster deployment or from the Nexus Dashboard GUI after the cluster is up and running.
If you plan to enable BGP and use the persistent IP functionality, you must:
-
Ensure that the peer routers exchange the advertised persistent IPs between the nodes' Layer 3 networks.
-
Choose to enable BGP at the time of the cluster deployment as described in the subsequent sections or enable it afterwards in the Nexus Dashboard GUI as described in [Persistent IP Addresses].
-
Ensure that the persistent IP addresses you allocate do not be overlap with any of the nodes' management or data subnets.
Nexus Dashboard External Networks
Cisco Nexus Dashboard is deployed as a cluster, connecting each service node to two networks. When first configuring Nexus Dashboard, you will need to provide two IP addresses for the two Nexus Dashboard interfaces—one connected to the Data Network and the other to the Management Network.
Individual services installed in the Nexus Dashboard may utilize the two networks for additional purposes, so we recommend consulting the specific service’s documentation in addition to this document for your deployment planning.
| Data Network | Management Network |
|---|---|
|
|
The two networks have the following requirements:
-
For all new Nexus Dashboard deployments, the management network and data network must be in different subnets.
-
For physical clusters, the management network must provide IP reachability to each node’s CIMC via TCP ports 22/443.
Nexus Dashboard cluster configuration uses each node’s CIMC IP address to configure the node.
-
For Nexus Dashboard Insights service, the data network must provide IP reachability to the in-band network of each fabric and of the APIC.
-
For Nexus Dashboard Insights and AppDynamics integration, the data network must provide IP reachability to the AppDynamics controller.
-
For Nexus Dashboard Orchestrator service, the data network can have in-band and/or out-of-band IP reachability for Cisco APIC sites but must have in-band reachability for Cisco NDFC sites.
-
The data network interface requires a minimum MTU of 1500 to be available for the Nexus Dashboard traffic.
Higher MTU can be configured if desired.
-
Nexus Dashboard does not support SNMP polling to monitor or gather information from the servers.
-
The following table summarizes service-specific requirements for the management and data networks.
Changing the data subnet requires redeploying the cluster, so we recommend using a larger subnet than the bare minimum required by the nodes and services to account for any additional services in the future. In addition to the requirements listed in this section, ensure that you consult the Release Notes for the specific service you plan to deploy.
Allocating persistent IP addresses for both Layer 2 and Layer 3 connectivity is done after the cluster is deployed using the External Service Pools configuration in the UI, as described in the Cisco Nexus Dashboard User Guide.
We recommend consulting the specific service’s documentation for any additional requirements and caveats related to persistent IP configuration.
Nexus Dashboard Service Management Interface Data Interface Total Number of Persistent IPs Nexus Dashboard Orchestrator
Layer 3 adjacent
Layer 3 adjacent
N/A
Nexus Dashboard Insights without SFLOW/NetFlow (ACI fabrics)
Layer 3 adjacent
Layer 3 adjacent
N/A
Nexus Dashboard Insights without SFLOW/NetFlow (NDFC fabrics)
Layer 3 adjacent
Layer 2 adjacent
6 IPs in data interface network if using IPv4
7 IPs in data interface network if using IPv6
Nexus Dashboard Insights with SFLOW/NetFlow (ACI or NDFC fabrics)
Layer 3 adjacent
Layer 2 adjacent
6 IPs in data interface network
Nexus Dashboard Fabric Controller, Release 12.1(3) and latter
Layer 2 or Layer 3 adjacent
Layer 2 or Layer 3 adjacent
When operating in Layer 2 mode with LAN deployment type and LAN Device Management Connectivity set to
Management(default)-
2 IPs in the management network for SNMP/Syslog and SCP services
-
If EPL is enabled, 1 additional IP in the data network for each fabric
-
If IP Fabric for Media is enabled, 1 additional IP in the management network for telemetry
When operating in Layer 2 mode with LAN deployment type and LAN Device Management Connectivity set to
Data:-
2 IPs in the data network for SNMP/Syslog and SCP services
-
If EPL is enabled, 1 additional IP in the data network for each fabric
-
If IP Fabric for Media is enabled, 1 additional IP in the data network for telemetry
Nexus Dashboard Fabric Controller, Release 12.1(3) and latter
Layer 2 or Layer 3 adjacent
Layer 2 or Layer 3 adjacent
When operating in Layer 3 mode with LAN deployment type:
-
LAN Device Management Connectivity must be set to
Data -
2 IPs for SNMP/Syslog and SCP services
-
If EPL is enabled, 1 additional IP in the data network for each fabric
-
All persistent IPs must be part of a separate pool that must not overlap with the management or data subnets
For more information about Layer 3 mode for persistent IPs, see the [Persistent IP Addresses]
When operating in Layer 3 mode with SAN Controller deployment type:
-
1 IP for SSH
-
1 IP for SNMP/Syslog
-
1 IP for SAN Insights functionality
IP Fabric for Media mode are not supported in Layer 3 mode
-
-
Connectivity between the nodes is required on both networks with the following additional round trip time (RTT) requirements.
You must always use the lowest RTT requirement when deploying the Nexus Dashboard cluster and applications. For example, if you plan to co-host the Insights and Orchestrator services, site connectivity RTT must not exceed 50ms.
Application Connectivity Maximum RTT Nexus Dashboard cluster
Between nodes
150 ms
Nexus Dashboard Orchestrator
Between nodes
150 ms
To sites
For APIC sites: 500 ms
For NDFC sites: 150ms
Nexus Dashboard Insights
Between nodes
50 ms
To switches
50 ms
Nexus Dashboard Fabric Controller
Between nodes
50 ms
To switches
200 ms*
*POAP (PowerOn Auto Provisioning) is supported with a max RTT of 50 ms between Nexus Dashboard Fabric Controller and the switches.
Nexus Dashboard Internal Networks
Two additional internal networks are required for communication between the containers used by the Nexus Dashboard:
-
Application overlay is used for applications internally within Nexus Dashboard
Application overlay must be a /16 network and a default value is pre-populated during deployment.
-
Service overlay is used internally by the Nexus Dashboard.
Service overlay must be a /16 network and a default value is pre-populated during deployment.
If you are planning to deploy multiple Nexus Dashboard clusters, they can use the same Application and Service subnets.
Communications between containers deployed in different Nexus Dashboard nodes is VXLAN-encapsulated and uses the data interfaces IP addresses as source and destination. This means that the Application Overlay and Service overlay addresses are never exposed outside the data network and any traffic on these subnets is routed internally and does not leave the cluster nodes.
For example, if you had another service (such as DNS) on the same subnet as one of the Overlay networks, you would not be able to access it from your Nexus Dashboard as the traffic on that subnet would never be routed outside the cluster. As such, when configuring these networks, ensure that they are unique and do not overlap with any existing networks or services you may need to access from the Nexus Dashboard cluster nodes.
For the same reason, we recommend not using 169.254.0.0/16 (the Kubernetes br1 subnet) for the App or Service subnets.
IPv4 and IPv6 Support
Prior releases of Nexus Dashboard supported either pure IPv4 or dual stack IPv4/IPv6 configurations for the cluster nodes. Beginning with release 3.0(1), Nexus Dashboard supports pure IPv4, pure IPv6, or dual stack IPv4/IPv6 configurations for the cluster nodes and services.
When defining IP configuration, the following guidelines apply:
-
All nodes and networks in the cluster must have a uniform IP configuration – either pure IPv4, or pure IPv6, or dual stack IPv4/IPv6.
-
For dual stack configurations:
-
All networks described above must be in dual stack mode.
-
Partial configurations, such as IPv4 data network and dual stack management network, are not supported.
-
IPv6 addresses are also required for physical servers' CIMCs.
-
You can configure either IPv4 or IPv6 addresses for the nodes' management network during initial node bring up, but you must provide both types of IPs during the cluster bootstrap workflow.
-
Management IPs are used to log in to the nodes for the first time to initiate cluster bootstrap process.
-
You must configure both types of IP addresses for all nodes, networks, and persistent IPs.
-
All internal certificates will be generated to include both IPv4 and IPv6 Subject Alternative Names (SANs).
-
Kubernetes internal core services will start in IPv4 mode.
-
DNS will serve and forward to both IPv4 and IPv6 and server both types of records.
-
VxLAN overlay for peer connectivity will use data network’s IPv4 addresses.
-
Both IPv4 and IPv6 packets are encapsulated within the VxLAN’s IPv4 packets.
-
The UI will be accessible on both IPv4 and IPv6 management network addresses.
-
-
For pure IPv6 configurations:
-
You must provide IPv6 management network addresses when initially configuring the nodes.
-
After the nodes (physical, virtual, or cloud) are up, these IPs are used to log in to the UI and continue cluster bootstrap process.
-
You must provide IPv6 CIDRs for the internal App and Service networks described above.
-
You must provide IPv6 addresses and gateways for the data and management networks described above.
-
All internal certificates will be generated to include IPv6 Subject Alternative Names (SANs).
-
All internal services will start in IPv6 mode.
-
VxLAN overlay for peer connectivity will use data network’s IPv6 addresses.
-
IPv6 packets are encapsulated within the VxLAN’s IPv6 packets.
-
All internal services will use IPv6 addresses.
-
Communication Ports: Nexus Dashboard
The following ports are required by the Nexus Dashboard cluster.
All services use TLS or mTLS with encryption to protect data privacy and integrity over the wire.
| Service | Port | Protocol | Direction | Connection |
|---|---|---|---|---|
|
ICMP |
ICMP |
ICMP |
In/Out |
Other cluster nodes, CIMC, default gateway |
|
SSH |
22 |
TCP |
In/Out |
CLI and CIMC of the cluster nodes |
|
TACACS |
49 |
TCP |
Out |
TACACS server |
|
DNS |
53 |
TCP/UDP |
Out |
DNS server |
|
HTTP |
80 |
TCP |
Out |
Internet/proxy |
|
NTP |
123 |
UDP |
Out |
NTP server |
|
HTTPS |
443 |
TCP |
In/Out |
UI, other clusters (for multi-cluster connectivity), fabrics, Internet/proxy |
|
LDAP |
389 |
TCP |
Out |
LDAP server |
|
Radius |
1812 |
TCP |
Out |
Radius server |
|
KMS |
9880 |
TCP |
In/Out |
Other cluster nodes and ACI fabrics |
|
Infra-Service |
30012 |
TCP/UDP |
In/Out |
Other cluster nodes |
| Service | Port | Protocol | Direction | Connection |
|---|---|---|---|---|
|
SSH |
22 |
TCP |
Out |
In-band of switches and APIC |
|
HTTPS |
443 |
TCP |
Out |
In-band of switches and APIC/NDFC |
|
SSH |
1022 |
TCP/UDP |
In/Out |
Other cluster nodes |
|
VXLAN |
4789 |
TCP |
In/Out |
Other cluster nodes |
|
KMS |
9880 |
TCP |
In/Out |
Other cluster nodes and ACI fabrics |
|
Infra-Service |
3379 |
TCP |
In/Out |
Other cluster nodes |
|
Kafka |
30001 |
TCP |
In/Out |
In-band of switches and APIC/NDFC |
|
Infra-Service |
30016 |
TCP/UDP |
In/Out |
Other cluster nodes |
|
Infra-Service |
30500-30600 |
TCP/UDP |
In/Out |
Other cluster nodes |
Communication Ports: Nexus Dashboard Insights
In addition to the ports required by the Nexus Dashboard cluster nodes, which are listed above, the following ports are required by the Nexus Dashboard Insights service.
| Service | Port | Protocol | Direction | Connection |
|---|---|---|---|---|
|
Show Techcollection |
2022 |
TCP |
In/Out |
In-band of switches and APIC/NDFC |
|
Flow Telemetry |
5640-5671 |
UDP |
In |
In-band of switches |
|
TAC Assist |
8884 |
TCP |
In/Out |
Other cluster nodes |
|
KMS |
9989 |
TCP |
In/Out |
Other cluster nodes and ACI fabrics |
|
SW Telemetry |
5695 |
TCP |
In/Out |
Other cluster nodes |
Communication Ports: Nexus Dashboard Fabric Controller
In addition to the ports required by the Nexus Dashboard (ND) cluster nodes, the following ports are required by the Nexus Dashboard Fabric Controller (NDFC) service.
The following ports apply to the Nexus Dashboard management network and/or data network interfaces depending on which interface provides IP reachability from the NDFC service to the switches.
| Service | Port | Protocol | Direction | Connection |
|---|---|---|---|---|
|
SSH |
22 |
TCP |
Out |
SSH is a basic mechanism for accessing devices. |
|
SCP |
22 |
TCP |
Out |
SCP clients archiving NDFC backup files to remote server. |
|
SMTP |
25 |
TCP |
Out |
SMTP port is configurable through NDFC’s Server Settings menu. |
|
DHCP |
67 |
UDP |
In |
If NDFC local DHCP server is configured for Bootstrap/POAP purposes. |
|
DHCP |
68 |
UDP |
Out |
|
|
SNMP |
161 |
TCP/UDP |
Out |
SNMP traffic from NDFC to devices. |
|
HTTPS/HTTP (NX-API) |
443/80 |
TCP |
Out |
NX-API HTTPS/HTTP client connects to device NX-API server on port 443/80, which is also configurable. NX-API is an optional feature, used by limited set of NDFC functions. |
|
HTTPS (vCenter, Kubernetes, OpenStack, Discovery) |
443 |
TCP |
Out |
NDFC provides an integrated host and physical network topology view by correlating the information obtained from registered VMM domains, such as VMware vCenter or OpenStack, as well as container orchestrators, such as Kubernetes. |
The following ports apply to the External Service IPs, also known as persistent IPs, used by some of the NDFC services. These External Service IPs may come from the Nexus Dashboard management subnet pool or the data subnet pool depending on the configured settings.
| Service | Port | Protocol | Direction | Connection |
|---|---|---|---|---|
|
SCP |
22 |
TCP |
In |
SCP is used by various features to transfer files between devices and the NDFC service. The NDFC SCP service serves as the SCP server for both downloads and uploads. SCP is also used by the POAP client on the devices to download POAP-related files. |
|
TFTP (POAP) |
69 |
TCP |
In |
Only used for device zero-touch provisioning via POAP, where devices can send (limited jailed write-only access to NDFC) basic inventory information to NDFC to start secure POAP communication. NDFC Bootstrap or POAP can be configured for TFTP or HTTP/HTTPS. |
|
HTTP (POAP) |
80 |
TCP |
In |
Only used for device zero-touch provisioning via POAP, where devices can send (limited jailed write-only access to NDFC) basic inventory information to NDFC to start secure POAP communication. NDFC Bootstrap or POAP can be configured for TFTP or HTTP/HTTPS. |
|
BGP |
179 |
TCP |
In/Out |
For Endpoint Locator, per fabric where it is enabled, an EPL service is spawned with its own persistent IP. This service is always associated with the Nexus Dashboard data interface. NDFC EPL service peers with the appropriate BGP entity (typically BGP Route-Reflectors) on the fabric to get BGP updates needed to track endpoint information. |
|
HTTPS (POAP) |
443 |
TCP |
In |
Secure POAP is accomplished via the NDFC HTTPS Server on port 443. The HTTPS server is bound to the SCP-POAP service and uses the same persistent IP assigned to that pod. |
|
Syslog |
514 |
UDP |
In |
When NDFC is configured as a Syslog server, Syslogs from the devices are sent out toward the persistent IP associated with the SNMP-Trap/Syslog service pod |
|
SCP |
2022 |
TCP |
Out |
Transport tech-support file from persistent IP of NDFC POAP-SCP pod to a separate ND cluster running Nexus Dashboard Insights. |
|
SNMP Trap |
2162 |
UDP |
In |
SNMP traps from devices to NDFC are sent out toward the persistent IP associated with the SNMP-Trap/Syslog service pod. |
|
GRPC (Telemetry) |
33000 |
TCP |
In |
SAN Insights Telemetry Server which receives SAN data (such as storage, hosts, flows, and so on) over GRPC transport tied to NDFC Persistent IP. |
|
GRPC (Telemetry) |
50051 |
TCP |
In |
Information related to multicast flows for IP Fabric for Media deployments as well as PTP for general LAN deployments is streamed out via software telemetry to a persistent IP associated with a NDFC GRPC receiver service pod. |
Communication Ports: Nexus Dashboard Fabric Controller for SAN Deployments
Nexus Dashboard Fabric Controller can be deployed on a single-node or 3-node Nexus Dashboard cluster. The following ports are required for NDFC SAN deployments on single-node clusters.
| Service | Port | Protocol | Direction | Connection |
|---|---|---|---|---|
|
SSH |
22 |
TCP |
Out |
SSH is a basic mechanism for accessing devices. |
|
SCP |
22 |
TCP |
Out |
SCP clients archiving NDFC backup files to remote server. |
|
SMTP |
25 |
TCP |
Out |
SMTP port is configurable through NDFC’s Server Settings menu. |
|
SNMP |
161 |
TCP/UDP |
Out |
SNMP traffic from NDFC to devices. |
|
HTTPS (vCenter, Kubernetes, OpenStack, Discovery) |
443 |
TCP |
Out |
NDFC provides an integrated host and physical network topology view by correlating the information obtained from registered VMM domains, such as VMware vCenter or OpenStack, as well as container orchestrators, such as Kubernetes. |
The following ports apply to the External Service IPs, also known as Persistent IPs, used by some of the NDFC services. These External Service IPs may come from the Nexus Dashboard management subnet pool or the data subnet pool depending on the configured settings.
| Service | Port | Protocol | Direction | Connection |
|---|---|---|---|---|
|
SCP |
22 |
TCP |
In |
SCP is used by various features to transfer files between devices and the NDFC service. The NDFC SCP service functions for both downloads and uploads. |
|
Syslog |
514 |
UDP |
In |
When NDFC is configured as a Syslog server, syslogs from the devices are sent out towards the persistent IP associated with the SNMP-Trap/Syslog service pod. |
|
SNMP Trap |
2162 |
UDP |
In |
SNMP traps from devices to NDFC are sent out toward the persistent IP associated with the SNMP-Trap/Syslog service pod. |
|
GRPC (Telemetry) |
33000 |
TCP |
In |
SAN Insights Telemetry Server which receives SAN data (such as storage, hosts, flows, and so on) over GRPC transport tied to NDFC Persistent IP. |
Fabric Connectivity
You can connect the Nexus Dashboard cluster to your fabrics in two ways:
-
The Nexus Dashboard cluster connected to the fabric via a Layer 3 network.
-
The Nexus Dashboard nodes connected to the leaf switches as typical hosts.
For Cisco Cloud Network Controller fabrics, you will need to connect via a Layer 3 network.
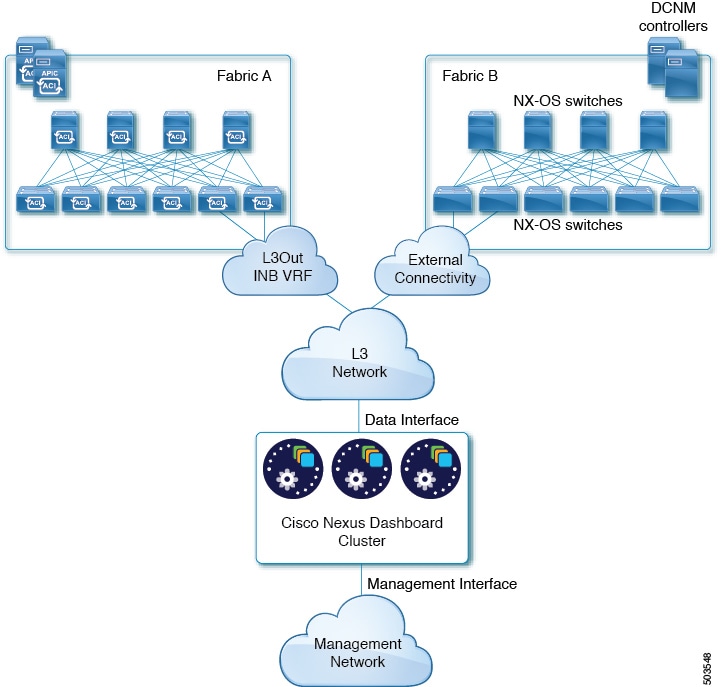
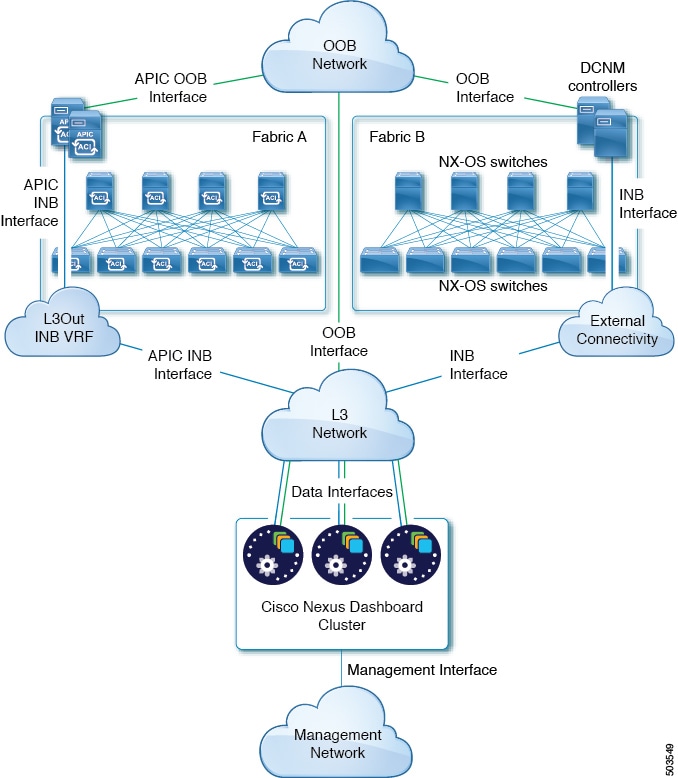
Connecting via External Layer 3 Network
We recommend connecting the Nexus Dashboard cluster to the fabrics via an external Layer 3 network as it does not tie the cluster to any one fabric and the same communication paths can be establish to all sites. Specific connectivity depends on the type of applications deployed in the Nexus Dashboard:
-
If you are deploying Nexus Dashboard Orchestrator to manage Cisco ACI fabrics only, you can establish connectivity from the data interface to either the in-band or out-of-band (OOB) interface of each site’s APIC or both.
-
If you are deploying Nexus Dashboard Orchestrator to manage Cisco NDFC fabrics, you must establish connectivity from the data interface to the in-band interface of each site’s NDFC.
-
If you are deploying Day-2 Operations applications, such as Nexus Dashboard Insights, you must establish connectivity from the data interface to the in-band network of each fabric and of the APIC.
If you plan to connect the cluster across an external Layer 3 network, keep the following in mind:
-
For ACI fabrics, you must configure an L3Out and the external EPG for Cisco Nexus Dashboard data network connectivity in the management tenant.
Configuring external connectivity in an ACI fabric is described in Cisco APIC Layer 3 Networking Configuration Guide.
-
For NDFC fabrics, if the data interface and NDFC’s in-band interface are in different subnets, you must add a route to the Nexus Dashboard’s data network on NDFC.
You can add the route from the NDFC UI by navigating to Administration > Customization > Network Preference > In-Band (eth2), then adding the route and saving.
-
If you specify a VLAN ID for your data interface during setup of the cluster, the host port must be configured as trunk allowing that VLAN.
However, in most common deployments, you can leave the VLAN ID empty and configure the host port in access mode.
The following two figures show two distinct network connectivity scenarios when connecting the Nexus Dashboard cluster to the fabrics via an external Layer 3 network. The primary purpose of each depends on the type of application you may be running in your Nexus Dashboard.
Connecting the Nodes Directly to Leaf Switches
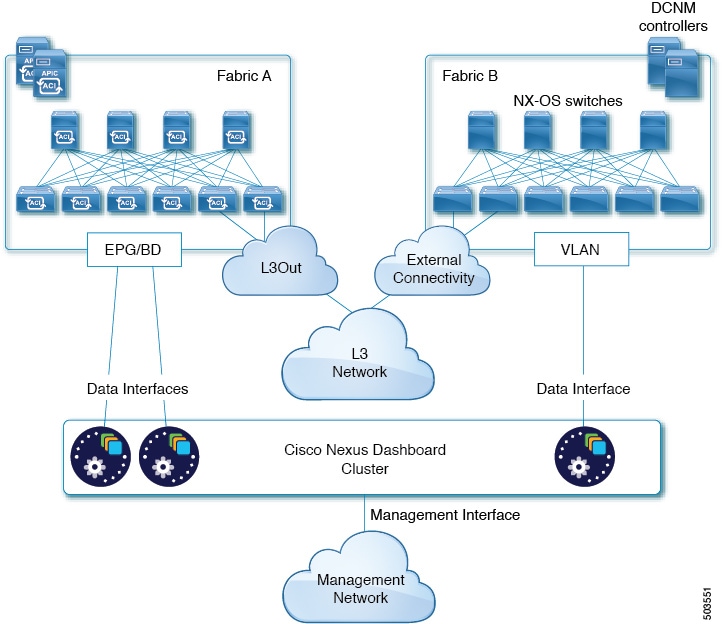
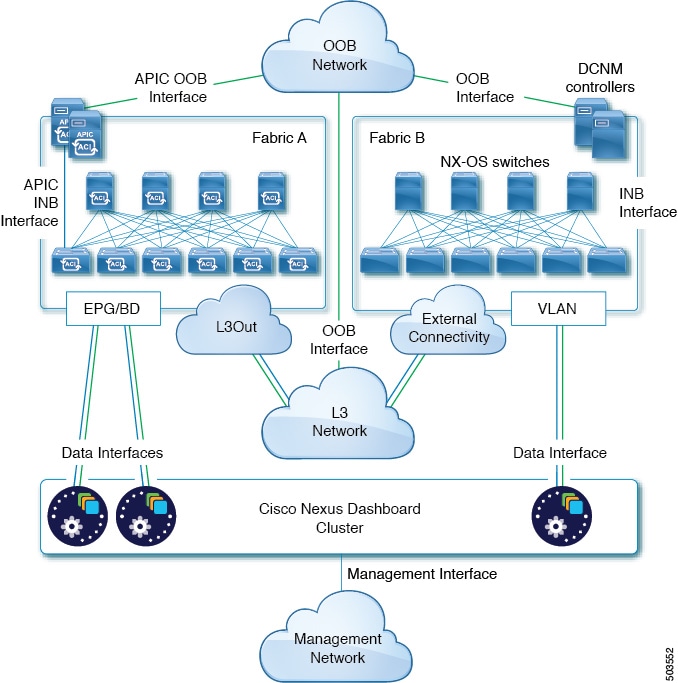
You can also connect the Nexus Dashboard cluster directly to one of the fabrics. This provides easy connectivity between the cluster and in-band management of the fabric, but ties the cluster to the specific fabric and requires reachability to other fabrics to be established through external connectivity. This also makes the cluster dependent on the specific fabric so issues within the fabric may impact Nexus Dashboard connectivity. Like in the previous example, connectivity depends on the type of applications deployed in the Nexus Dashboard:
-
If you are deploying Nexus Dashboard Orchestrator to manage Cisco ACI fabrics only, you can establish connectivity from the data interface to either the in-band or out-of-band (OOB) interface of each site’s APIC.
-
If you are deploying Nexus Dashboard Insights, you must establish connectivity from the data interface to the in-band interface of each fabric.
For ACI fabrics, the data interface IP subnet connects to an EPG/BD in the fabric and must have a contract established to the local in-band EPG in the management tenant. We recommend deploying the Nexus Dashboard in the management tenant and in-band VRF. Connectivity to other fabrics is established via an L3Out.
-
If you are deploying Nexus Dashboard Insights with ACI fabrics, the data interface IP address and the ACI fabric’s in-band IP address must be in different subnets.
If you plan to connect the cluster directly to the leaf switches, keep the following in mind:
-
If deploying in VMware ESX or Linux KVM, the host must be connected to the fabric via trunk port.
-
If you specify a VLAN ID for your data network during setup of the cluster, the Nexus Dashboard interface and the port on the connected network device must be configured as trunk
However, in most cases we recommend not assigning a VLAN to the data network, in which case you must configure the ports in access mode.
-
For ACI fabrics:
-
We recommend configuring the bridge domain (BD), subnet, and endpoint group (EPG) for Cisco Nexus Dashboard connectivity in management tenant.
Because the Nexus Dashboard requires connectivity to the in-band EPG in the in-band VRF, creating the EPG in the management tenant means no route leaking is required.
-
You must create a contract between the fabric’s in-band management EPG and Cisco Nexus Dashboard EPG.
-
-
If several fabrics are monitored with apps on the Services Engine cluster, L3Out with default route or specific route to other ACI fabric in-band EPG must be provisioned and a contract must be established between the cluster EPG and the L3Out’s external EPG.
The following two figures show two distinct network connectivity scenarios when connecting the Nexus Dashboard cluster directly to the fabrics' leaf switches. The primary purpose of each depends on the type of application you may be running in your Nexus Dashboard.
GUI Overview
Admin Console
After you have deployed the Nexus Dashboard cluster, you can perform all remaining actions using its GUI. To access Cisco Nexus Dashboard GUI, simply browse to any one of the nodes' management IP addresses:
https://<node-mgmt-ip>
Depending on the permissions of the user logged in to the Nexus Dashboard GUI, the UI will display only the objects and settings the user is allowed to access. The following sections describe all GUI elements as visible by an admin user. For more information on user configuration and permissions, see [Users].
Navigation Bar and User Preferences
As you navigate through the Nexus Dashboard UI and any installed services, the top of the screen will always display the common navigation bar:
-
Nexus Dashboard title will return you to the Nexus Dashboard’s Overview page from any page or service you are currently viewing.
-
Service Switcher dropdown allows you to navigate between the Nexus Dashboard Admin Console and any deployed services.
-
User icon contains a menu which allows you to log out, change the password for the currently logged in user, manage API keys, and configure one or more user-specific preferences:
-
Show Welcome Screen On Login toggles whether the new features screen is shown every time the current user logs in.
-
Time Zone Preference allows you to specify the time zone for the currently logged in user allowing multiple users across different geographical locations to more conveniently view any time-specific information in the UI.
When set to
Automatic, your local browser time zone is used. This is the default and the same behavior as in previous releases of Nexus Dashboard.When set to
Manual, you can pick the geographic location from the map and the closest time zone will be set according to that.The time zone conversion is done in the UI only, the backend and the APIs continue to return timestamps in the format in which they are saved, which is typically UTC.
This release supports the global time zone configuration for Nexus Dashboard and Insights service only, other services may continue to use automatic or internally configured time zone settings. The time zone setting for the Nexus Dashboard Insights service is absolute. In other words, if you have multiple sites across different geographical regions, all source time zones are mapped to the configured time zone.
-
-
Help menu provides access to the version information, new features in the current release, and the documentation for Nexus Dashboard as well as any services you have installed.
-
Notifications icon brings up a list of new notifications about cluster operation and health which may require your attention.
The Overview page of the admin console provides information about the current Nexus Dashboard cluster’s status, sites, services, and resources usage.
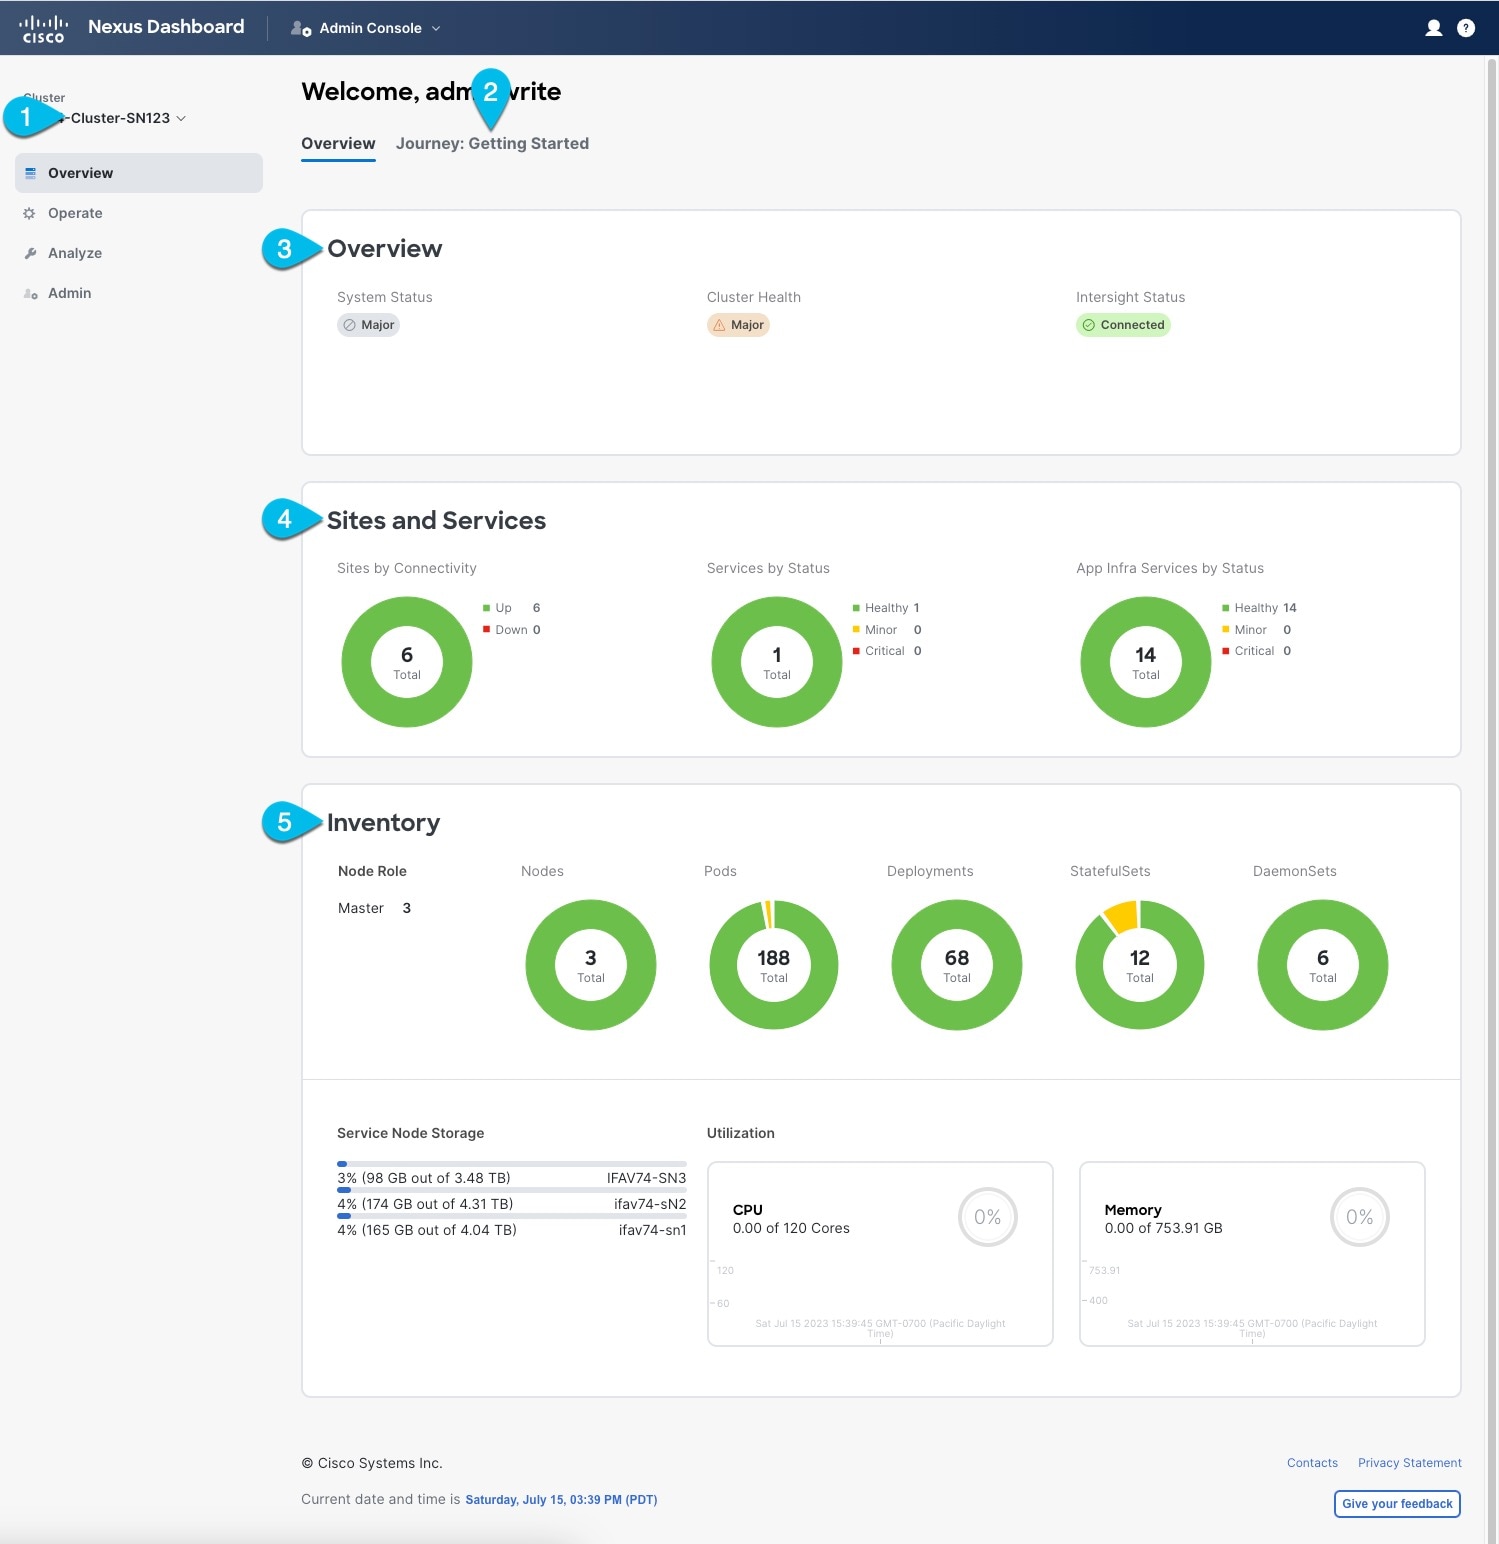
-
Current Cluster displays the name of the currently viewed cluster.
This is enabled for multi-cluster deployments only and allows you to quickly switch to another connected cluster. For more information about this feature, see [Multi-Cluster Connectivity].
-
Journey: Getting Started tab provides a step-by-step guidance to help you discover different Nexus Dashboard features and initial workflows.
-
Overview tile displays System Status, Cluster Health, and Cisco Intersight Status.
You can click on the Cluster Health or Intersight Status to view specific details about them.
-
Sites and Services tile displays the
Sitesby connectivity, as well asServicesandInfra Servicesby status.Connectivity indicates whether the sites are up (
Up) or down (Down).Status is displayed in number of services that are
healthy, haveminorfaults, or havecriticalfaults. -
Inventory tile provides details of the
nodes,pods,deployments, and other statistics about the currently selected cluster.
You can click different areas in the System Overview tab to open the corresponding GUI screens where you can see additional details or make configuration changes.
Operate > Sites Page
This page allows you to onboard sites from a single location and then use those sites from any service deployed in your cluster.
Any site that is already onboarded is listed on this page, including the following:
-
Health Score — current health status of the site as reported by the site’s controller.
-
Name — the name of the site as you provided it during onboarding.
-
Connectivity Status — indicates whether the site’s connectivity is establish (
Up) or not (Down). -
Firmware Version — the version of the controller software currently running in the site.
-
Services Used — list of services currently using the specific site.
For additional information on onboarding sites, see [Site Management].
Operate > Services Page
This page allows you to access and manage services in your Nexus Dashboard.
Any service that is already installed and enabled is listed under the Installed Services tab, while the App Store tab provides an easy way to deploy additional services directly from the Cisco’s Data Center App Center page.
For additional information on managing services, see [Services Management].
Operate > Nodes Page
This page provides information about all primary, worker, and standby nodes in your cluster along with their networking configuration and CPU/Memory utilization.
Analyze Pages
This category contains the following pages:
-
History and Logs — contains event history and audit logs from the platform and services.
-
Tech Support — allows an administrator to collect technical support information about the cluster and deployed services.
-
Resource Utilization — provides real-time information about the resource utilization of your Nexus Dashboard cluster.
Admin Pages
This category contains the following pages:
-
Software Management — allows you to perform cluster (firmware) upgrades.
-
Backup and Restore — allows you to back up or restore cluster configuration.
-
Authentication — allows you to configure remote authentication domains as described in [Remote Authentication].
-
Users — allows you to create and update local Nexus Dashboard users as described in [Users] or view the users configured on any remote authentication servers you added to the Nexus Dashboard.
-
Security — allows you to view and edit the security configurations, such keys and certificates.
-
System Settings — provides cluster details (such as name, app subnet, and service subnet), allows you to configure cluster-wide settings (such as DNS and NTP servers, persistent IP addresses, and routes), and displays any current issues in the cluster.
-
Intersight — provides access to Cisco Intersight device connector configuration.
-
App Infra Services — provides information about the infra services running on your Nexus Dashboard and allows you to restart individual microservices if needed.
Trademarks
THE SPECIFICATIONS AND INFORMATION REGARDING THE PRODUCTS IN THIS MANUAL ARE SUBJECT TO CHANGE WITHOUT NOTICE. ALL STATEMENTS, INFORMATION, AND RECOMMENDATIONS IN THIS MANUAL ARE BELIEVED TO BE ACCURATE BUT ARE PRESENTED WITHOUT WARRANTY OF ANY KIND, EXPRESS OR IMPLIED. USERS MUST TAKE FULL RESPONSIBILITY FOR THEIR APPLICATION OF ANY PRODUCTS.
THE SOFTWARE LICENSE AND LIMITED WARRANTY FOR THE ACCOMPANYING PRODUCT ARE SET FORTH IN THE INFORMATION PACKET THAT SHIPPED WITH THE PRODUCT AND ARE INCORPORATED HEREIN BY THIS REFERENCE. IF YOU ARE UNABLE TO LOCATE THE SOFTWARE LICENSE OR LIMITED WARRANTY, CONTACT YOUR CISCO REPRESENTATIVE FOR A COPY.
The Cisco implementation of TCP header compression is an adaptation of a program developed by the University of California, Berkeley (UCB) as part of UCB’s public domain version of the UNIX operating system. All rights reserved. Copyright © 1981, Regents of the University of California.
NOTWITHSTANDING ANY OTHER WARRANTY HEREIN, ALL DOCUMENT FILES AND SOFTWARE OF THESE SUPPLIERS ARE PROVIDED “AS IS" WITH ALL FAULTS. CISCO AND THE ABOVE-NAMED SUPPLIERS DISCLAIM ALL WARRANTIES, EXPRESSED OR IMPLIED, INCLUDING, WITHOUT LIMITATION, THOSE OF MERCHANTABILITY, FITNESS FOR A PARTICULAR PURPOSE AND NONINFRINGEMENT OR ARISING FROM A COURSE OF DEALING, USAGE, OR TRADE PRACTICE.
IN NO EVENT SHALL CISCO OR ITS SUPPLIERS BE LIABLE FOR ANY INDIRECT, SPECIAL, CONSEQUENTIAL, OR INCIDENTAL DAMAGES, INCLUDING, WITHOUT LIMITATION, LOST PROFITS OR LOSS OR DAMAGE TO DATA ARISING OUT OF THE USE OR INABILITY TO USE THIS MANUAL, EVEN IF CISCO OR ITS SUPPLIERS HAVE BEEN ADVISED OF THE POSSIBILITY OF SUCH DAMAGES.
Any Internet Protocol (IP) addresses and phone numbers used in this document are not intended to be actual addresses and phone numbers. Any examples, command display output, network topology diagrams, and other figures included in the document are shown for illustrative purposes only. Any use of actual IP addresses or phone numbers in illustrative content is unintentional and coincidental.
Cisco and the Cisco logo are trademarks or registered trademarks of Cisco and/or its affiliates in the U.S. and other countries. To view a list of Cisco trademarks, go to this URL: http://www.cisco.com/go/trademarks. Third-party trademarks mentioned are the property of their respective owners. The use of the word partner does not imply a partnership relationship between Cisco and any other company. (1110R)
© 2017-2023 Cisco Systems, Inc. All rights reserved.
First Published: 2023-01-31
Last Modified: 2023-04-11
Americas Headquarters
Cisco Systems, Inc.
170 West Tasman Drive
San Jose, CA 95134-1706
USA
http://www.cisco.com
Tel: 408 526-4000
800 553-NETS (6387)
Fax: 408 527-0883