Each Cisco switch streams telemetry events from the fabric to an external service that analyzes the events and proactively
detects issues in the fabric behavior. Use the dashboards in the Cisco NIR app to view relevant information and select specific items to view details.
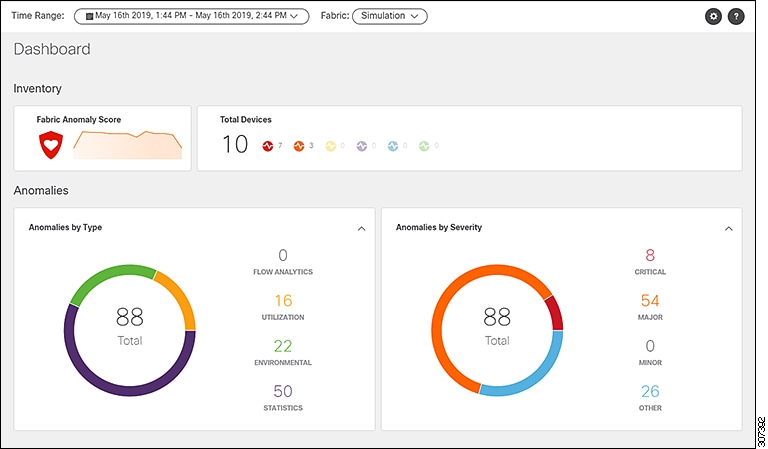
Main Dashboard
The Cisco Network Insights for
Resources (Cisco NIR) application main dashboard provides immediate access to anomalies occurring in the network. Anomalies are learned deviations
from the last known "good" state of a switch and are displayed by type and severity. Anomalies include resource utilization,
environmental, and interface-level errors, and are color coded based on severity: Critical: Red, Major: Orange, Minor: Yellow,
Warning: Green, Information: Blue.
Some factors that contribute to the presence of an anomalies are exceeded thresholds and excessive rates of change.
Inventory
| Property |
Description |
|
Fabric Anomaly Score
|
Displays the health of the fabric through color.
|
|
Total Devices
|
Displays the top number of devices with anomalies. The types are Leaf or Spine.
|
Anomalies
Click on any number to access the Browse Anomalies work pane.
| Property |
Description |
|
Anomalies by Type
|
Displays the number of Anomalies by their type.
|
|
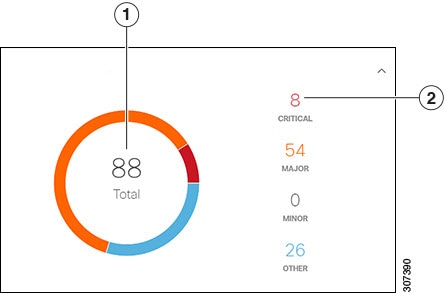
Anomalies by Severity
|
Displays the number of Anomalies (internal Fabric failures) and their severity level. Clicking on the area shows detail fault
information, such as Node and Anomaly Score.
|
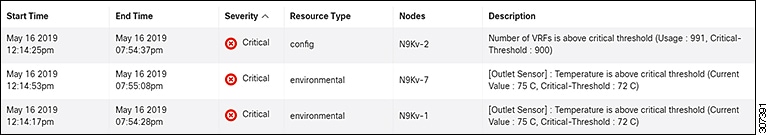
Browse Anomalies
View, sort, and filter anomalies through the Browse Anomalies work pane.
Filters
You can refine the displayed anomalies by the following filters:
-
Start Time - display only anomalies with a specific start time.
-
End Time - display only anomalies with a specific end time.
-
Description -
-
Node - display only anomalies for specific nodes.
-
Category - display only anomalies from a specific categary.
-
Resource Type - display only anomalies of a specific resource type.
-
Severity - display only anomalies of a specific severity.
As a secondary filter refinement, use the following operators:
-
= = - with the initial filter type, this operator, and a subsequent value, returns an exact match.
-
!= - with the initial filter type, this operator, and a subsequent value, returns all that do not have the same value.
-
contains - with the initial filter type, this operator, and a subsequent value, returns all that contain the value.
-
!contains - with the initial filter type, this operator, and a subsequent value, returns all that do not contain the value.
| Property |
Description |
|
Start Time
|
The start time stamp for the anomaly detection.
|
|
End Time
|
The end time stamp for the anomaly detection.
|
|
Severity
|
The current severity level of the event. The levels are:
-
Critical—A service-affecting condition that requires immediate corrective action. For example, this severity could indicate that the
managed object is out of service and its capability must be restored.
-
Major—Serious problems exist with one or more components. These issues should be researched and fixed immediately.
-
Minor—Problems exist with one or more components that might adversely affect system performance. These issues should be researched
and fixed as soon as possible before they become a critical problem.
-
Other—Potential problems exist with one or more components that might adversely affect system performance if they are allowed to
continue. These issues should be researched and fixed as soon as possible before they become a critical problem.
|
|
Resource Type
|
The resource type such as Flow, configuration, or operational.
|
|
Nodes
|
The node where the anomaly occurred.
|
|
Description
|
Additional information about the anomaly.
|
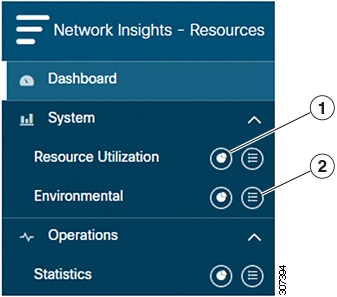
System
The System section of the NIR application contains two areas of data collection:
Resource Utilization Dashboard
The Resource Utilization dashboard displays utilization, rate of change, trends, and resource anomalies over time for operational,
configuration and hardware resources. Top leaf and spine nodes are displayed based on the factors that produced the high utilization.
| Property |
Description |
|
Top Nodes by Capacity
|
The leaf node observations search can be more refined by filtering the information by the top leaf nodes.
|
|
Node Details
|
Displays the node trend observations by resource type:
-
Operational Resources
-
Configuration Resources
-
Hardware Resources
|
Browse Resource Utilization
View, sort, and filter statistics through the Browse Resource Utilization work pane.
Filters
You can refine the displayed statistics by the following filters:
As a secondary filter refinement, use the following operators:
-
= = - with the initial filter type, this operator, and a subsequent value, returns an exact match.
-
!= - with the initial filter type, this operator, and a subsequent value, returns all that do not have the same value.
-
contains - with the initial filter type, this operator, and a subsequent value, returns all that contain the value.
-
!contains - with the initial filter type, this operator, and a subsequent value, returns all that do not contain the value.
| Property |
Description |
|
Top Nodes by
|
Displays the top nodes by:
-
MAC
-
IPv4 Host Routes
-
IPv6 Host Routes
-
IPv4 Prefix Routes
-
IPv6 Prefix Routes
-
Multicast Routes
-
VLAN
-
VRF
-
Port Usage
-
Ingress Port Bandwidth
-
Egress Port Bandwidth
-
CoPP
-
LPM
-
HRT
-
L2 QoS TCAM
-
L3 QoS TCAM
-
VTEP
-
VNI L2
-
VNI L3
-
VLAN
-
Ingress VLAN ACL
-
Egress VLAN ACL
-
Ingress Port ACL
-
Ingress Routed ACL
-
Egress Routed ACL
|
|
Operational Resources
|
Displays a list of operational resources based on anomaly score. List information includes:
-
Anomaly Score
-
Node
-
MAC
-
IPv4 Host Routes
-
IPv6 Host Routes
-
IPv4 Prefix Routes
-
IPv6 Prefix Routes
-
Multicast Routes
|
|
Configuration Resources
|
Displays a list of configuration resources based on anomaly score. List information includes:
-
Anomaly Score
-
Node
-
VLAN
-
VTEP
-
VNI
-
VRF
|
|
Hardware Resources
|
Displays a list of configuration resources based on anomaly score. List information includes:
-
Anomaly Score
-
Node
-
Port Usage
-
Port Bandwidth
-
CoPP
-
LPM
-
HRT
-
QoS TCAM
-
VLAN ACL
-
Port ACL
-
Routed ACL
|
Environmental Dashboard
The Environmental Dashboard displays utilization, rate of change, trends, and anomalies over time for switch environmental
resources such as fans, power, CPU, and memory.
| Property |
Description |
|
Top Nodes by Utilization
|
Displays the percentage utilized per component:
-
CPU
-
Memory
-
Temperature
-
Fan Utilization
-
Power Supply
-
Storage
|
|
Node Details
|
Displays the node trend observations by environmental resource type:
|
Browse Environmental Resources
View, sort, and filter statistics through the Browse Environmental Resources work pane.
Filters
You can refine the displayed statistics by the following filters:
As a secondary filter refinement, use the following operators:
-
= = - with the initial filter type, this operator, and a subsequent value, returns an exact match.
-
!= - with the initial filter type, this operator, and a subsequent value, returns all that do not have the same value.
-
contains - with the initial filter type, this operator, and a subsequent value, returns all that contain the value.
-
!contains - with the initial filter type, this operator, and a subsequent value, returns all that do not contain the value.
| Property |
Description |
|
Top Nodes by
|
Displays the top nodes by:
|
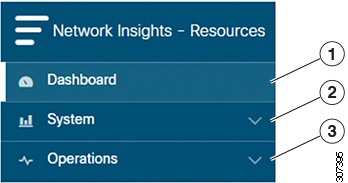
Operations
The Operations section of the NIR application contains statistic information.
Statistics Dashboard
The Statistics Dashboard displays top switch nodes by interface errors or usage, and protocol statistics.
| Property |
Description |
|
Top Nodes by Interface Utilization
|
Displays the top nodes based on the combined bandwidth utilization of it's interfaces.
|
|
Top Nodes by Interfaces
|
Displays the top nodes and lists the transmit and receive bandwidth utilization of each of it's interfaces.
|
Browse Statistics
View, sort, and filter statistics through the Browse Statistics work pane.
Filters
You can refine the displayed statistics by the following filters:
-
Node - display only nodes.
-
Interface - display only interfaces.
-
Protocol - display only protocols.
As a secondary filter refinement, use the following operators:
-
= = - with the initial filter type, this operator, and a subsequent value, returns an exact match.
-
!= - with the initial filter type, this operator, and a subsequent value, returns all that do not have the same value.
-
contains - with the initial filter type, this operator, and a subsequent value, returns all that contain the value.
-
!contains - with the initial filter type, this operator, and a subsequent value, returns all that do not contain the value.
| Property |
Description |
|
Top 10 Interfaces by
|
Displays the top interfaces by:
-
Transmit Utilization
-
Receive Utilization
-
Error
|
|
Interface Statistics
|
Displays a list of interface statistics based on anomaly score. List information includes:
-
Anomaly Score
-
Interface
-
Node
-
Receive Utilization
-
Transmit Utilization
-
Errors
|
|
Protocol Statistics
|
Displays a list of protocol statistics based on anomaly score. List information includes:
-
Node
-
Protocol
-
Number of Interfaces
-
Errors
|

Note |
In order for the Cisco NIR app to receive data from the switches, confirm that all the devices in the fabric are synced.
|


 Feedback