Each Cisco Application Centric Infrastructure (Cisco ACI) switch known to the Cisco NIA application is analyzed to help be more proactive about issues and anomalies in the network. Use the dashboard in the Cisco NIA application to view relevant information and select specific items to view details.
Main Dashboard
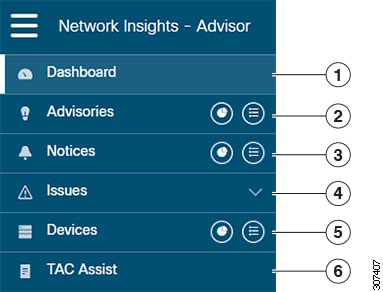
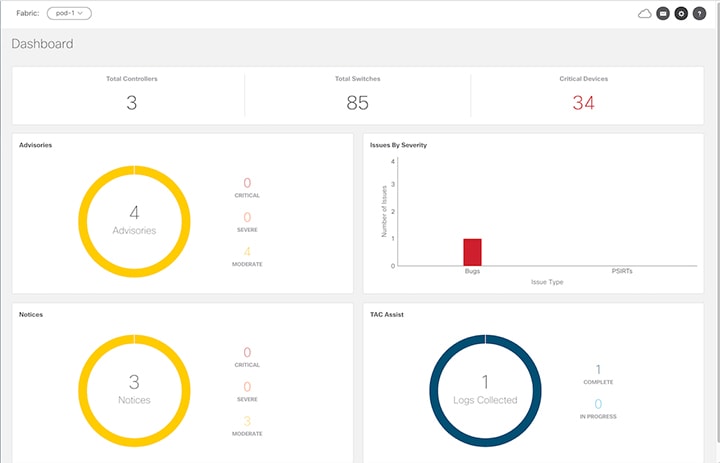
The Cisco NIA application main dashboard provides immediate access to a high-level view of the advisories, notices, issues and TAC Assist
logs applicable to your network.
| Property |
Description |
|
Total Controllers
|
Displays the total number of controllers in your network.
|
|
Total Switches
|
Displays the total number of switches in your network.
|
|
[ Critical | Moderate | Healthy ] Devices
|
Displays the total number of devices determined to be in one of the following categories:
-
Critical Devices
-
Moderate Devices
-
Healthy Devices
Device counts in the higher category (Critical is highest) appear in the displayed count. If no devices are currently in the
Critical category, then the device count of the Moderate category is displayed. If no issues are detected in any device, then
the device count of the Healthy category is displayed.
|
|
Advisories
|
Displays the total number of advisories delivered for software and hardware in your network.
|
|
Issues By Severity
|
Displays the total number of issues (anomalies, bugs, and PSIRTs) delivered for software and hardware in your network.
|
|
Notices
|
Displays the total number of notices delivered for devices in your network.
|
|
TAC Assist
|
Displays the total number of TAC assist logs currently being collected or finished being collected.
|
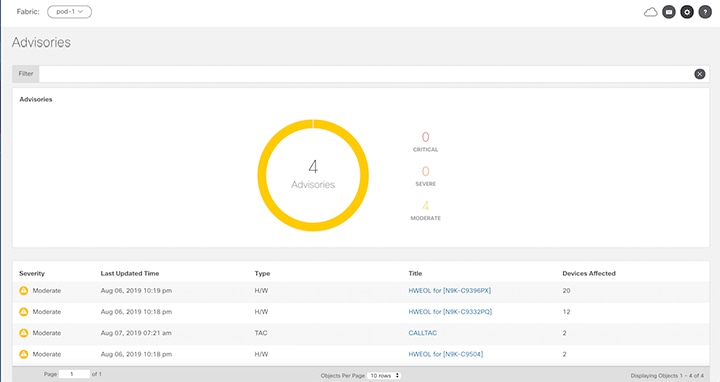
Advisories
Advisories Dashboard
The Advisories dashboard displays three levels of advisory severity for switch hardware and software in your network. It categorizes
by severity and identifies software versions and hardware platforms to which the advisories apply.
Advisories are delivered based on the detection of relevant field notices, PSIRTs, bugs, software, hardware, and hardening
violations. Cisco NIA considers this information and recommends:
-
Software or hardware upgrades to address bugs, PSIRTs, and field notices
-
Contacting the Technical Assistance Center (TAC)
| Property |
Description |
|
Critical Advisories
|
Displays the number of critical advisories that are applicable to devices in your network.
|
|
Severe Advisories
|
Displays the number of severe advisories that are applicable to devices in your network.
|
|
Moderate Advisories
|
Displays the number of moderate advisories that are applicable to devices in your network.
|
|
Advisory Type by Devices
|
Displays the advisory types and the number of affected devices in your network for each.
|
|
Advisories Affecting (Version, Platforms)
|
Displays the number of advisories affecting software versions or hardware platforms.
|
Browse Advisories
View, sort, and filter advisories through the Browse Advisories work pane.
Filters
You can refine the displayed advisory information by using the following filters:
-
Operators - display advisories using an operator. Valid operators are:
-
Severity - display advisories only for a specific severity. Valid severities are:
-
Critical - Returns matches for critical advisories.
-
Severe - Returns matches for severe advisories.
-
Moderate - Returns matches for moderate advisories.
-
Type - display advisories only for a specific type. Valid types are:
-
S/W Ver. - Returns matches for advisories for a specific software version. This filter must be followed by a valid software
version.
-
Field Notice - Returns matches for advisories for a specific field notice.
-
H/W - Returns matches for advisories for a specific hardware version. This filter must be followed by a valid hardware version.
-
TAC - Returns matches for CALL TAC advisories.
| Property |
Description |
|
Advisories Chart
|
Displays the advisory chart for all advisories or only for the filtered severity or type.
|
|
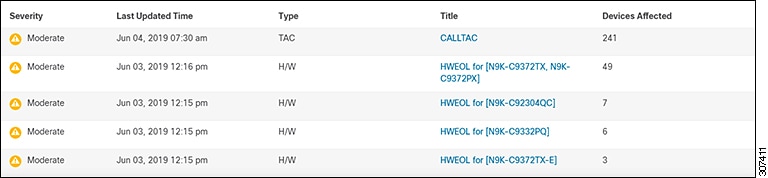
Advisories List
|
Displays a list of all advisories or only for the filtered severity or type. Column labels are:
|
Notices
Notices Dashboard
The Notices dashboard displays field notices such as end-of-life notices for specific switch hardware and software in your
network. It categorizes notices by severity and identifies software versions and hardware platforms to which the notices apply.
| Property |
Description |
|
Critical Notices
|
Displays the number of critical notices that are applicable to devices in your network.
|
|
Severe Notices
|
Displays the number of severe notices that are applicable to devices in your network.
|
|
Moderate Notices
|
Displays the number of moderate notices that are applicable to devices in your network.
|
|
Notices Chart (by notice type)
|
Displays the notice types and the number of affected devices in your network for each.
|
|
Notices Affecting (Versions, Platforms)
|
Displays the number of notices affecting software versions or hardware platforms.
|
Browse Notices
View, sort, and filter notices through the Browse Notices work pane.
Filters
You can refine the displayed notice information by using the following filters:
-
Operators - display notices using an operator. Valid operators are:
-
Severity - display notices only for a specific severity. Valid severity's are:
-
Critical - Returns matches for critical notices.
-
Severe - Returns matches for severe notices.
-
Moderate - Returns matches for moderate notices.
-
Type - display notices only for a specific type. Valid types are:
-
S/W Ver. - Returns matches for notices for a specific software version. This filter must be followed by a valid software version.
-
Field Notice - Returns matches for notices for a specific field notice.
-
PSIRT - Returns matches for notices for a specific PSIRT.
-
EOL H/W - Returns matches for notices for a specific hardware end-of-life.
-
EOL S/W - Returns matches for notices for a specific software end-of-life.
| Property |
Description |
|
Notices Chart
|
Displays the notice chart for all noitces or only for the filtered severity or type.
|
|
Notices List
|
Displays a list of all notices or only for the filtered severity or type. Click the link in the Title column to view details about the notice.
|
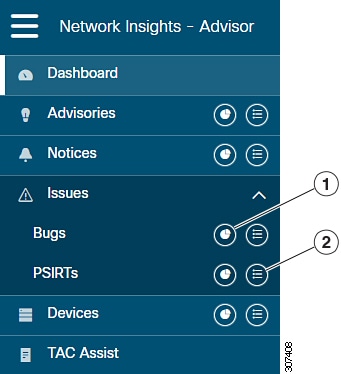
Issues
Issues is divided into these components:
Bugs Dashboard
The Bugs dashboard displays three levels of known bug severity for switch hardware and software in your network. It categorizes
by severity and identifies software versions and hardware platforms to which the bugs apply.
| Property |
Description |
|
Critical Bugs
|
Displays the number of critical bugs that are applicable to devices in your network.
|
|
Severe Bugs
|
Displays the number of severe bugs that are applicable to devices in your network.
|
|
Moderate Bugs
|
Displays the number of moderate bugs that are applicable to devices in your network.
|
|
Bug Severity by Devices (chart)
|
Displays the bug types and the number of affected devices in your network for each.
|
|
Bugs Affecting (Versions, Platforms)
|
Displays the number of bugs affecting software versions or hardware platforms.
|
Browse Bugs
View, sort, and filter bugs through the Browse Bugs work pane.
Filters
You can refine the displayed bug information by using the following filters:
| Property |
Description |
|
Bugs Chart
|
Displays the bug chart for all bugs or only for the filtered severity.
|
|
Bugs List
|
Displays a list of all bugs or only for the filtered severity.
|
PSIRTs Dashboard
The PSIRTs dashboard displays three levels of known PSIRT severity for switch hardware and software in your network. It categorizes
by severity and identifies software versions and hardware platforms to which the PSIRTs apply.
| Property |
Description |
|
Critical PSIRTs
|
Displays the number of critical PSIRTs that are applicable to devices in your network.
|
|
Severe PSIRTs
|
Displays the number of severe PSIRTs that are applicable to devices in your network.
|
|
Moderate PSIRTs
|
Displays the number of moderate PSIRTs that are applicable to devices in your network.
|
|
PSIRT Severity by Devices (chart)
|
Displays the PSIRT types and the number of affected devices in your network for each.
|
|
PSIRTs Affecting (Versions, Platforms)
|
Displays the number of PSIRTs affecting software versions or hardware platforms.
|
Browse PSIRTs
View, sort, and filter PSIRTs through the Browse PSIRTs work pane.
Filters
You can refine the displayed PSIRT information by using the following filters:
| Property |
Description |
|
PSIRTs Chart
|
Displays the PSIRT chart for all PSIRTs or only for the filtered severity.
|
|
PSIRTs List
|
Displays a list of all PSIRTs or only for the filtered severity.
|
Devices
Devices Dashboard
The Devices dashboard displays issues affecting devices in your network. It also identifies devices by software versions and
hardware platforms.
| Property |
Description |
|
Device Issues
|
Displays the number of devices that are past the End of Maintenance date for hardware and software. This also shows the number of devices currently running a version of software that is different
from the Cisco recommended version. Click Recommended Version Info link for more details.
|
|
Device by (chart)
|
Display different versions of software and type of platforms detected.
|
|
Top Devices by Maintenance Score
|
Displays the top six devices in critical order based on the maintenance score. The maintenance score is derived from notices
and issues seen for each device according to criteria in the table below.
Click on any device in this category to reveal additional details.
|
Maintenance Score
The following table identifies the criteria used to calculate the maintenance score displayed in the Devices dashboard and
Browse Devices table.
|
Issue
|
 Critical (Red) Critical (Red)
|
 Severe/Moderate/Low (Amber) Severe/Moderate/Low (Amber)
|
 None (Green) None (Green)
|
|
End of Maintenance Support
|
Less than 365 days to the end of support date
|
Between 365 days and 730 days to the end of support date
|
Greater than 730 days to the end of support date
|
|
Bugs
|
Any severity 1 and/or severity 2 bugs
|
Other than severity 1 or severity 2 bugs
|
No (0) bugs
|
|
Field Notices
|
Any applicable field notice
|
N/A
|
No applicable field notices
|
|
PSIRTs
|
Any severity 1 and/or severity 2 PSIRTs
|
Other than severity 1 or severity 2 PSIRTs
|
No (0) PSIRTs
|
New Device: This indicates that the device is new and no jobs have run for it.
Browse Devices
View, sort, and filter devices through the Browse Devices work pane.
Filters
You can refine the displayed device information by using the following filters:
-
Operators - display devices using an operator. Valid operators are:
-
= = - display devices with an exact match.
-
contains - display device names or platform identifiers containing entered text or symbols. This operator must be followed
by text and/or symbols.
-
!= - display devices that are not equal to the entered text or symbols. This operator must be followed by text and/or symbols.
-
Platform - display devices that are a specific type defined by the platform ID.
-
Device Name - display devices that are specifically named.
-
Version - displays devices based on the software version running on them.
| Property |
Description |
|
Devices Chart
|
Displays the Devices chart for all devices or only for the filtered device name or platform product ID.
|
|
Devices List
|
Displays a list of all devices or only for the filtered device name or platform product ID.
Click a name in the Device Name field to display the details for that device.
|
TAC Assist
TAC Assist Dashboard
The TAC Assist dashboard allows you to collect logs for devices in your network. These logs can be attached to Service Requests
(SRs) for further analysis.
-
Click Begin to initiate the log collection process.
The Collect Logs dialog appears.
-
To display specific devices in the list, use the filter utility:
-
Operators - display devices using an operator. Valid operators are:
-
= = - display devices with an exact match. This operator must be followed by text and/or symbols that are the exact software
version, product ID, device name, or assigned IP address of the device.
-
contains - display device names or platform identifiers containing entered text or symbols. This operator must be followed
by text and/or symbols.
-
Version - display devices that are running a specific software version.
-
Platform - display devices that are a specific type defined by the platform ID.
-
Device Name - display devices that are specifically named.
-
IP Address - display devices that are assigned a specific IP address.
-
Place a check in the checkbox next to the device for which you wan to collect logs. If you want to choose all of the devices
in the list, place a check in the checkbox next to the Device Name column title.
-
Click Collect Logs.
A TAC Assist job message appears on the TAC Assist dashboard. Once the logs are collected, Cisco NIA displays the location where they can be accessed on the Cisco APIC. TAC Assist is allowed for completed bug scan jobs and as long as logs are available in the storage.
You can go to the Completed Jobs section, click Devices and click Collect Logs. In the Cisco APIC, you can click TAC Assist Result for all the nodes and click to download the logs locally.

 and choose


 Feedback