Introduction
This guide explains the Cisco SD-Access client onboarding process and how to confirm the correct registration and forwarding.
The Cisco SD-Access solution is made up of an underlay and an overlay network. The underlay is defined by the physical switches and routers used to deploy the Cisco SD-Access network. All nodes in the underlay network must establish IP connectivity via the use of routing protocols. Any routing protocol can be used. However, if the underlay is deployed by Catalyst Center via LAN automation, IS-IS is the deployed protocol.
After IP communication is established and working in the underlay, it can be leveraged to create the virtualized network in the overlay. The overlay implements virtualization by encapsulating user traffic. Multiple overlay networks can run on a single underlay network and maintain network separation through the use of VRFs.
Cisco SD-Access Fabric Components
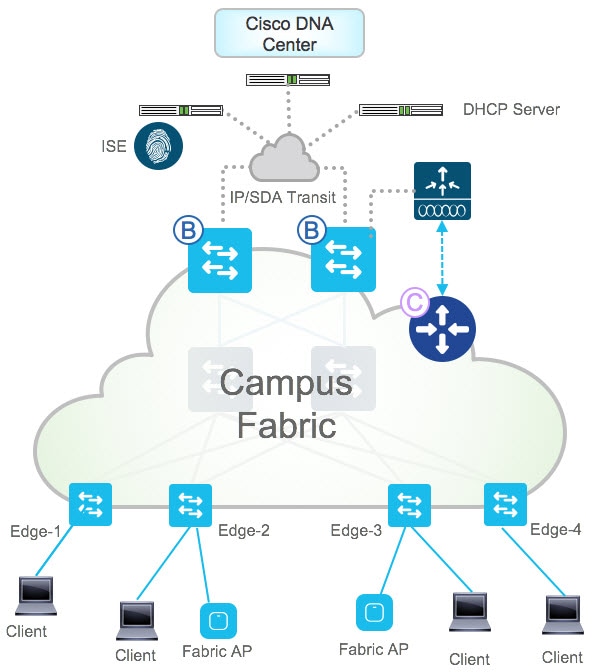
There are many components that make up the Catalyst Center solution, including Catalyst Center, Cisco ISE, and various router/switch roles. The following diagram shows the typical solution components.
-
Control plane node: The control plane node is based on the LISP Map-Server and Map-Resolver functionality. This node tracks all endpoints in the fabric and associates them to a fabric edge node's routing locator (RLOC).
-
Edge node: The edge nodes are the access-layer switches where all of the endpoints reside. The fabric edge nodes detect clients and register them with the control plane nodes.
-
Border node: The border nodes serve as the gateways between the Cisco SD-Access fabric and external networks.
-
Wireless LAN Controller (WLC): The wireless LAN controller integrates with the control plane node to manage wireless users and access points (APs).
-
Fabric APs: Fabric APs support the same functionality as traditional APs.
-
Cisco Identity Services Engine: Cisco ISE is used for policy implementation and mapping of clients to secure group tags (SGTs).
-
Catalyst Center: Catalyst Center is the heart of the automation and management of the Cisco SD-Access solution. Catalyst Center is responsible for design, provisioning, policy application, and overall creation of the Cisco SD-Access solution. Catalyst Center also enables proactive monitoring and insights into the network via network assurance.
This guide assumes that you are familiar with the following topics:
-
Catalyst Center fabric provisioning
-
Cisco ISE and Cisco TrustSec
-
Wireless controller and AP debugging
For information about the overall solution, see the Cisco Software-Defined Access Solution Design Guide.
Sample Lab Topology
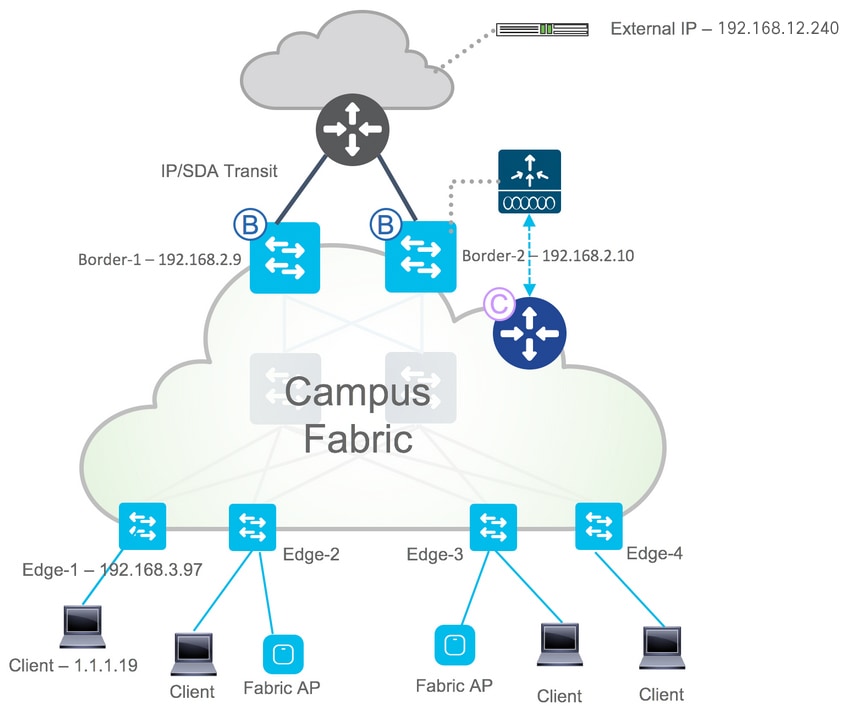
The examples shown throughout this guide are based on the following sample lab topology.
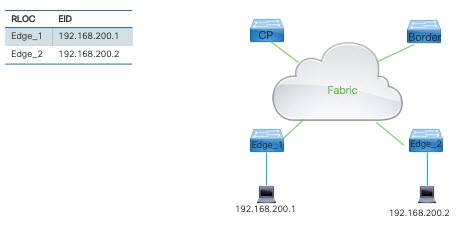
The command output shown throughout this guide is based on the preceding topology and on the command input shown in the following table.
|
Component |
Command Input Value |
|---|---|
|
Control plane |
CP |
|
Fabric edges |
Edge_1 Edge_2 |
|
VRF/VN |
BruEsc |
|
Layer 3 Lisp ID |
4099 |
|
Layer 2 Lisp ID |
8198 |
|
VLAN |
1030 |
Terminology
Across Catalyst Center, switches, and LISP, we use different terms for similar technologies. The following table shows the terminology mapping across all three technologies.
|
Catalyst Center |
Switch Side |
LISP |
|---|---|---|
|
Virtual network (VN) |
VRF |
Instance ID |
|
Underlay network |
Global routing table |
Global routing table |
|
IP pool |
VLAN/SVI with IP subnet |
EID space |
|
Default gateway of pool |
Anycast IP address |
— |
|
Scalable groups |
Secure group tag |
Policy label in VXLAN |
|
Policy contract |
SGACL |
— |
Debugging Workflow
In Cisco SD-Access, there are various steps involved when debugging an issue. Before debugging, it is assumed that major devices or nodes—such as border nodes, control nodes, edge nodes, and Cisco ISE—are already configured in Catalyst Center, and basic underlay/overlay routing is enabled. If multicast is planned, the multicast configuration must be complete. After the Catalyst Center configuration is applied, user and endpoint devices can be onboarded.
The following types of clients connect to SDA networks:
-
Access point: Uses the VN Infra_VN
-
Wired client: Uses a user-defined VN
-
Wireless client: Uses a user-defined VN
The process of wired client/endpoint host onboarding is divided into various sections:
-
Host registration/host resolution
-
Within SDA fabric traffic flow (east-west traffic flow)
-
External connectivity (north-south traffic flow)
-
Host mobility
-
Policy/SGT/SGACL
Before debugging, capture the following basic information:
-
Check whether the host or client is a PoE device that requires power for startup. If the device requires PoE, confirm that it powers up.
-
Check the authentication method selected for the client interface port on the switch and select the appropriate debugging path.
-
If Dot1x/MAB is configured, confirm access to Cisco ISE (which is required to debug or check the status).
-
Check whether the SGT or Dynamic VLAN method is used.
Registration for a Wired Client
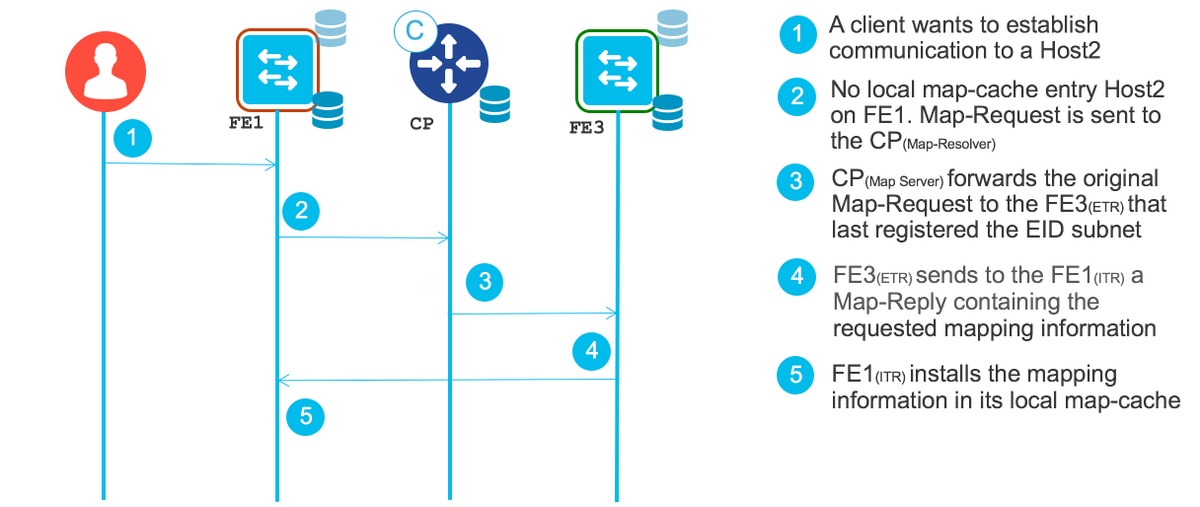
The following diagram explains the client/host registration process. This example does not use Dot1x authentication. If your deployment uses Open, Closed, or Easy Dot1x authentication, there are additional debugging workflows that include Cisco ISE and AAA authentication checks.
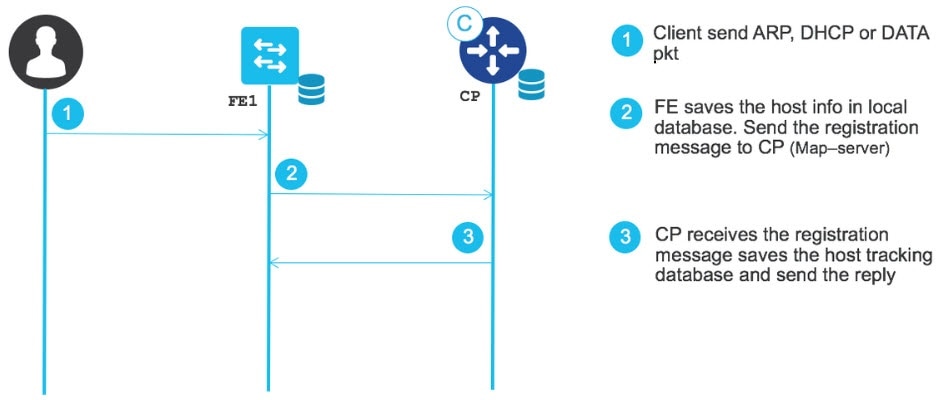
As shown in the preceding diagram, the client connects to the switch. After the client connects to the switch, it sends packets (such as ARP, a DHCP request, or any other data packet). After the switch receives the packets, it starts getting information such as the MAC address of the client, the type of packet, and so on. The packet information is used to program the MAC table, ARP table, device tracking (SISF) table, and software and hardware information. You can verify this information by using the following commands.
Procedure
|
Step 1 |
On the edge node, confirm that the fabric edge has learned the MAC of its local client. Enter the following command to show the MAC address table: Local clients are learned dynamically on the local switch's physical port. Remote hosts are CP_LEARN over the LISP tunnel interface. If there is no MAC entry for the local client, the host might be a silent host. Investigate using the packet captures on the ingress interface to confirm whether the client is sending traffic. If a remote client is not seen, connect to the fabric edge and progress through the same debugging steps. |
|
Step 2 |
If both the local and remote MAC entries are present in the preceding output, enter the following command to confirm that the entry has been pushed down to the platform programming: The output shows entries for the two client MAC addresses assigned in the correct VLAN. The remote client should be of type 0x1000001, which indicates the MAT_LISP_REMOTE_ADDR. The port should be the RLOC of the remote fabric edge switch. The local client should be of type 0x1 and should point to the local physical interface where the client resides. If any entry is missing or incorrect, contact the Cisco TAC for platform-level debugging. |
|
Step 3 |
To check for the presence of the ARP entry, enter show arp vrf <vrf name>. |
|
Step 4 |
Verify that the client appears in the ARP table with the correct IP, MAC, and VLAN information. If the client is missing, check the device tracking table and the packet captures to verify that your client is sending packets. |
|
Step 5 |
To check the device tracking table, enter show device-tracking database. |
|
Step 6 |
Verify that you have an entry for the specific client and it is learned via the expected protocol (DHCP, Static, and so on). If there is no entry, verify that you are receiving packets from your client via packet captures. |
|
Step 7 |
To check the local LISP database, enter show lisp instance-id <instance-ID-number> ipv4 database. |
|
Step 8 |
Verify that the client is present in the local database in a reachable state via site-self. If the client is missing, repeat the preceding steps to verify that you are receiving traffic from the client. |
|
Step 9 |
To check the control plane registration on the control node, enter show lisp instance-id <instance-ID-number> ipv4 server. |
|
Step 10 |
Verify that the client is registered from the correct RLOC with the control plane node. If the entry is missing, see Wireless FAQs and Troubleshooting Cisco SD-Access on Cisco DNA Center. |
Resolution for a Wired Client
To send traffic from one host to another host, a wired client needs host resolution. This is required for resolving ipv4 addresses, that is, for locating an ipv4 host..
Fabric Edge Node
To confirm that the fabric edge node sent a map request and received a map-reply from the control plane node, enter the sh lisp instance-id <instance-ID-number> ipv4 map-cache command. The output looks similar to the following example:
Edge_2#sh lisp instance-id 4099 ipv4 map-cache
LISP IPv4 Mapping Cache for EID-table vrf BruEsc (IID 4099), 5 entries

0.0.0.0/0, uptime: 6d23h, expires: never, via static-send-map-request
Negative cache entry, action: send-map-request
10.1.1.0/25, uptime: 4d01h, expires: 22:12:43, via map-reply, complete
Locator Uptime State Pri/Wgt Encap-IID
172.16.255.5 4d01h up 10/10 -
192.168.200.0/24, uptime: 6d23h, expires: never, via dynamic-EID, send-map-request
Negative cache entry, action: send-map-request
192.168.200.1/32, uptime: 22:46:02, expires: 21:08:13, via map-reply, complete
Locator Uptime State Pri/Wgt Encap-IID
172.16.255.53 22:46:02 up 10/10 -
193.0.0.0/8, uptime: 00:00:03, expires: 00:14:56, via map-reply, forward-native
Encapsulating to proxy ETR
Confirm that:
-
The appropriate client IP address is available in the map-cache and was learned via map-reply.
-
The client IP address is complete.
-
The RLOC address specifies the correct client location.
Control Plane Node
Make sure that for both clients, the control plane node is registered (as described in Registration for a Wired Client). If either the control plane node or the fabric edge node does not have a LISP entry for the clients in question, you must enable debugs to determine if the registration, map-request, or map-reply is failing.
Useful Debug Commands
On the fabric edge node, run the debug lisp control map-request command to see requests and replies from the control plane node.
*Jun 28 13:06:48.744:       LISP-0: IID 8198 Request processing of remote EID prefix map requests to IPv4.
*Jun 28 13:06:48.744:       LISP: Send map request type remote EID prefix
*Jun 28 13:06:48.744:       LISP: Send map request for EID prefix IID 8198 0050.5692.0b4b/48
*Jun 28 13:06:48.744:       LISP-0: EID-AF MAC, Sending map-request from 0.0.0.0 to 0.0.0.0 for EID 0050.5692.0b4b/48, ITR-RLOCs 1, nonce 0x1023A24B-0xB04DA9E6 (encap src 172.16.255.54, dst 172.16.255.5).
*Jun 28 13:06:48.747: [XTR] LISP: Processing received Map-Reply(2) message on TenGigabitEthernet1/1/2 from 172.16.255.5:4342 to 172.16.255.54:4342
*Jun 28 13:06:48.748: [XTR] LISP: Received map reply nonce 0x1023A24B-0xB04DA9E6, records 1
*Jun 28 13:06:48.748: [XTR] LISP: Processing Map-Reply mapping record for IID 8198 SVC_VLAN_IAF_MAC 0050.5692.0b4b/48 LCAF 2, ttl 1440, action none, not authoritative, 1 locator
 172.16.255.53 pri/wei=10/10 lpR
*Jun 28 13:06:48.748: [XTR] LISP-0: Map Request IID 8198 prefix 0050.5692.0b4b/48 remote EID prefix[LL], Received reply with rtt 3ms.
*Jun 28 13:06:48.878:       LISP-0: IID 8198 Request processing of remote EID RLOC map requests to IPv4.
*Jun 28 13:06:48.878:       LISP: Send map request type remote EID RLOC
*Jun 28 13:06:48.878:       LISP: Send map request for EID prefix IID 8198 0050.5692.0b4b/48
*Jun 28 13:06:48.878:       LISP-0: EID-AF MAC, Sending probe map-request from 172.16.255.54 to 172.16.255.53 for EID 0050.5692.0b4b/48, ITR-RLOCs 1, nonce 0x97A73181-0x42346852.
*Jun 28 13:06:48.879: [XTR] LISP: Processing received Map-Reply(2) message on GigabitEthernet1/0/48 from 172.16.255.53:4342 to 172.16.255.54:4342
*Jun 28 13:06:48.879: [XTR] LISP: Received map reply nonce 0x97A73181-0x42346852, records 1, probe
*Jun 28 13:06:48.879: [XTR] LISP: Processing Map-Reply mapping record for IID 8198 SVC_VLAN_IAF_MAC 0050.5692.0b4b/48 LCAF 2, ttl 1440, action none, authoritative, 1 locator
 172.16.255.53 pri/wei=10/10 LPR
*Jun 28 13:06:48.879: [XTR] LISP-0: Map Request IID 8198 prefix 0050.5692.0b4b/48 172.16.255.53 remote EID RLOC[MM], Received reply with rtt 2ms.
On the control plane node, you can enable the following debug commands:
-
debug lisp control map-request
-
debug lisp forwarding data-signal-map-request
-
debug lisp forwarding eligibility-process-switching
*Jun 28 18:43:18.869: LISP: Processing received Encap-Control(8) message on TenGigabitEthernet1/0/1 from 172.16.255.54:4342 to 172.16.255.5:4342
*Jun 28 18:43:18.869: LISP: Processing received Map-Request(1) message on TenGigabitEthernet1/0/1 from 0.0.0.0:4342 to 0.0.0.0:4342
*Jun 28 18:43:18.870: LISP: Received map request for IID 8198 0050.5692.0b4b/48, source_eid IID 8198 0000.0c9f.f465, ITR-RLOCs: 172.16.255.54, records 1, nonce 0xA0CBF642-0x3D96CAF4
*Jun 28 18:43:18.870: LISP-0: MS EID IID 8198 prefix 0050.5692.0b4b/48 SVC_VLAN_IAF_MAC site site_uci, Sending proxy reply to 172.16.255.54.
In the preceding example, the control plane node receives the map-request on the TenGigabitEthernet1/0/1 interface from the fabric edge node. Because it is set to send a proxy reply, the control plane node responds directly to the requester with the map-reply.
Wireless Onboarding
Wired: Cisco SD-Access Fabric Traffic Flow
When debugging east-west traffic that uses the same VN or IP pool, you need to validate local connectivity to the client and ensure that both hosts/clients are registered with the fabric edge and control plane nodes. The steps described in this section help you determine whether the issue involves LISP or another component (such as MAC programming, ARP, resolution, or SISF).
Validate Connectivity and the Layer 2 LISP Control Plane
Procedure
|
Step 1 |
Begin by checking whether you can ping from your local fabric edge node to the client that is directly connected. 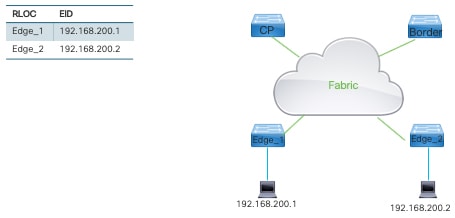 The following example shows a VRF ping to 192.168.200.1 from Edge_1: |
|
Step 2 |
You can also do a VRF ping from Edge_2 to its local client, 192.168.200.2. However, because Anycast IPs are used in the fabric, we cannot validate connectivity through the fabric because a ping from Edge_1 to the remote client 192.168.200.2 is not sent back (because Edge_2 consumes the ping response). If the ping does not pass, the issue is local between the fabric edge node and the client. Similarly, you can also ping the Anycast gateway address from the client to validate connectivity. For east-west traffic within the same VN or IP pool, control plane programming and traffic forwarding uses Layer 2 LISP. On the fabric edge nodes, check MAC address programming by entering the show mac add command. Multiple types of entries are displayed in the resulting output, such as static entries (like the Anycast IP for the SVI), dynamic entries for the hosts off of the local ports, and CP_LEARN entries pointing to a LISP Tunnel interface for remote learned hosts. In the sample output above, you can see that client 0050.5692.439a has been learned on the local interface Gi1/0/1 and that the remote client 0050.5692.0b4b has been learned over the LISP tunnel 2. |
|
Step 3 |
Verify that the local client MAC address has been programmed into the local L2 LISP database by entering the show lisp instance-id <instance-ID-number> ethernet database command. |
|
Step 4 |
The MAC address of the locally known host must be present in the LISP Ethernet database, as well as reachable using site-self and the local FE RLOC. If the local client is pingable but not present in the LISP database, debug lisp programming local to the fabric edge. |
|
Step 5 |
Check for remote entries in the LISP map-cache by entering the show lisp instance-id <instance-ID-number> ethernet map-cache command. If your local client is trying to reach a remote client, the fabric edge node should trigger a map-request to the control plane node. If working properly, you should see the following in the output:
|
|
Step 6 |
Do the following: |
|
Step 7 |
Check that the control plane has registered the MAC addresses of the clients in its L2 database by entering the show lisp instance-id <instance-ID-number> ethernet server command. |
|
Step 8 |
On the control plane, confirm that both MAC addresses have been learned and registered by the correct fabric edge RLOC by entering the show lisp instance-id <instance-ID-number> ethernet server address-resolution command. Both clients should be listed and resolved to the correct instance ID. After you confirm that the control plane has been learned, you must verify the data plane if traffic is not able to complete from one host to another. |
|
Step 9 |
If the local clients are pingable and the control plane looks to be programmed correctly, check the data plane forwarding from each fabric edge to the remote clients by entering the show ip cef vrf <VRF-name> <IP-address> detail command. In the resulting output, verify that:
Perform the check for both east-west and west-east traffic. |
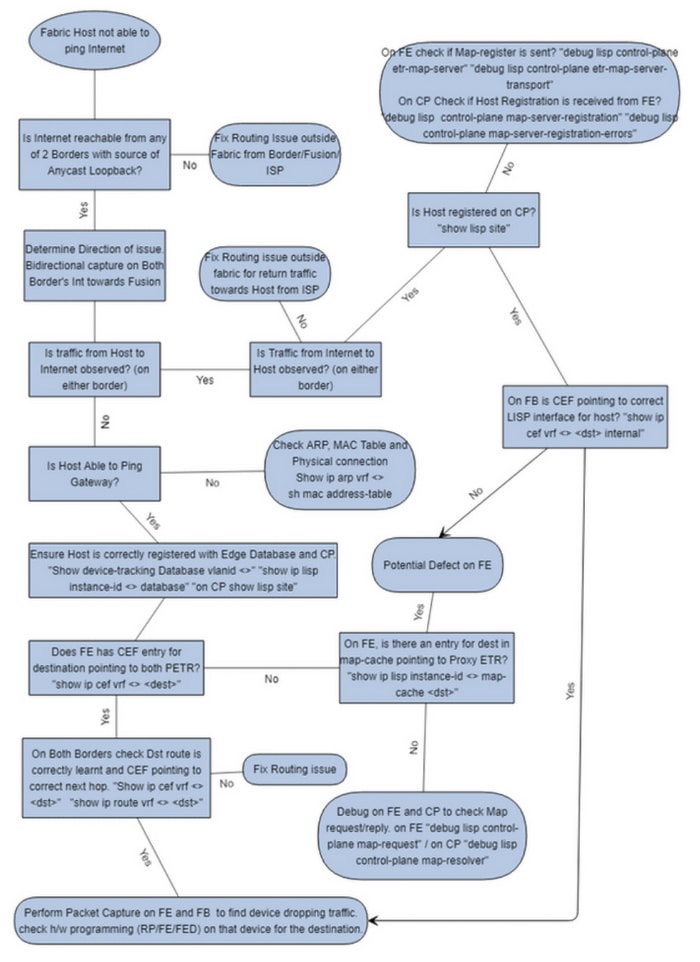
Wired: External Connectivity (North-South Traffic Flow)
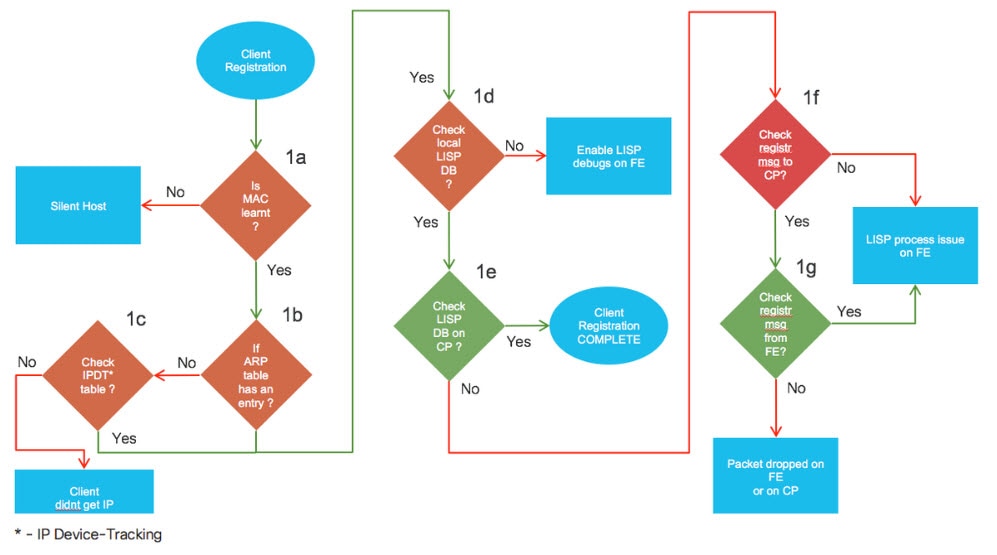
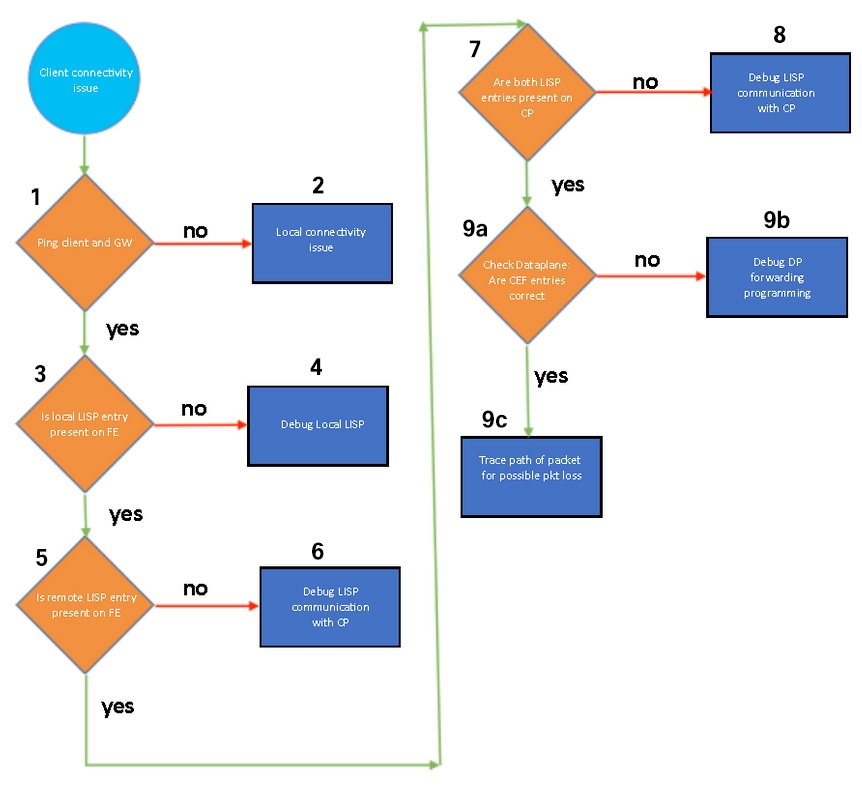
For external traffic flow, check the LISP programming on both the fabric edge and control plane nodes to ensure that the LISP programming is correct. This will help isolate whether the problem lies with the LISP/host registration or other components (such as ARP, IP routes, or an IP CEF programming issue). Refer to the following figures for a sample fabric setup and a troubleshooting flowchart.
On Edge Node
Based on the source IP address of the client/end point, check whether a LISP entry exists in the database on edge node where the end point is connected. The entry should display with the RLOC IP address of the local edge node and the site-self reachable state.
Procedure
|
Step 1 |
View the entry. |
|
Step 2 |
Check the destination (external to fabric) IP address LISP map-cache entry in local edge node. In the output below, check for uptime and covering prefix. |
|
Step 3 |
Make sure that ISIS or OSPF neighborship to upstream router is up without flaps occurring. |
|
Step 4 |
Check for a CEF entry, which should display the nexthop using the LISP tunnel toward the border router. If there are two or more borders, the CEF entry will display as many tunnels as there are borders. |
|
Step 5 |
Check the CEF detail output to see more information about the forward action. |
|
Step 6 |
Check CEF output for covering prefix next hop entry. |
|
Step 7 |
Check CEF detail output to see prefix information about the forward action. |
Wireless Connectivity
For more information, see Wireless FAQs and Troubleshooting Cisco SD-Access on Cisco DNA Center.
DHCP
For more information, see Cisco SD-Access Fabric Edge DHCP Process/Packet Flow and Decoding.
LAN Automation
For more information, see the Cisco DNA Center SD-Access LAN Automation Deployment Guide.
Authentication
Endpoints can belong in multiple IP pools or virtual networks. Through authentication, we can control and grant network access for clients to the appropriate resources. Authentication is typically done through Dot1x or MAC authentication bypass (MAB).
Within the fabric, we support the following authentication profiles:
-
Closed Authentication: based on Dot1x and MAB, using closed auth
interface GigabitEthernet4/0/3 switchport mode access device-tracking attach-policy IPDT_MAX_10 load-interval 30 no macro auto processing dot1x timeout tx-period 7 dot1x max-reauth-req 3 source template DefaultWiredDot1xClosedAuth spanning-tree portfast -
Open Authentication: based on Dot1x and MAB, using open auth
interface GigabitEthernet3/0/1 switchport mode access device-tracking attach-policy IPDT_MAX_10 load-interval 30 no macro auto processing source template DefaultWiredDot1xOpenAuth spanning-tree portfast -
Easy Connect: based on Dot1x and MAB, using open auth with a pre-auth ACL
interface GigabitEthernet1/0/48 switchport access vlan 1022 switchport mode access device-tracking attach-policy IPDT_MAX_10 ip access-group IPV4_PRE_AUTH_ACL in load-interval 30 no macro auto processing dot1x timeout tx-period 7 dot1x max-reauth-req 3 source template DefaultWiredDot1xLowImpactAuth spanning-tree portfast -
No Authentication
interface GigabitEthernet10/0/3
switchport access vlan 1021
switchport mode access
switchport voice vlan 1026
device-tracking attach-policy IPDT_MAX_10
load-interval 30
no macro auto processing
auto qos voip cisco-phone
spanning-tree portfast
For complete configuration, see On Edge Node.
Procedure
|
Step 1 |
For the authentication to succeed, you must have connectivity to your AAA server. To view the status, enter show aaa servers. |
|
Step 2 |
To view the authentication details of a particular session, enter show access-session interface <int> detail. The preceding response highlights a number of outputs to validate:
|
|
Step 3 |
If any of the output looks incorrect, some platform trace output is required to identify the cause. To capture the correct detail, set the platform trace with set platform software trace smd switch ,switch> R0 <facility>. |
|
Step 4 |
To show the output of the platform trace, enter show platform software trace message switch <switch> smd R0. The output is similar to the following: 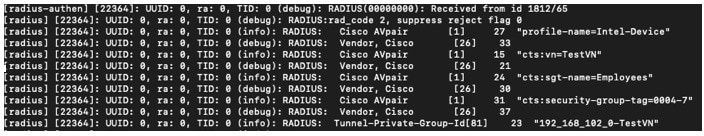 |
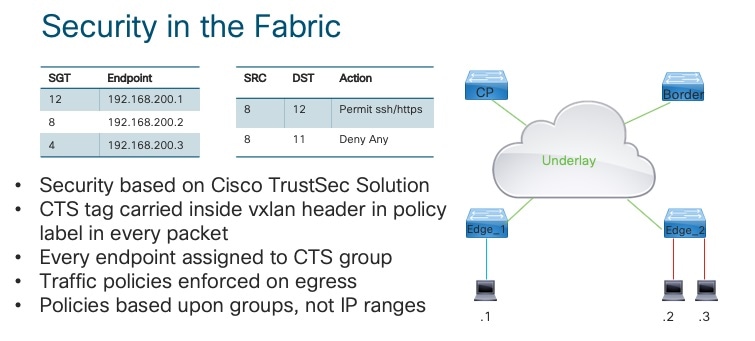
Cisco TrustSec Solution
Cisco TrustSec Solution (CTS) topology:
Edge_1#sh cts environment-data
CTS Environment Data
====================
Current state = COMPLETE
Last status = Successful
Local Device SGT:
  SGT tag = 0-00:Unknown
Server List Info:
Installed list: CTSServerList1-0001, 1 server(s):
  Server: 10.1.1.1, port 1812, A-ID 0BDF4772B3C640B3D8C1AA6DC9514DD3
          Security Group Name Table:
    0-00:Unknown
    2-00:TrustSec_Devices
    3-00:Network_Services
    4-00:Employees
    5-00:Contractors
    Environment Data Lifetime = 86400 secs
Last update time = 14:21:39 UTC Fri May 3 2019
Env-data expires in   0:18:45:43 (dd:hr:mm:sec)
Env-data refreshes in 0:18:45:43 (dd:hr:mm:sec)
=========================
Procedure
|
Step 1 |
The server IP must match the RADIUS server that is being used. Confirm that the status is successful and that all the SGT mapping information is downloaded to the switch. If the status is not successful, investigate Cisco ISE and CTS credentials.
|
||
|
Step 2 |
Confirm that the correct SGACL is configured on the local fabric edges, and confirm that the correct SGTs are assigned to the clients. |
||
|
Step 3 |
To monitor the SGT traffic, enter the following command: The SGT defined in this lab is from SGT 8 to SGT 12. Depending on the traffic being sent, permit/deny counters should increment. |
 Feedback