Cisco Crosswork Situation Manager (6.5) Operator Guide
Available Languages
Cisco Crosswork Situation Manager Operator Guide
(Powered by Moogsoft AIOps 6.5)
First Published: 2018-08-13
Last Updated: 2018-08-16
Get Started
Launch Cisco Crosswork Situation Manager
Cisco Crosswork Situation Manager collects raw data, called events, from your monitoring systems. It applies machine learning to deduplicate events into alerts and groups similar alerts into Situations so you can focus on resolving critical issues.
Use this guide to learn how to use Cisco Crosswork Situation Manager as a collaborative space where you can:
■ Monitor the status of systems that you support, called services.
■ Work on Situations that have been assigned to you.
■ Share information about Situations you are working on.
■ Identify similar Situations, potential resolving steps, and applicable solutions.
Before you Begin
This guide assumes that an administrator has already set up your Cisco Crosswork Situation Manager system and that it integrates with monitor tools that provide event data about the systems you support.
Your Cisco Crosswork Situation Manager administrator should provide you the following so that you can log in to Cisco Crosswork Situation Manager:
■ Your username
■ Your password
■ The Cisco Crosswork Situation Manager server name
If you do not have any of these things, contact your Cisco Crosswork Situation Manager administrator.
If you are a Cisco Crosswork Situation Manager administrator and want information about system setup and configuration, see the Cisco Crosswork Situation Manager Administrator Guide.
Log in to Cisco Crosswork Situation Manager
When you're ready you can access your Cisco Crosswork Situation Manager system at the link provided by your administrator using one of the following browsers:
■ Apple Safari, latest version
■ Google Chrome, latest version
■ Microsoft Edge, latest version
■ Microsoft Internet Explorer, version 11
■ Mozilla Firefox, latest version
Navigate the Cisco Crosswork Situation Manager UI
The Cisco Crosswork Situation Manager UI is split into several key components including the top bar, workbench summary, and side menu.
The following sections give a brief overview and description of these components. Click any of the links on this page for more information.
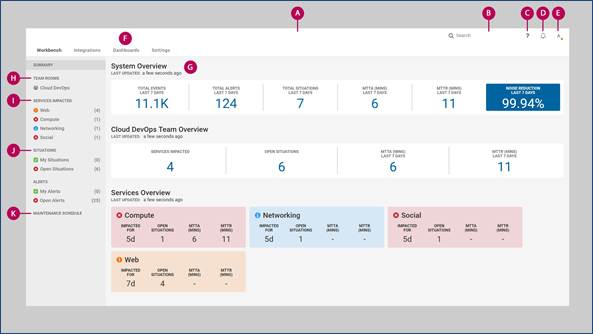
A. Workbench: The workbench is the default landing page and working area where you spend most of your time.
B. Search Bar: Allows you to perform a contextual search for a specific Alert or Situation or both Alerts and Situations.
C. Help & Support: Provides links for help, tutorials and support information such as your version number, database schema and upgrade history.
D. Notifications: Displays notifications about invitations and assignments.
E. User Menu: The User Menu is where you can perform a number of user-related actions such as changing personal details and customizing Cisco Crosswork Situation Manager.
Note: If you forget your password, contact your administrator to reset it.
F. Dashboards: Dashboards are screens that comprise a series of widgets that offer overviews and statistics for different aspects of Cisco Crosswork Situation Manager.
G. Workbench Summary: Displays an overview of statistics for your system, for your teams, and for your Services.
H. Team Rooms: Links to the Team Room(s) for your team(s).
I. Services Impacted: Displays all Services monitored by your team that are impacted by Situations.
Note: The Services Impacted in the side menu updates every minute. The Situation and Alert counts update in real time.
J. Situation and Alert Views: Displays Situations and Alerts that are assigned to you under My Situations and My Alerts, as well as all unresolved Situations and Alerts under Open Situations and Open Alerts.
K. Maintenance Schedule: Schedules maintenance windows if you want to reduce noise and prevent new Situations from being created.
Summary Overviews
The System Overview offers a high-level overview of the key statistics for your Cisco Crosswork Situation Manager system such as the noise reduction and the number of Events, Alerts, or Situations over the past week. These statistics update automatically every five minutes. It also displays the mean time to acknowledge (MTTA) in minutes and the mean time to resolve (MTTR) over the past week.
The Team Room displays an overview for your team and includes statistics about the number of impacted Services, situations assigned to the team, and the MTTA and MTTR in minutes. These statistics update automatically every five minutes.
The Services Overview displays the latest impacted Services and the number of hours or days the Services have been affected. The color of each Service panel indicates the highest severity of the Situations impacting it.
Note: The 'Impacted For' and 'Open Situations' statistics update every minute. The 'MTTA' and 'MTTR' update automatically every hour.
Search Bar
You can use the Search bar in the top bar to quickly find Alerts or Situations you are interested in.
Once a search has been made, you can narrow down the search results to pinpoint exactly what you are looking for.
Enter any alphanumeric text into the Search bar, such a Situation ID number or a Service name, and then press Enter to continue.
The search results should appear in new screen, showing all successful results relating to both Situations and Alerts by default.
Note: The search results appear in the order in which they occurred (oldest to most recent in descending order).
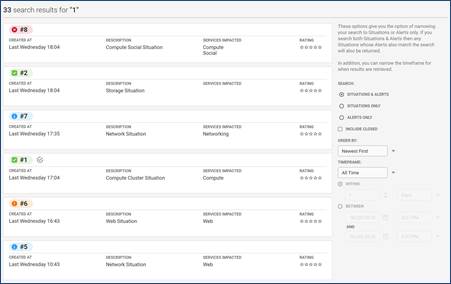
You can narrow the search results using the field options on the right side of the screen:
| Field | Options | Description |
| Search | Situations & Alerts Situations Only Alerts Only | Select whether the search results display Situations and Alerts, Situations Only, or Alerts Only. |
| Timeframe | All Time Created Last Updated | Select whether the results are for all time, from a created date range or last updated date range. |
| Within | X Minutes X Days X Weeks X Years | Select the number of minutes, days, weeks, or years. |
| Between | Date range and time | Select two dates and times of the date range. |
Note: Results generated from the search bar are static.
For example, a search for Situations created within the last hour shows a static list of Situations created within one hour of when the search was carried out. As time progresses, this information becomes out of date. Therefore, to show Situations created within one hour of the present time, carry out the search again to get new results.
Cisco Crosswork Situation Manager Notifications
Notifications keep you informed of your invitations, assignments, and any critical Situations in Cisco Crosswork Situation Manager.
You can subscribe to receive notifications about invitations to Situations, assignments to Situations, and critical Situations that have been assigned to your team.
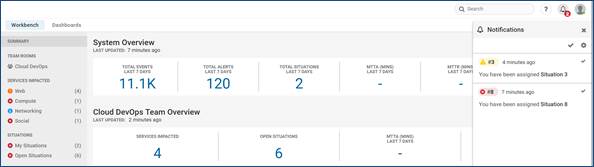
Click the Situation number mentioned in each notification to open the Situation Room for that Situation.
Mark Notifications as Read or Unread
To mark all notifications as read, click the Notifications icon and click the check icon at the top of the drop-down menu to mark all as read.
Alternatively, click the check icons next to each individual notification to mark them as read one at a time.
A read notification appears grayed out. Click the check icon again to mark a read notification as unread.
Configure your Notifications
To configure your notifications, click the Notifications icon on the top bar and then click the Settings cog icon.
You only receive notifications about invitations and assignments by default. To change the default settings, uncheck 'Use System Defaults' and check one or more of the other 'Type' options from: 'Invitations', 'Assignments', or 'Critical Situations Assigned to My Team'. Click Done to continue.
Note: You must select at least one notification type from the group
Push Notifications
The settings for push notifications differ depending on which browser you are using for Cisco Crosswork Situation Manager and which browser you are using when the notification is sent.
Instructions for turning push notifications on or off and examples of notifications for different browsers are shown below.
Google Chrome
Push notifications from websites or apps are enabled for Chrome by default. To enable or disable notifications for Windows and Mac, open Chrome and go to Settings > + Show advanced settings.
Under 'Privacy' click Content Settings... and under 'Notifications' choose whether to allow or block notifications.
Apple Safari
Notifications from websites and apps are blocked for Safari by default. To enable notifications, got to Safari > Preferences (⌘,). Click Notifications and then Allow for Cisco Crosswork Situation Manager.
Mozilla Firefox
Mozilla Firefox asks your permission to allow a notification from a website by default.
To enable or disable Firefox push notifications, go to the top-left corner of your browser, click the menu icon, and open Preferences. Under 'Privacy & Security' > 'Permissions', allow Cisco Crosswork Situation Manager to notify you.
Microsoft Edge
Microsoft Edge asks your permission to allow a notification from a website by default.
To enable notifications from Cisco Crosswork Situation Manager, go to Advanced Settings > Manage Notifications and set notifications to On for Cisco Crosswork Situation Manager.
Cisco Crosswork Situation Manager for Mobile
Cisco Crosswork Situation Manager for Mobile enables ITOps and DevOps teams to resolve potential incidents at any time and from anywhere using a mobile device.
This application allows users to send and receive SMS notifications when they assign Situations to colleagues or invite them to Situation Rooms.
System Requirements
The mobile version of Cisco Crosswork Situation Manager is supported by the following browsers and mobile platforms:
Browsers
| Browser | Version | iOS | Android |
| Chrome | Latest | Recommended | Recommended |
| Safari | Latest | Recommended | N/A |
Note: Other browsers might be compatible but are not officially supported by Cisco.
Platforms
The recommended platforms for Cisco Crosswork Situation Manager for mobile are: iPhone SE, iPhone 6, iPhone 7 and iPhone 7 Plus (iOS 10 or higher).
Android phones using OS 6 are also supported. Our browser and platform recommendations are defined as follows:
■ Recommended: Tested and recommended by Cisco for the optimal solution experience
■ Supported: Smoke tested and supported by Cisco
Use Cisco Crosswork Situation Manager for Mobile
The differences between the mobile version and the standard desktop version of Cisco Crosswork Situation Manager are outlined in the following sections.
Navigate on Summary Screens
The Dashboard is divided into two summary screens in mobile, with separate Team Summary and Service Summary screens.
■ Tap the Team Summary and Service Summary buttons at the top of the screen to navigate between the screens.
■ Swipe up and down on the Service Summary screen to scroll through Services further down on the list.
■ Tap any service to view the Situations that are impacting it. The following screenshot shows a single Service view:
Access the Navigation Menu
Swipe right from any location to open the navigation menu. The navigation menu has links to the Summary home screen, Settings, My Situations, Open Situations, and your Team Rooms.
Tap the bell icon to access Notifications.
Notifications
The Notifications is much the same as the tab in the desktop version but you cannot edit the settings.
Tap Mark As Read to mark a notification as read. Notifications marked as read appear grayed out.
You can configure your notifications and determine which actions you receive notifications about under mobile Settings.
Alternatively, go to the desktop version, click Notifications, and click the menu icon to open Notification Settings in the desktop version.
Settings
You can choose whether to use the system defaults or configure notifications in mobile Settings.

Touch any of the toggle switches to enable or disable the settings. The toggle switch turns green if the setting is enabled and gray for any setting that is disabled.
Situation Screens
The Situations screens behave in the same way as the desktop version of Cisco Crosswork Situation Manager, displaying all open Situations and all assigned Situations:
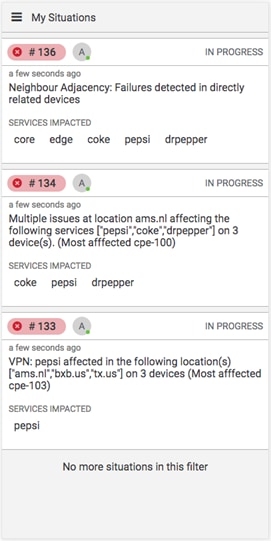
Tap a Situation number to open the Situation Room; this is very similar to the desktop version.
Note: If there are more Situations than fit on the screen, you can scroll up and down to view the full list.
Situation Room
The Situation Room screen is split into three tabs: Details, Alerts, and Collaborate.
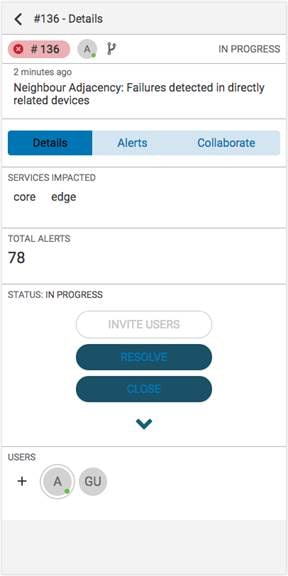
The Details tab displays the current status of the Situation, any Services that are impacted, the total number of Alerts within the Situation, and any Users who are in the Situation Room.
Swipe up and down to scroll through the tabs.
You can message other users using the Collaborate tab. Click Write a comment... and type to write a message.
Note: ChatOps commands are not currently supported in the mobile version of Cisco Crosswork Situation Manager.
Alerts associated with the Situation appear in the Alerts tab. Each Alert is listed along with the time it was created, the host name, and a description.
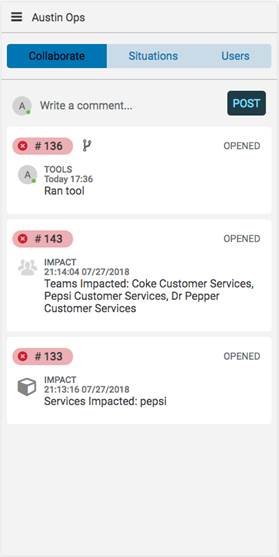
Team Room
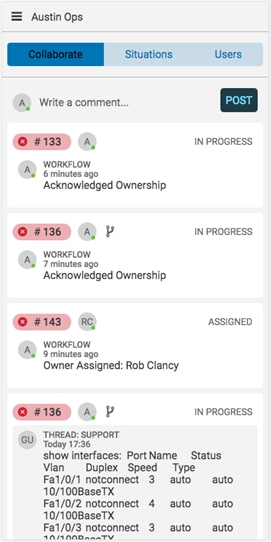
The Team Room screen is divided into three tabs: Collaborate (which displays by default), Situations, and Users.
Collaborate
The Collaborate tab displays all of the latest activity by users who belong to the team.
Situations
The Situations tab displays all Situations that are impacting Services being monitored by the team.
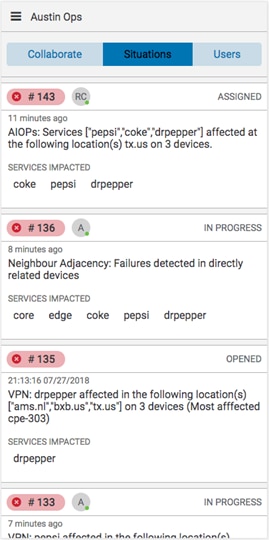
Swipe up and down to scroll.
Users
The Users tab displays all users who are members of the team. The following example shows all members of the Cloud DevOps team.
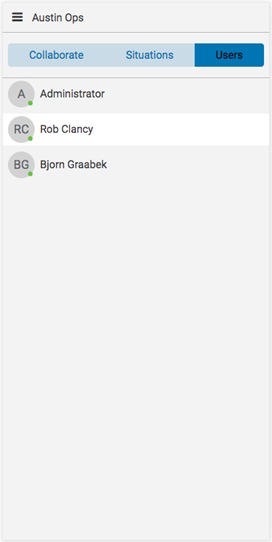
Swipe up and down to scroll.
Situations
Situations Overview
Cisco Crosswork Situation Manager uses machine-learning algorithms called Sigalisers to cluster alerts together based on the similarity of their timestamps, language, and/or topology.
These can be viewed in filterable lists in the side menu, the Search bar, and by looking at which Situations are impacting Services.
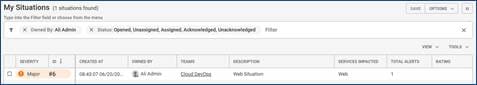
My Situations/Open Situations Views
Note: You might have received Notifications about any Situations assignments if Notifications are enabled for assignments.
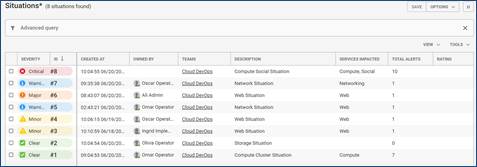
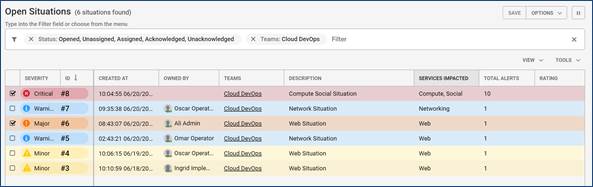
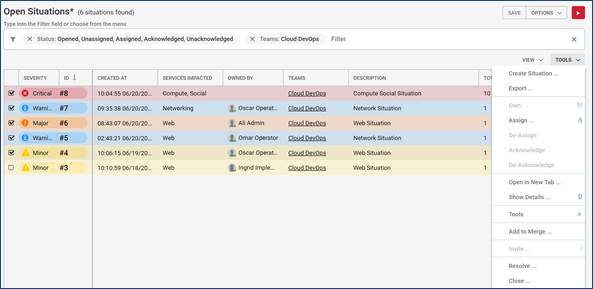
The Open Situations view displays all open Situations created in Cisco Crosswork Situation Manager that have yet to be resolved.
You can find out more about each Situation and open its Situation Room by clicking the colored pill containing the Situation ID.
Situation View Menu
You can use the View menu to configure which columns are shown in My Situations, Open Situations, or a filtered Situation view.
Click View in the top-right corner of the screen and select the different options in the drop-down menu to enable them.
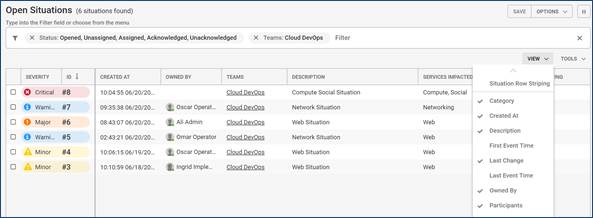
The View menu can be used to customize which field columns are displayed in My Situations/Open Situations or a Situation filter view.
To see the options, click View in the top-right corner of the screen and select the different options in the drop-down menu to enable them.

View Options
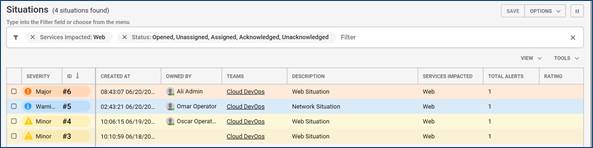
You can edit any Situation view to display each Situation row in the color of the severity using the 'Situation Row Striping' option:
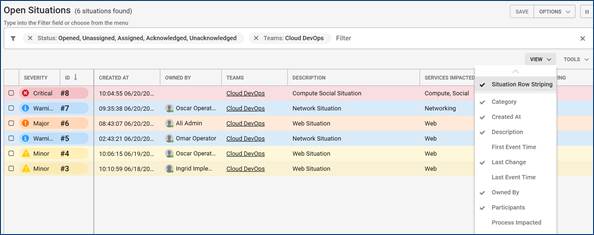
You can configure which Situation columns are displayed by clicking to select them in the View menu. Available columns include:
| Column | Description |
| Category | Indicates the type and state of the Situation. Categories include: Closed, Created, Detected, Priority, Spam, and Superseded. |
| Created At | Time and date when the Situation was created. |
| Description | Text description of the Situation. |
| First Event | Time and date when the first Event was recorded. |
| Last Change | Time that the Alert was last updated in the Cisco Crosswork Situation Manager UI. |
| Last Event | Time and date when the last Event was recorded. |
| Owned By | Situation owner's username. |
| Participants | Number of Users participating in the Situation Rooms. |
| Process Impacted | All processes associated with the Situation that have been impacted. |
| Queue | Queue number the Situation belongs to. |
| Rating | Rating given to the Situation. |
| Scope | Scope of the different source groups affected by the Situation (End-User, All, Network, Applications, Database, Storage, Desktop, Cloud, Other). |
| Scope Trend | Indicates whether the scope is increasing or decreasing/staying the same. |
| Service Impacted | All services associated with the Situation that have been impacted. |
| Sev Trend | Indicates if the severity is becoming more or less severe. |
| Status | The Situation's current status: Opened, Closed, Resolved, Assigned, Acknowledged etc. |
| Story | Story ID number that matches the Situation ID number at the top of the Merge tree. |
| Teams | Teams that the Situation are associated with. |
| Total Alerts | Total number of Alerts associated with the Situation. |
| User Comments | Number of user comments about the Situation. |
Select a Situation
You can click the check boxes in the far-left column to select each Situation individually:
To select multiple Situations at once, hold down Shift and then click the check boxes of the Situations you want to select. If you select one Situation using this method and then click another Situation further down the list, all Situations between the two are also selected.
Another method is to left-click and drag down to highlight the Situations you want to select and then right-click to select them and open the Tools menu (also known as the right-click menu).
Move View Columns
You can change the width of each column by hovering your mouse cursor over the column order and clicking and dragging it to increase or decrease the width.
To change the order of the columns, click the column title cell of the column you want to move and drag it to a new location in the top row. Two green arrows indicate if the move is valid:
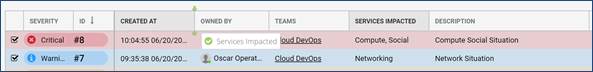
You can also configure the order in which the Situations are shown by clicking the column title cell to rearrange them in ascending or descending alphabetical or numerical order.
For example, click the Severity column to arrange the Situations in ascending or descending order of severity.
Situation Tools Menu
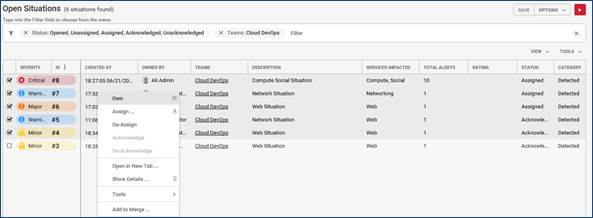
All other actions that can be performed to a Situation or several Situations can be done using the Tools menu or right-click menu.
This can be accessed by clicking Tools or by right-clicking the Situation list.
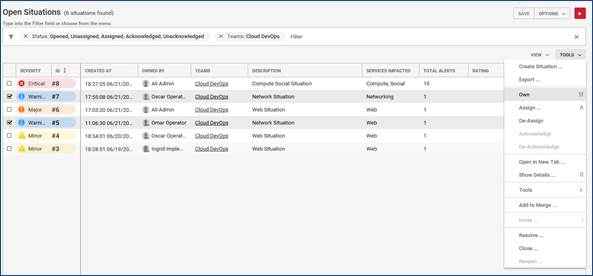
Select a Situation or multiple Situations by checking the check boxes in the far-left column. Next click Tools and select one of the following actions:
| Action | Options | Description |
| Create a Situation | — | Opens a new pop-up window. From here you can create a new Situation. |
| Export | Filename: String Format: · CSV (comma-separated values) · JSON (JavaScript object notation) Export: · All Rows · Selected Rows | Exports a row, multiple selected rows, or all rows in CSV or JSON format. |
| Own | — | Makes you the owner of the selected Situation or Situations. |
| Assign | — | Enables you to assign the Situation to a User if you have the correct rights. |
| De-Assign | — | De-assigns the Situation from its current owner. |
| De-Acknowledge | — | De-acknowledges the Situation so it is no longer in progress. |
| Show Details | — | Opens Situation Details. |
| Tools | — | Links to any configured Server Tools. |
| Add to Merge… | — | Adds the selected Situation in a new 'Merge Situations' panel. |
| Resolve… | — | Opens a new pop-up window. From here you can add a Situation Rating and journal entry prior to resolving the Situation. |
| Close… | — | Opens a new pop-up window. From here you can add a Situation Rating and journal entry prior to closing the Situation. |
| Reopen… | — | Reopens a resolved or closed Situation. |
Situation Severity
There are six default industry standard severity levels:
■ Clear: Indicates that one or more Events have been reported but then subsequently cleared either manually or automatically
■ Indeterminate: Indicates the severity level could not be determined
■ Warning: Indicates that a number of potential or imminent service affecting faults have been detected
■ Minor: Indicates there is a non-service affecting fault but action could be required to prevent it becoming a more serious issue
■ Major: Indicates a service affecting fault has developed and corrective action is urgently required
■ Critical: Indicates that a serious service affecting fault has occurred and corrective action is required immediately
The color severity of the My Situations and Open Situations icons on the side menu indicates the highest severity level of the Alerts within each list.
A Situation's severity is determined by its Alert with the highest severity level. If this Alert is cleared, the Situation adopts the severity level of the Alert with the next highest severity.
Situation Details
The Situations Details window allows you to explore the forensic details of a Situation.
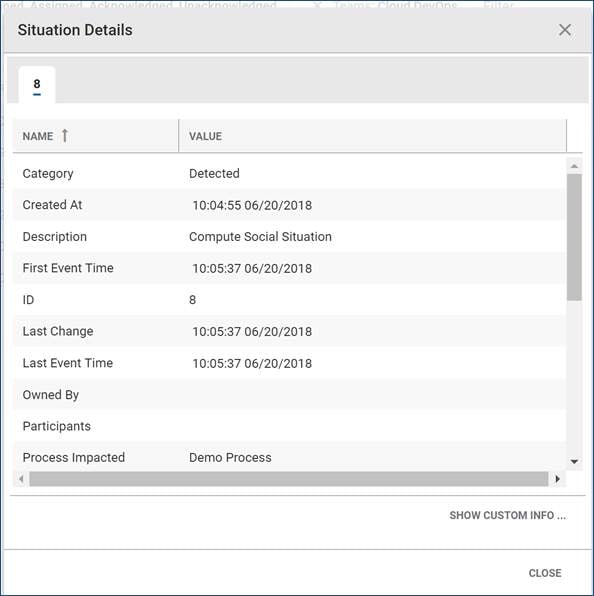
The individual column names and their descriptions are listed in the following table:
| Name | Description |
| Category | The category of the Situation. These include: · Closed: Situations that are closed. · Created: Situations created by a User. · Detected: Situations generated by an algorithm/Sigaliser. · Priority: An automatically created Situation with Alerts that match a user-defined template. · Superseded: Situations that have been merged with another Situation. |
| Created At | The time the Situation was created (the number of seconds, minutes, hours, days ago). |
| Description | The text description of the Situation. |
| First Event Time | The time of the first Event (the number of seconds, minutes, hours, days ago). |
| ID | The Situation ID. |
| Last Change | The time of the last change that was made to the Situation. |
| Last Event | The time that the last Event was recorded (the number of seconds, minutes, hours, days ago). |
| Owned By | The username of the User who owns the Situation. |
| Participants | The number of participants in the Situation. A User becomes a participant after commenting in the Situation Rooms. |
| Process Impacted | The number of processes the Situation is impacting. |
| Scope | The scope of the different source groups that are affected by the Alert or Situation (End-User, All, Network, Applications, Database, Storage, Desktop, Cloud, Other). |
| Scope Trend | Whether the scope is increasing or decreasing/staying the same. This is indicated by an up or down arrow. |
| Severity | The severity of the Situation. |
| Status | The status of the Situation. |
| Story | The story is the Situation ID at the top of the merge tree. |
| Teams | The teams that are impacted by the Situation. |
| Total Alerts | The total number of Alerts associated with the Situation. |
| User Comments | The number of User comments in the Situation Room. |
You can copy out the Situation Details by clicking and dragging across the text to highlight it. You can use Ctrl+C (⌘+c on Mac) to copy the text. This can be pasted in an external editor or tool as required.
Custom Info
Custom Info is where you can view custom fields for the Situation.
This appears in a page tree format. Click the blue drop-down arrows to view the properties beneath each branch.
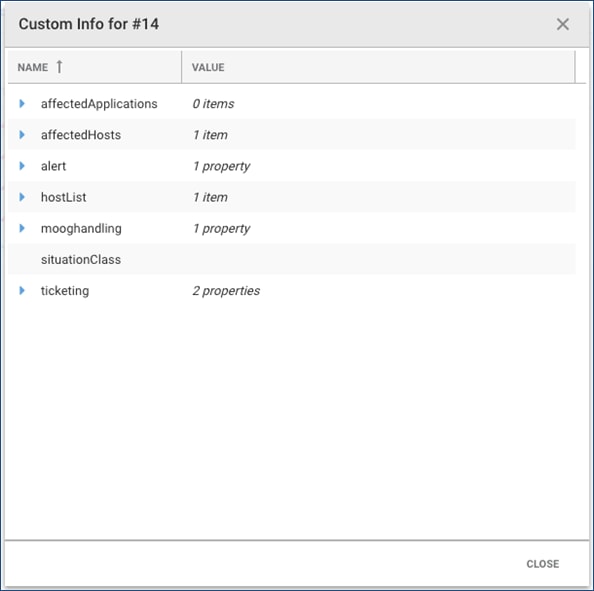
Note: Custom Info fields can be added by Admins during system configuration. They can also be added with a Situation Client Tool using a JSON snippet under the 'Merge Custom Info' field.
Alerts Overview
Alerts represent new instances of events or deduplicated events that have been created by Cisco Crosswork Situation Manager.
You can view these in filterable and sortable lists, via the side menu links, from the Search bar, or by looking within the Situation Room.
The highest severity alert within a Situation determines the severity of a Situation. Alerts follow the same severity levels as Situations.
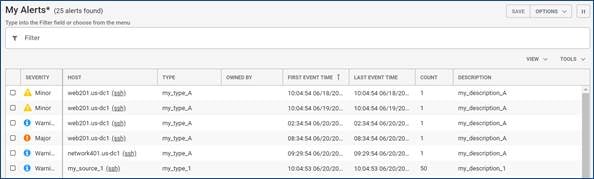
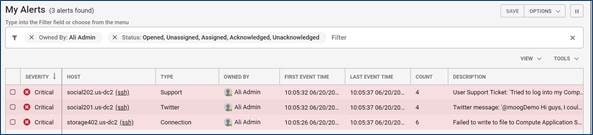
My Alerts/Open Alerts Views
The My Alerts view displays all of the alerts that have been assigned to you.
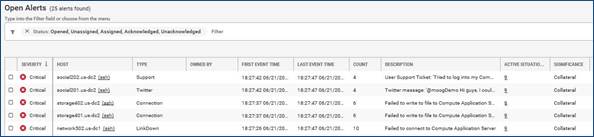
The Open Alerts view displays all open Alerts created in Cisco Crosswork Situation Manager that are yet to be resolved.
Alert View Menu
You can select the different columns displayed in the View screens using the View menu.
Alert Tools Menu
All other actions you can perform on an alert or group of alerts can be done using the Tools menu or right-click menu.
This can be accessed by clicking Tools or by right-clicking the alert list.
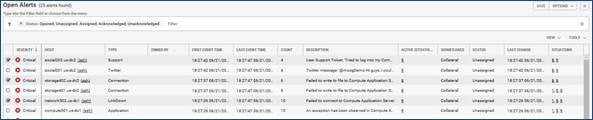
Alert Details
You can explore the forensic details of an alert in Alert Details:
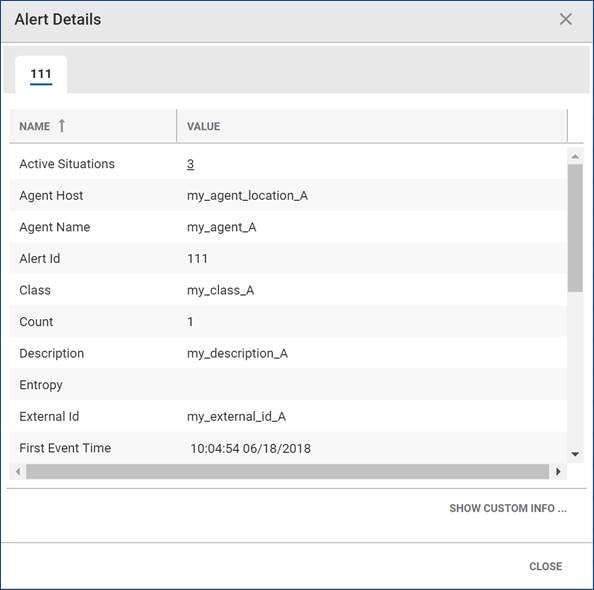
The individual column names and their descriptions are listed in the following table:
| Name | Description |
| Active Situations | All active Situations to which this Alert is linked. |
| Agent Host | The IP address or co-ordinates of the geographic location where the Events were detected. |
| Agent Name | The name of the monitor that detected the Events. Frequently a sub-category of Manager. |
| Alert Id | This is the numeric identifier given to the Alert. |
| Class | The subcategory of the Agent. |
| Count | The number of events in the Alert. |
| Description | A text summary or description of the Alert. |
| Entropy | The entropy value (between 0 and 1). |
| External Id | The external ID given by another management system to reference the Alert. |
| First Event Time | The time of the first Event that was recorded by Cisco Crosswork Situation Manager. |
| Host | The source where the Alert originated. |
| Internal Last Event Time | The internal time recorded within the last Event itself. |
| Last Change | The time of the last change to the Alert. |
| Last Event Time | The time of the last Event that was recorded by Cisco Crosswork Situation Manager. |
| Manager | The system sending the Alert. |
| Owned By | The username of the User who owns the Alert. |
| Severity | The severity of the Alert. |
| Significance | The significance of the Alert. |
| Situations | The Situations that the Alert is associated with. |
| Source Id | The unique number of the source being managed. |
| Status | The status of the Alert. |
| Type | The Alert type. E.g DBFail, HTTPDDown, LinkDown etc. |
You can copy the Alert Details by clicking and dragging across the text to highlight it. You can use Ctrl+C (⌘+c on Mac) to copy the text. This can be pasted in an external editor or tool as required.
Custom Info
You can view custom fields for the Alert in the Custom Info tab.
This appears in a page tree format. Click the blue drop-down arrows to view the properties beneath each branch.
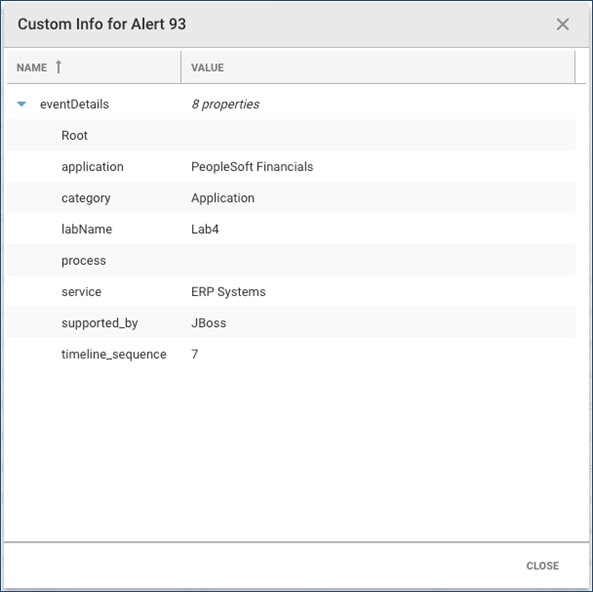
Note: Custom Info fields can be added by Admins during system configuration. They can also be added with a Situation Client Tool using a JSON snippet under the 'Merge Custom Info' field.
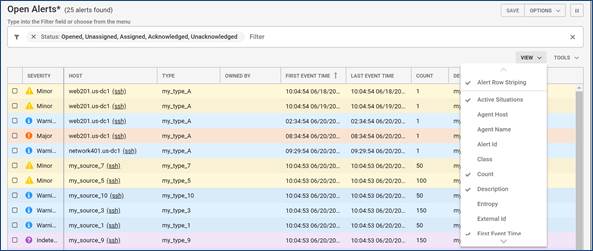
Configure an Alert View
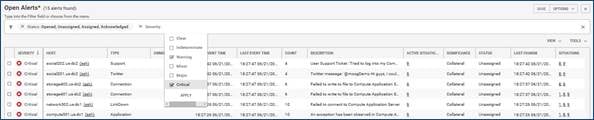
Use the View menu to customize which field columns are displayed in My Alerts/Open Alerts or an Alert filter view.
Click View in the top-right corner of the screen to view and select the different options in the drop-down menu.
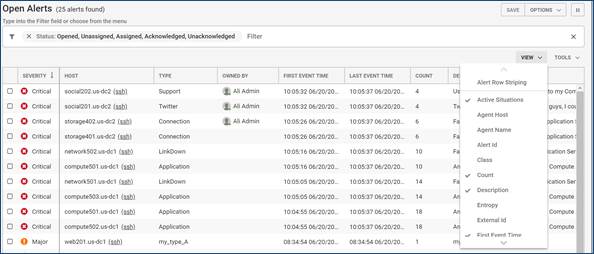
View Options
The top option, 'Alert Row Striping', changes the filter display and each Alert row appears as colored stripes:
The Alert columns that can be added and removed are listed in the following table:
| Name | Description |
| Active Situations | All active Situations the Alerts are linked to. |
| Agent Host | The IP address or co-ordinates of the geographic location where the Events were detected. |
| Agent Name | The name of the monitor that detected the Events. Frequently a sub-category of Manager. |
| Alert Id | The numeric Alert Id. |
| Class | The subcategory of the Agent. |
| Count | The number of times this Alert has been counted. |
| Description | A text summary or description of the Alert. |
| Entropy | The entropy value (between 0 and 1). |
| External Id | The external ID given by another management system to reference the Alert. |
| First Event Time | The time when the Alert's first Event was recorded. |
| Host | The source where the Alert originated. |
| Internal Last Event Time | The last time and date there was an internal change to the Alert. |
| Last Change | The last time and date there was a change to the Alert. |
| Last Event Time | The time when the Alert's last Event was recorded. |
| Manager | The system sending the Alert. |
| Owned By | The User that owns the Alert. |
| Significance | The Significance of an Alert (Collateral, Related, Impacting or Causal). |
| Situations | All of the Situations that the Alert is linked to. |
| Source Id | The unique name of the source being managed. |
| Status | The Alert status (Unassigned, Assigned, Acknowledged). |
| Type | The Alert type. E.g DBFail, HTTPDDown, LinkDown etc. |
Move View Columns
You can change the width of each column by hovering your mouse cursor over the column order and clicking and dragging it to increase or decrease the width.
To change the order of the columns, click the column title cell of the column you want to move and drag it to a new location in the top row. Two green arrows indicate if the move is valid:
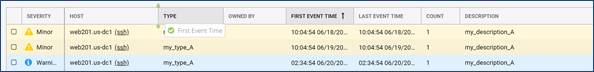
You can also configure the order in which the Alerts are shown by clicking the column title cell to rearrange them in ascending or descending alphabetical or numerical order.
For example, click the Severity column to arrange the Alerts in ascending or descending order of severity.
Alert Tools Menu
All other actions that can be performed to an Alert or group of Alerts can be done using the Tools menu or right-click menu.
This can be accessed by clicking Tools or by right-clicking the Alert list.
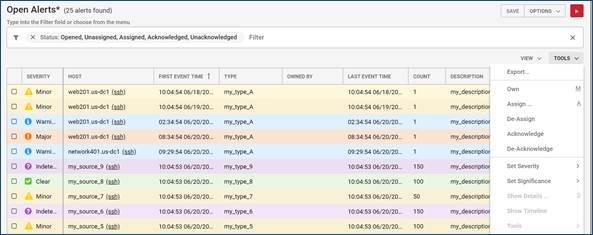
Select an alert or multiple alerts by checking the check boxes in the far-left column.
Next, click Tools to perform one of the following actions available in the Tools menu:
| Action | Options | Description |
| Export | Filename: String Format: · CSV (comma-separated values) · JSON (JavaScript object notation) Export: · All Rows · Selected Rows | Exports a row, multiple selected rows, or all rows in CSV or JSON format. |
| Own | — | Makes you the owner of an Alert or Alerts. |
| Assign | — | Assigns an Alert or Alerts to a user, subject to permissions. |
| De-Assign | — | De-assigns an Alert or Alerts from a user. |
| De-Acknowledge | — | De-acknowledges an Alert to indicate you are no longer responsible for it. |
| Set Severity | Critical Major Minor Warning Indeterminate Clear | Enables you to change the severity of an Alert or Alerts.
|
| Set Significance | Causal Impacting Related Collateral | Sets the relative significance of an Alert, initially calculated based on its entropy (a measure of the rarity or uniqueness of this alert) with 'Causal' being the most unique, and 'Collateral' being the least. |
| Show Details | — | Opens the Alert Details pop-up window with more information about the Alert. |
| Show Timeline | — | Displays the timeline view for the Alert showing you the time extent of the alert, from when it first began to its last change. |
| Tools | Server Tools… | Lists the client-side Alert tools that can be run. |
| Add to Situation… | — | Opens a new pop-up window. From here you can add the Alert(s) to a Situation. |
| Remove from Situation… | — | Opens a new pop-up window. From here you can remove the Alert(s) from a Situation. |
| Move to Situation… | — | Opens a new pop-up window. From here you can move the Alert(s) to a Situation. |
| Resolve… | — | Resolves an Alert and prompts you to submit an entry to the Journal thread of all Situations the Alert is a member of. |
| Close… | — | Closes an Alert. Once an Alert has been changed to a closed state it cannot be revived. |
Add Alerts to Situations
A single or multiple alerts can be added to a Situation if a User thinks they are related or it makes sense to do so.
To do this from the alert filter view such as My Alerts or Open Alerts, follow these steps:
1. Select the alert or alerts you want to add to a Situation by checking the check box(es) in the far-left column:
2. Right-click the alerts or click Tools to open the Tools menu and then click Add to Situation...
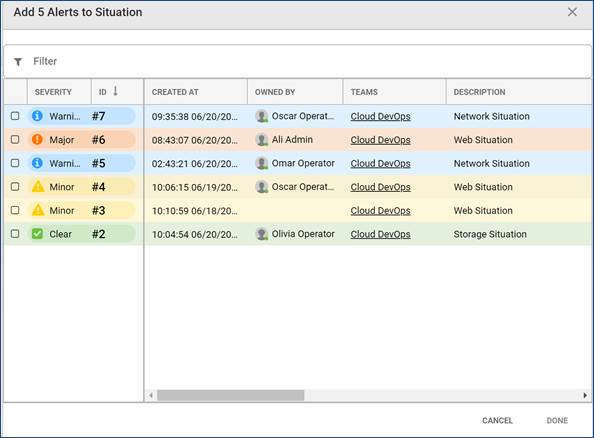
3. Use the Filter to find the relevant Situations and select the Situation or Situations to add the Alert(s) to. Click Done to continue.
Alert Workflow
Alerts can be assigned to different Cisco Crosswork Situation Manager users, owned by Administrators and added to Situations.
The standard method of working with Alerts is to have an Administrator who assigns Alerts to the Users within a team. An alternative is to have a single Administrator who owns Situations and deals with all of their associated Alerts.
The following sections outline the standard workflow that can be applied to both of these methods.
Assigned Alerts
Once an Alert has been assigned to you, you either receive a Notification or it appears in your My Alerts filter.
After identifying which alerts have the highest priority, typically the alert with the highest severity, the next step is to Acknowledge them to let others know that you are aware of it. A standard way of working would be to work through all of the days 'Critical' alerts and resolve those first before working on the days 'Major' and then 'Warning' alerts to prevent them becoming 'Critical' alerts.
To do this, right-click in the alert's row or tag it using the check box in the far-left column and then click Tools > Acknowledge.
Timeline
To access an alert's timeline, right-click it and select Show Timeline.
The timeline shows a graphical view of an alert and a breakdown of the events that were deduplicated to create the alert. It also displays the severity of each event and the times at which they occurred.
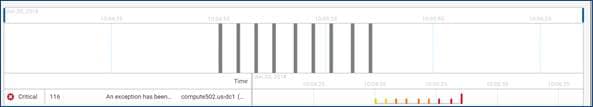
Click the Zoom In or Zoom Out options to focus in on a particular time period or group of events. Alternatively, use the blue sliders to focus in on an area of interest.
The severity of each event is indicated by the color of the line (e.g. the Events in the preceding screenshot are a mixture of indeterminate and critical Events).
Note: The alert's severity is defined by the severity of the latest event rather than the event with the highest severity.
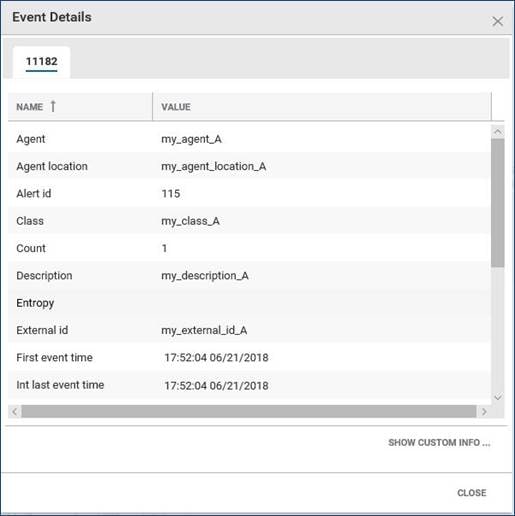
Click any of the colored lines for more information on any event in the timeline. This opens the Event Details window, which allows you to explore the forensic details of an event or events.
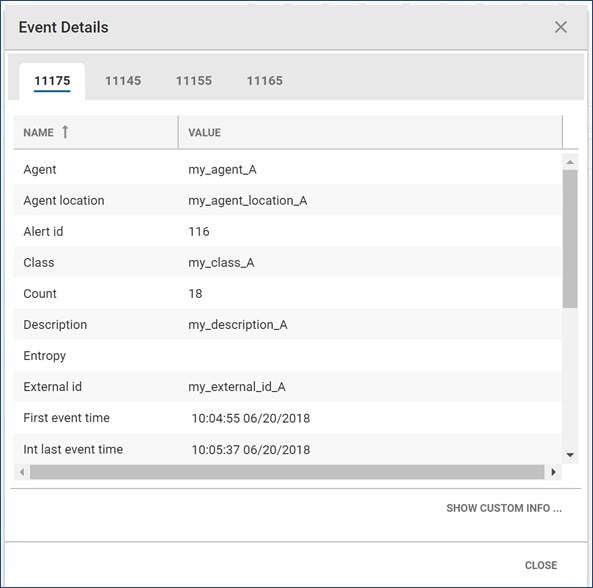
The individual column names and their descriptions are listed in the following table:
| Name | Description |
| Agent | The name of the monitor that detected the events. Frequently a sub-category of Manager. |
| Agent Location | The IP address or co-ordinates of the geographic location where the events were detected. |
| Alert Id | This is the numeric identifier given to the alert. |
| Class | The subcategory of the Agent. |
| Count | The number of times this alert has been counted. |
| Description | A text summary or description of the alert. |
| Entropy | The entropy value (between 0 and 1). |
| Event Id | The ID given to the event. |
| Event Time | The time of the event. |
| Event Type | The type of event. |
| First Event Time | The time of the first event that was recorded by Cisco Crosswork Situation Manager. |
| Internal Last Event Time | The time that the last event was recorded by Moogdb. |
| Last Event Time | The time of the last event that was recorded by the Agent. This may be set by the LAM or the Alert Builder. The default is when the LAM first registered the event. |
| Last State Change | The time of the last event state change. |
| Manager | The system sending the event. |
| Owner | The username of the user who owns the alert and its events. |
| Severity | The severity of the event. |
| Significance | The significance of the alert. |
| Source | The name of the source machine. |
| Source Id | The unique identifier for the source machine. |
| State | The state of the event. |
| Type | The alert type. E.g DBFail, HTTPDDown, LinkDown etc. |
Collaborate
Go to Collaborate in the Situation Room and share comments or ideas with your colleagues to find a resolution.
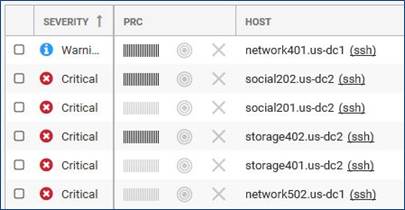
Ultimately, the aim is to resolve high severity alerts before you resolve the Situation. If anyone proposes a solution, this can be tested using Tools or going back to the My Alerts view and clicking the Host column to SSH into it.
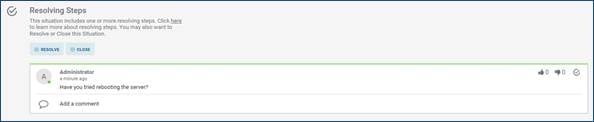
Resolving Steps
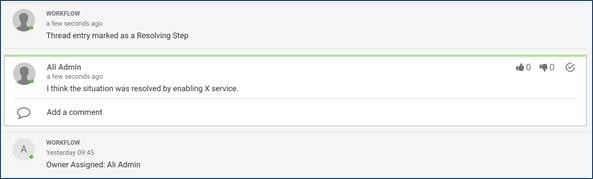
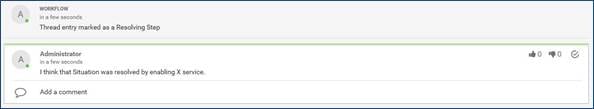
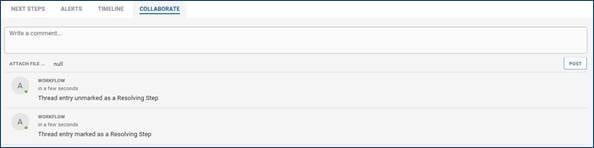
If you or another user finds a solution that fixes the problem, the comment should be marked as the Resolving Step. To do this, click the check icon next to the post in Comments or under Collaborate:
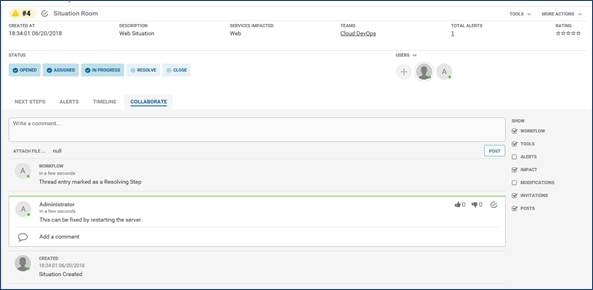
The comment that has been marked as the Resolving Step is highlighted with a green line. Now that a resolution has been found, the Situation can be resolved.
To do this, click the Resolve button under Status in the Situation Room. The 'Resolve Situation' pop-up window appears:
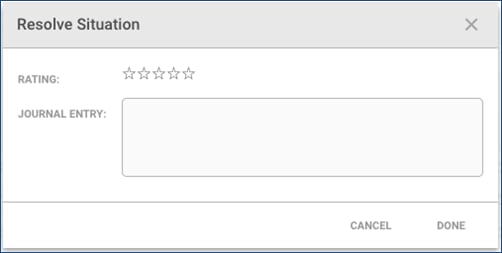
Add a star rating to indicate the relevance and quality of information given in the Situation along with a journal entry comment. Click Done to continue.
Work with Situations
After Cisco Crosswork Situation Manager has created a Situation from the Alerts from your monitoring systems, you can use various tools in Cisco Crosswork Situation Manager to resolve the Situations. When you resolve the Situation, you have the opportunity to provide feedback to help with the resolution of similar situations when they arise.
This topic guides you through the various steps in the workflow to resolve Situations.
How to Resolve Situations
The following workflow represents the typical steps to resolve a Situation. You may not need to execute every step for every Situation. As you gather more expertise with Cisco Crosswork Situation Manager, you develop your own workflow.
1. Check for Impacted Services in the Services Overview.
In the Cisco Crosswork Situation Manager workbench, the Services Overview section indicates which of your Services are impacted by Situations.
2. Click the Team Room name in the side menu to open your Team Room.
The Team room is a good place to collaborate with the colleagues in your Team to find a resolution to your Situations. Click the Team Room name in the side menu. The Team Room displays all recent activity such as Situations being assigned, new comments that have been posted and any Resolving Steps that have been created. You can also see which members of your Team are currently logged into Cisco Crosswork Situation Manager on the right side of the screen.
3. Click the Task Board tab to view Situations in a Kanban-style board.
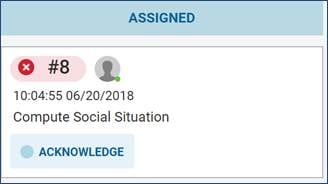
You can see which Situations have been assigned to you in the "Assigned" column.
4. Click Acknowledge on any Situation that has been assigned to you.
This changes the status to "In Progress" and alerts your team to the fact that you are working on a situation.
5. Click your assigned Situation.
The Situation Room opens to display key information about the Situation including:
■ The Situation status
■ The number of Alerts
■ Impacted services
■ Next steps to resolve the Situation
Check Impacted Services
You can prioritize which Situations to deal with first by checking for impacted services with the highest severity. Typically you should deal with services impacted by critical Situations first.
You can check for impacted services in Cisco Crosswork Situation Manager in three different ways: in the Services Overview, by creating a filter, and in the Services Impacted menu.
Services Overview
The Services Overview section displays any Services that are assigned to your Team or that are impacted by Situations assigned to your Team.
Important: To assign Services to your Team, go to System Settings > Security > Teams and add the required Services to your Service Filter.
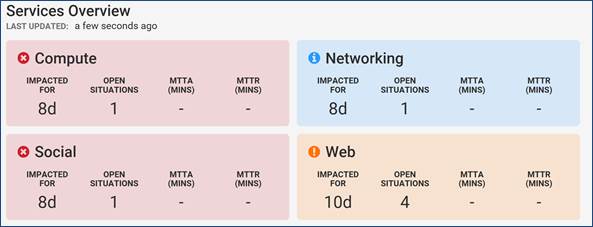
Each Service panel includes the amount of time it has been impacted for, the number of open Situations that are impacting it, the MTTA and the MTTR in minutes.
The color of the Service indicates the highest severity level of the Situations that are impacting it.
Note: This panel updates automatically every minute by default. Click the text alongside 'Last Updated' for the exact time the update took place.
Service Filter
Click any Service for more information about the Situations that are impacting it.
These Situations are displayed in a Situation filter, allowing you to identify those which you want to prioritize. For example: Those with the highest severity or number of high severity Alerts.
You can see which other Services each Situation is impacting by referring to the 'Services Impacted' column.
Services Impacted
A list of all Services that have been impacted appears in the side menu on the left side of the workbench.
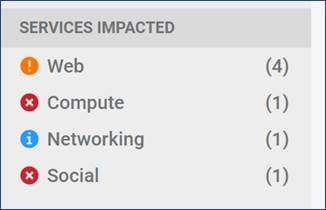
Click any of the Service names to view the Situations that are impacting it. Alternatively, click Services Impacted to view all Situations that are impacting your Services in a Situation Filter.
The Services Impacted link from the side menu opens all Situations that are impacting your system's services in a new Situation Filter:
This screen offers a useful overview of the Situations that are affecting the most of your Services and can help you identify and prioritize which Situations to deal with first. It also allows you to see the Situations that are impacting Services that are not associated with your team.
Work in a Team Room
The Team Room is the first place you should go for a general overview of the latest Situation activity in your team.
This is where you can discuss issues with team members and collaborate to find a resolution to alerts and Situations.
There are two key components to the Team Room screen: Collaborate and Task Board.
Collaborate
The Collaborate tab is where you can view the latest activity and communicate with members of your team to find resolutions to Situations.
You can post questions, ideas, general comments, and attach files that appear on the Collaborate news feed in chronological order.
Task Board
The Task Board is a Kanban-style board where you can see an overview of the team's Situations and their statuses.
This is a useful screen to see your assigned Situations and manage what work you have to do. It is also where Administrators can assign Situations to different users.
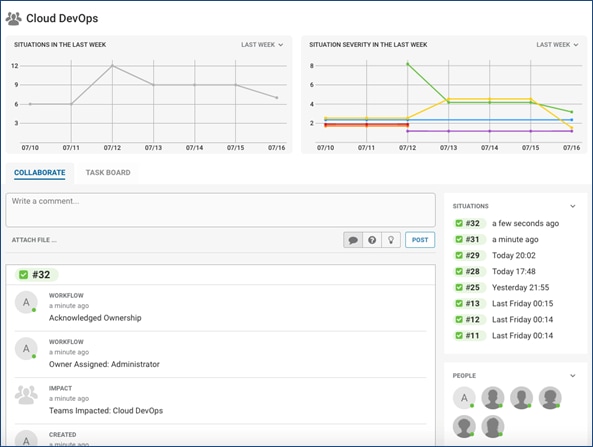
Team Insights
Team Insights shows Situation summary data and Situation Severity data from two time frames: the last week and the last day.
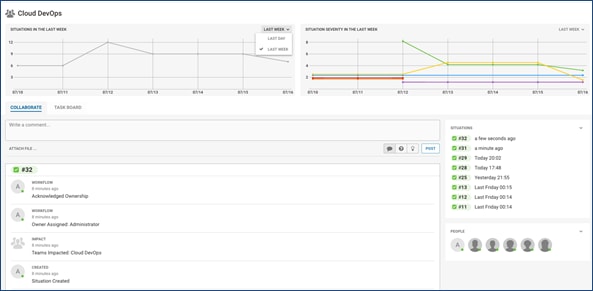
Use the drop-down to choose from the last week or the last day. The default is the last week.
Highlight a line in a graph with your mouse pointer. Dots denote data points.
Note: Cisco Crosswork Situation Manager collects data at a specific time in each 24-hour period and this may not reflect the highest number or severity of Situations during that period.
Monitor your Task Board
The Task Board is a Kanban-style board where you can see an overview of the Team's Situations, where they are in the workflow, how much work is in progress and in the queue.

This is a useful screen to see what work you and your teammates have to do. It is also where Administrators can assign Situations to different Users.
A Kanban board is a visualization tool that can be used to see an overview of your workload and optimize the flow of your work.
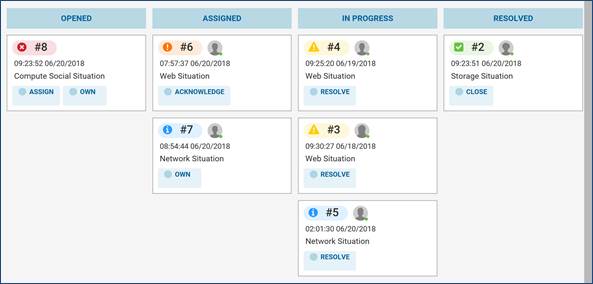
Navigation
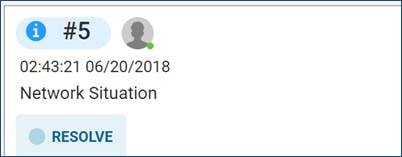
The Situations appear in columns arranged in order of status: opened, assigned, in progress, and resolved.
Each Situation appears with a colored pill-shaped marker displaying the Situation ID number, the severity color, the user who is assigned to the Situation, the time the Situation was created, the description, and the action that can be performed:
Task Board Flow
If you are a standard operator User, you can perform the following actions to Situations that have been assigned to you:
| Assigned -> | In Progress -> | Resolved |
|
|
|
|
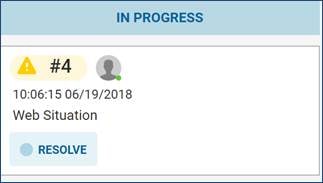
| Click Acknowledge to inform others you have seen the Situation and are investigating. This moves the Situation to In Progress. | Click Resolve when an initial resolution to the Situation or a Resolving Step has been found. This moves the Situation to Resolved. | Click Close if the resolution fixes the root cause and the moderator or end user is satisfied. This removes the Situation from the Task Board. |
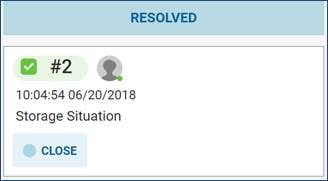
When resolving or closing a Situation, you can give it a Situation Rating and add a journal entry in the pop-up window as normal. Once a Situation is closed, it does not appear on the board.
Collaborate in a Team Room
The Collaborate tab is where you view the latest activity and communicate with members of your team to find resolutions to Situations.
Users can post questions, ideas, general comments, and attach files that appear on the Collaborate news feed in chronological order.
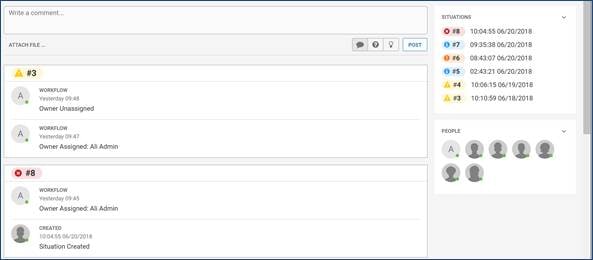
Navigation
The Situations listed on the right side of the screen are all of the Situations that are impacting services included in the team's service filter. The 'People' panel beneath that lists all team members who are currently logged into Cisco Crosswork Situation Manager.
Note: A team's Service Filter can be configured by a User with Administrator rights or higher. This can be found under System Settings > Teams > General.
There are several ways to view a Situation from the Collaborate screen. One way is to click the Situation ID in the Collaborate wall. Alternatively, click the View button in the top corner of each panel:
Both of these options open the Situation Room for the Situation.
Create a Comment
You can comment in a Team Room by clicking Write a comment… at the top of the screen and starting to type.
When you have finished, you can click one of the icons to indicate the type of comment you are posting. The speech bubble icon is for general comments, the question mark is for questions, and the lightbulb is for ideas.
Next, click Post to add the comment to the Collaborate wall. Alternatively, use the Ctrl+↵ or ⌘+↵ keyboard shortcut.
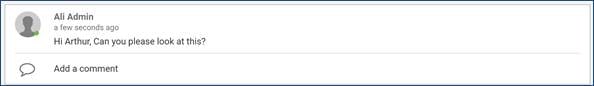
You can make additional comments in a comment thread. To do this, click Add a comment, type your message, and press Enter to submit.
You can up vote or down vote comments using the buttons in the top-right corner of the primary comment.
Note: You can only vote on Situation Room comment entries. You cannot vote on your own comments, only on comments made by other users.
Mark a Resolving Step
You can mark any suggestion from another user, such as tools that were run to resolve a Situation, as a 'Resolving Step'.
To do this, click the Resolving Step icon in the top-right corner of the comment. This highlights the comment with a green line:
The Resolving Step icon subsequently appears on any similar Situations. By default, similar Situations are deemed to be all those that share at least 50% of the same alerts.
Note: A comment can be deselected as a Resolving Step at any time by clicking the check icon again.
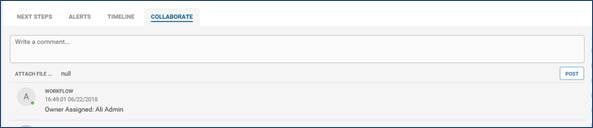
Attach a File
You can attach a file such as a screenshot, error message, or log file to any Collaborate wall. To do this, click Attach File... and select the file from any location on your local machine.
Next, create a comment as normal to accompany the attachment and then click Post.
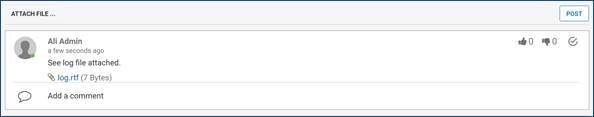
The attachment appears in blue text alongside the file size.
Identify Next Steps
You can identify the recommended actions to take with a Situation under Next Steps. This tab is open by default when you first look at a Situation.
The next steps depend on the current status of the Situation and may include similar Situations with Resolving Steps or the alerts that are most likely to be the root cause of the Situation.
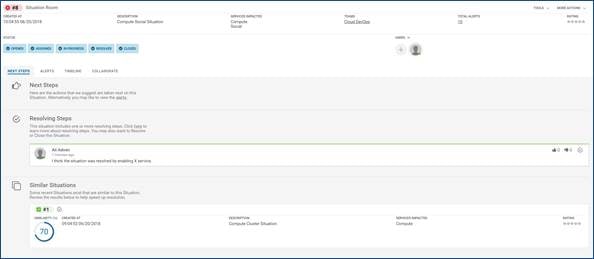
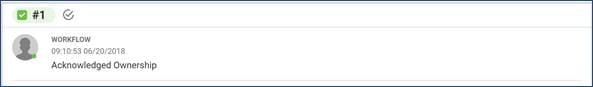
In the preceding example, the first required step is to Acknowledge the Situation. This can be done by clicking the Acknowledge button under 'Status' or Next Steps.
You can also see there is a similar situation with 70% similarity. If this had a Resolving Step, indicated by a check icon, you could click this to see what action was taken to resolve the similar Situation.
Probable Root Cause
If you have been training your Probable Root Cause model, you see up to three alerts likely to be the root cause of the Situation.
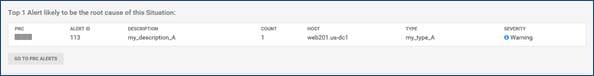
Click Go To PRC Alerts to view these alerts in more detail.
Note: There are no PRC Alerts in this section if:
■ You have not trained your model.
■ You do not have any Alerts with PRC equal to or greater than 50%.
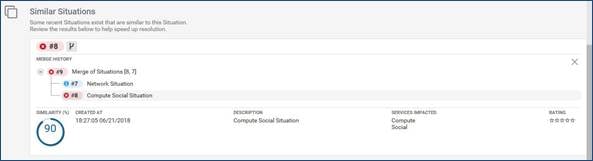
Similar Situations
Cisco Crosswork Situation Manager identifies if two or more Situations are similar and groups them in a subsection of Next Steps called Similar Situations.
You can use Next Steps to identify trends and reduce the number of escalations. For example, if a current Situation is similar to one that was previously resolved, the resolution information might be reuseable. Alternatively, if Situations recur at regular intervals, steps can be taken to prevent future occurrences.
Note: To generate similar Situations, Cisco Crosswork Situation Manager analyzes all Situations, calculates their similarity, and highlights those with a similarity of 50% or higher. This means at least half of the alerts are shared between two similar Situations.
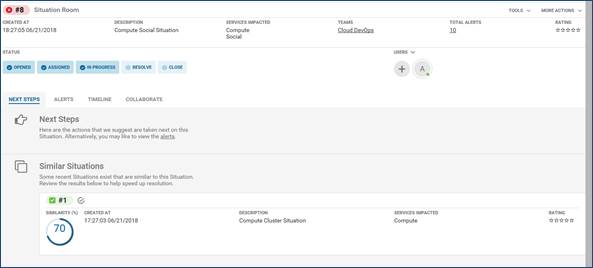
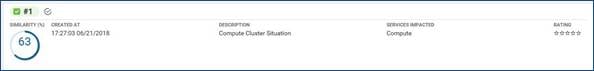
For each similar Situation, it displays the Situation ID, similarity (%), the created at time, a description, any impacted services, and the Situation Rating.
Click the date beneath 'Created at' for an exact time and date that the Situation was created. Click 'Description,' 'Impacted Services,' and 'Rating' to make edits.
Note: Only users with the correct Role permissions can made edits to ‘Description’ and ‘Impacted Services.’
Alternatively, click the Situation ID or View to open the Situation Room for the Similar Situation.
Merged Similar Situations
If a number of Situations share a high similarity and alerts, Cisco Crosswork Situation Manager merges them together automatically to create a new Situation.
Note: By default Cisco Crosswork Situation Manager carries out an automatic merge when Situations share a 70% similarity.
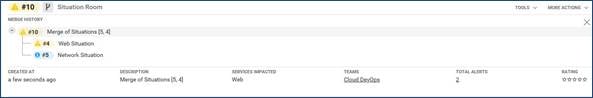
If a Situation has been merged automatically or manually there is a merge icon alongside the Situation ID:
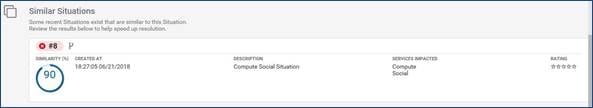
Click the icon to show or hide the merge history. In this example, Situation #8 had a 90% similarity so was merged into Situation #24.
Similar Situations with Resolving Steps
If a Similar Situation has a Resolving Step, this is indicated by the check icon:
Click the check icon to reveal any Resolving Steps, which are comments that appeared in the Collaborate tab that led to or provided a resolution.
Click the Resolving Step icon at the top of the panel again to close it. Alternatively, you can add a comment or a vote if it was helpful or not.
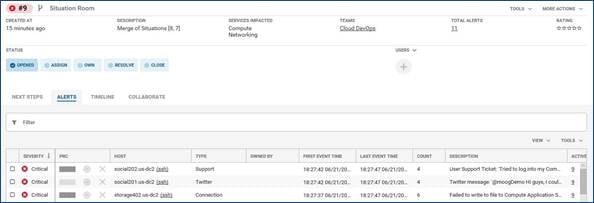
Situation Room
The Situation Room is the virtual meeting place for all users involved in finding the resolution to the Situation and its alerts.
This is where you spend the most time when you are investigating the root cause of an incident.
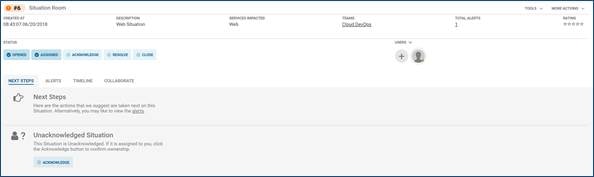
At the top of the Situation Room you can see when it was created, any impacted services, the Alerts it contains, and the rating it was given at resolution.
Situation Room Tabs
The Situation Room tabs at the bottom of the screen offer links to the Next Steps, Alerts, Timeline, and Collaborate, which can be followed in a logical order.
Note: Additional tabs linking to third-party tools can be added in the form of Situation Room plug-ins.
Next Steps
The Next Steps tab offers you a suggested action step to take in relation to the Situation.
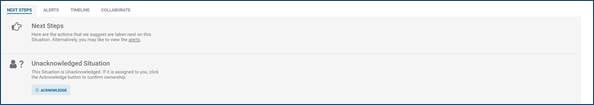
The suggestion depends on the status, if it has similar Situations, or if there are Resolving Steps.
Alerts
The Alerts tab is useful for looking at the Situation's individual associated alerts in more detail.
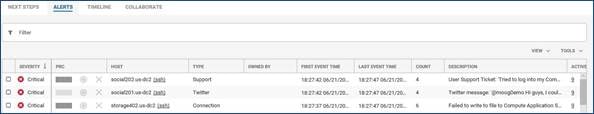
From here you can filter and identify the alerts of interest and then seek a resolution.
Timeline
The Timeline offers a powerful graphical view displaying the progression of a Situation with a breakdown of its associated Alerts in the order they occurred.
Alongside the Alerts, you can also inspect the markers where activity took place.
Collaborate
The final step is to collaborate with other users by looking at the comments and talking to colleagues.
The ultimate goal is to find a way to resolve the Alerts and subsequently the Situation.
Invite Users to the Situation Room
You can invite team members who you think might be able to help resolve a Situation using the + invite button. You can only invite users who are members of your team by default.
Type the name of the user you want to invite, add a note if required, and click Done. The invited user receives the invitation as a notification.
You can invite others users to a Situation Room only if you have been assigned to the Situation.
Note: You may only be able to invite members of your team to a Situation Room if your administrator has configured team access only.
Other Situation Room Actions
There are a number of other actions that can be performed using the Tools and More Actions drop-down menus on the top bar of the Situation Room.
Check Situation Alerts
You can look at the Situation's associated alerts from the Situation Room by clicking the Alerts tab.
From here you can filter and identify the alerts of interest, typically those with the highest severity or that are impacting services, and then seek a resolution.
View Unique Alerts
You can switch between viewing all alerts and all unique alerts using the View menu.
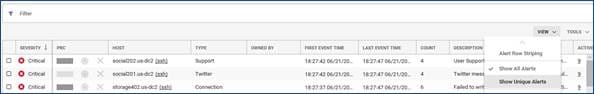
Click View and then either Show All Alerts or Show Unique Alerts to toggle between which group of alerts is displayed.
Mark Alerts for PRC
To mark individual Alerts for PRC:
1. Click the circular PRC icon to mark an Alert as a Root Cause Alert.
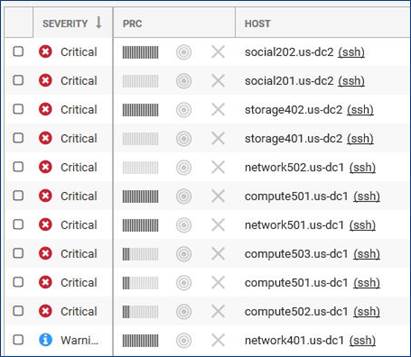
2. When selected, the PRC icon turns blue:
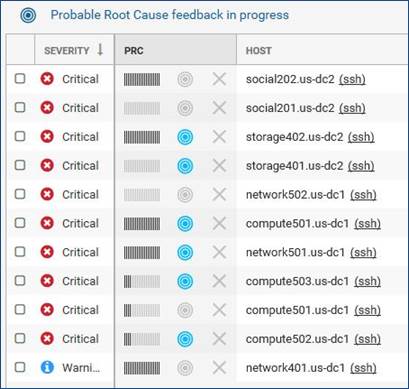
Cisco Crosswork Situation Manager also reports that PRC feedback is in progress.
3. If there are any alerts you know are not the root cause of the Situation, click the cross icon. This turns red when selected.
4. Click the Save button. The % PRC is indicated by the bars in the PRC column.
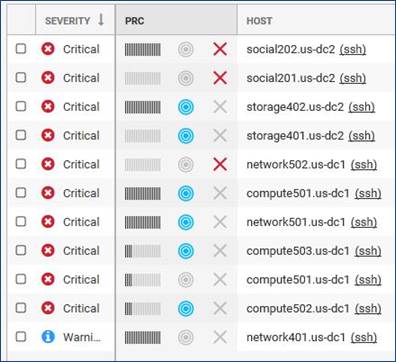
Note: If you do not know the status of an alert, do not label it. You do not have to label every alert; PRC is effective with consistent data.
5. Open another Situation and look at the alerts. The PRC column automatically populates with estimated PRC values based on the user feedback:
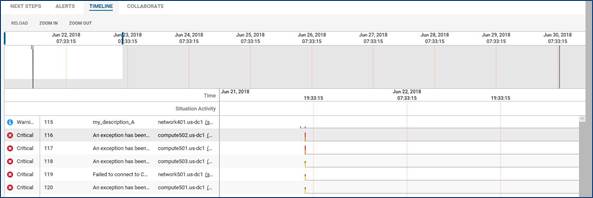
Analyze the Situation Timeline
The timeline offers a powerful graphical view displaying the progression of a Situation with a breakdown of its associated alerts in the order they occurred alongside key activity markers.
Use the timeline to analyze the Situation, see how it developed, and determine the hotspots where there are higher volumes of more severe alerts.
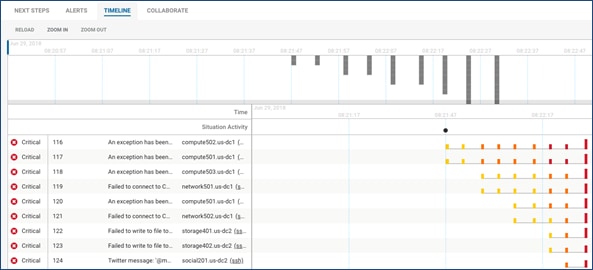
Note: Situation severity is determined by the highest severity of its alerts.
In the preceding example the Situation is critical because the fourth of six recorded alerts was critical, which was ultimately the highest severity.
Timeline Navigation
There are several components to the timeline tab that allow you to zoom in on a specific time, view Situation activity, and display when alerts occurred.
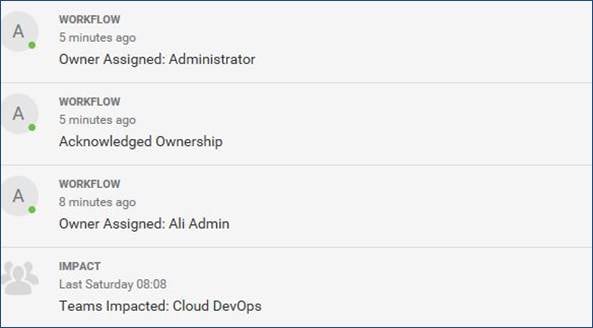
Situation Activity
The Situation Activity panel shows activity markers at times where different things happened following the creation of the Situation.
![]()
The number indicates how many Situations activities occurred. Click any of the activity markers for more details of what happened at that time.
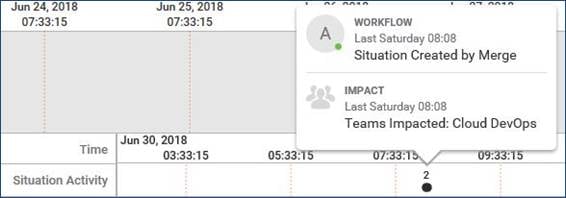
In the preceding example, the five activities were: the creation of the Situation itself, it impacted the Ops Team, the Situation custom info was changed, 15 further Alerts were added to the Situation, and then it was assigned to a User.
The activity marker icons differ depending on the type of activity that occurred.
Alerts and Event Details
The alerts are displayed in graphical form on the bottom of the Timeline tab, with each alert represented by a rectangular block the color of its severity.
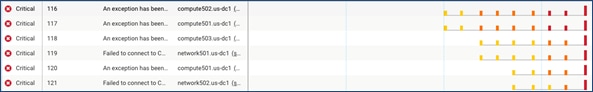
You can view the details of the events within each alert by clicking each block. This opens the Event Details window.
Note: You can open the Alert Details window by clicking the Alert ID.
In this example, alert 94 contains events 200 and 201, which were detected by a Network Monitor.
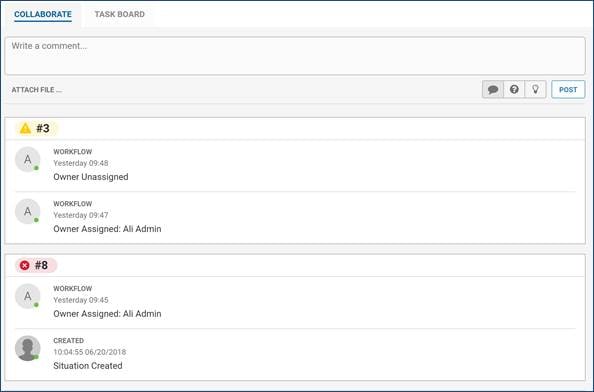
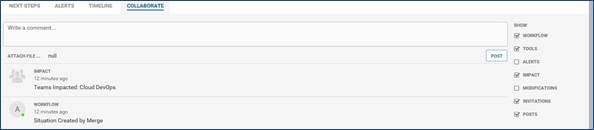
Collaborate on a Situation
The Collaborate tab is where you can talk to members of your team and collaborate with users in a chat environment to find a resolution.
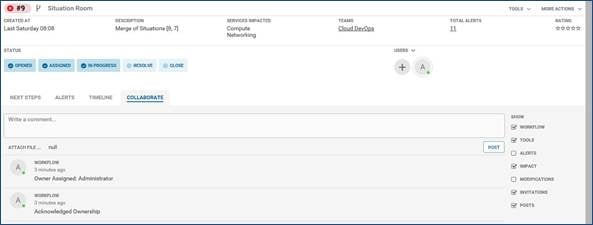
You can add comments, attach files, and view activity such as which teams are impacted and when the Situation was created or assigned to a user.
Navigation
You can view all previous comments and Situation activity by scrolling down to the bottom of the Collaborate view.
It works much like a social media news feed wall with the oldest comments and activity at the bottom and the latest at the top.
Custom Situation Room Tools
You can run a number of custom tools in the Situation Room that your admin has configured for you and your team.
These might include Client tools, URL tools, and tools triggered by ChatOps commands.
Run a ChatOps Tool
As well as comments, you can also run ChatOps tools to try and find a resolution to the issue.
Generic, Alert and Situation Server Tools, or Alert and Situation Client Tools can be run using the @moog or @bot command following by the configured ChatOps shortcut.
Note: ChatOps and Tools must be set up and configured by your Administrator.
If the ChatOps tool was successful in resolving the issue, it can be marked as a Resolving Step.
Mark a Resolving Step
If a user makes a suggestion that resolves the Situation or its alerts, it can be marked as a 'Resolving Step'.
To do this, click the Resolving Step icon in the top-right corner of the comment. This highlights the comment with a green line:
The Resolving Step icon subsequently appears on any Similar Situations.
Note: A Resolving Step can be removed at any time by clicking the icon again.
Use the Show Filter
The Show filter can be used to filter which types of activity and comments appear in the Collaborate tab.

The different types can be added or excluded by checking or unchecking the check boxes.
These types include: workflow, tools, alerts, impact, modifications, invitations, and posts.
Merge Situations
When you have two or more Situations that share a significant proportion of alerts or you believe stem from the same root cause, you may wish to merge them together into one Situation.
Similar Situations that share 70% of the same alerts are merged automatically by Cisco Crosswork Situation Manager. However, you can merge Situations manually from any of the Situation filter views and from a Situation Room.
Merge Two or More Situations
To merge Situations from a Situations view:
1. Select the Situations you want to merge by checking the check boxes in the far-left column.
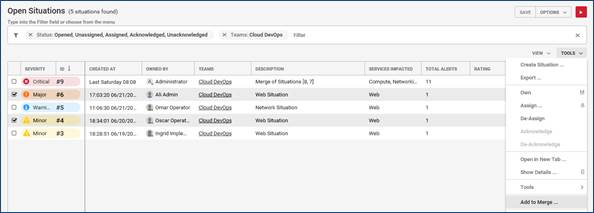
2. Click Tools or right-click the Situations to open the Tools menu.
3. Click Add to Merge... to open the Merge Situations panel displaying the selected Situations. This should appear at the top of the Situations view.
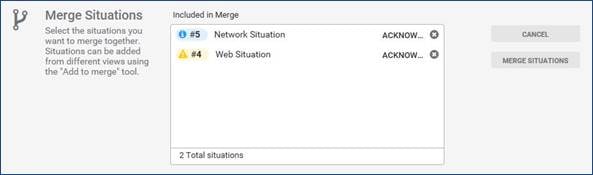
4. More Situations can be added by following the same steps, or they can removed by clicking the 'X' icons.
5. Click Merge Situations to complete the merge action. Once completed a message appears and provides a link to the new Situation.
Note: By merging Situations, you are combining all of Situations' alerts so the severity of the new Situation reflects the highest severity of those alerts.
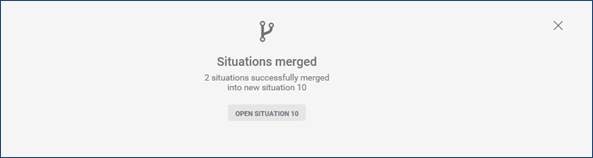
Click Open Situation to open the Situation Room for the new Situation. From here you can click the merge icon to show the Situation's merge history and see the Situations which were merged to create it.
Resolve Situations
A Resolving Step is the comment, suggestion, or action in the Collaborate section of a Situation Room or Team Room that has been marked as the solution to a Situation.
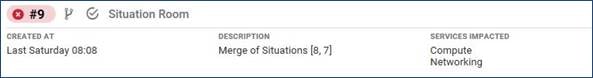
If a Situation has a Resolving Step, it is indicated by a check icon next to the Situation ID:
Mark a Resolving Step
If you find a comment or suggestion has helped to resolve the root cause of the Situation, you should mark it as a Resolving Step.
To do this, click the gray check icon in the top-right corner of the comment:
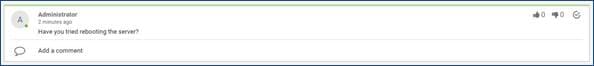
When a comment has been marked as a Resolving Step, a green line appears along the top of the comment to highlight it.
It is also pinned under the Next Steps in the Situation Room.
Note: Multiples comments can be marked as the Resolving Steps. It doesn't have to be a singular comment or action.
Other users can subsequently approve or disapprove of the Resolving Step using the upvote and downvote icons. The number next to each icon indicates its number of votes.
Unmark a Resolving Step
A comment that has been made a Resolving Step can be unmarked at any point.
To do this, click the check icon on the comment under Next Steps or Collaborate. This action appears on the Collaborate wall in the Team Room.
Resolve a Situation
A Situation can be resolved once a Resolving Step has been found.
To do this, click the Resolve button under Status in the Situation Room or change its status on the Team Room Task Board. The 'Resolve Situation' pop-up window appears:
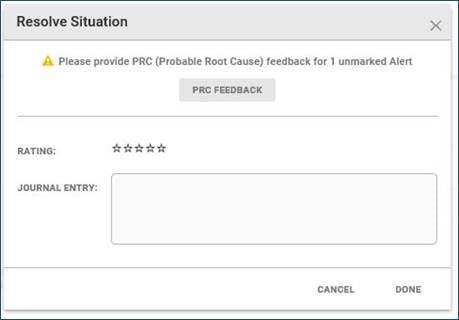
If Cisco Crosswork Situation Manager warns you that you have unmarked PRC Alerts, click the Mark Alerts button to return to the Alerts list and mark the appropriate Alerts.
Click the stars to give it a star rating out of five to indicate the relevance and quality of information given in the Situation along with a journal entry comment*.
*Note: It is important to reflect an accurate rating, particularly if you are using the Feedback Sigaliser, which takes information such as Situation ratings into account.
When you have entered your rating and journal entry, click Done to continue.
Rate a Situation
You can rate the relevance and quality of the information given in a Situation each time you resolve one by giving it a star rating between 1 and 5.
Each Situation rating is always followed by a journal entry or comment, where you can provide any additional information.
Ratings can be given directly from the Situation Room or when resolving or closing a Situation from any Situation filter or from the Task Board.
Note: It is important to reflect an accurate rating, particularly if you are using the Feedback Sigaliser, which takes information such as Situation ratings into account.
For example, the default rating threshold for Feedback Sigaliser is 3, so it learns from any Situations with a rating of 3 stars or more.
Rate a Situation
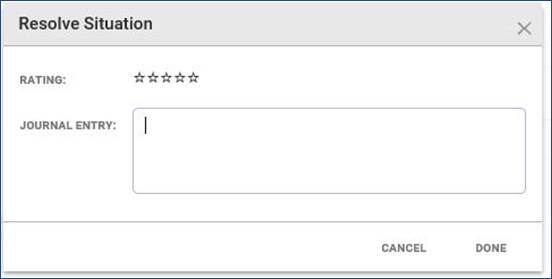
When resolving a Situation from either a filter or the Task Board, the 'Resolve Situation' pop-up window is displayed.
Click the appropriate star rating depending on how relevant or accurate the Situation was. The Situation rating scores are:
| Rating | Definition |
| - | Not yet rated |
| * | Bad |
| ** | Poor |
| *** | Adequate |
| **** | Good |
| ***** | Excellent |
Next, type in the 'Journal Entry' box to provide a comment about why the Situation was resolved or closed and a description of the resolution, if applicable. This can be as long as required.
When you have finished writing the entry, click Done to continue.
Take Additional Actions
You can use the menus and icons at the top of the Situation Room in Cisco Crosswork Situation Manager to perform additional actions on a Situation.
Tools
The Tools menu links to any Client Tools, General Server Tools, and Situation Server Tools that have been set up by your administrator.
Client tools use Situation and Alert data to carry out actions through a specified URL. Generic, Alert and Situation Server Tools allow a user to execute a utility on a remote host.
More Actions
There are a number of actions under the More Actions menu:
| Action (Hotkey) | Description |
| Show details… | Opens the Situation Details pop-up window. |
| Own (M) | Makes you the owner of the Situation and automatically acknowledges the Situation. |
| Assign (A) | Allows you to assign the Situation to a user. |
| De-Assign | De-assigns the Situation from a user. |
| De-Acknowledge | De-acknowledges the Situation. |
| Add to Merge… | Adds the Situation to the merge panel (where multiple Situations can be merged). |
| Resolve… | Opens the Situation Rating dialog where you can resolve the Situation. |
| Close… | Opens the Situation Rating dialog where you can close the Situation. |
| Reopen… | Reopens the Situation if it has been resolved or closed. |
Only users with the correct permissions can 'Own' or 'Assign' a Situation.
Situation Status
The Situation status shows the Situation's workflow journey. The highlighted item furthest to the right indicates the current status. For example, the status for the following Situation is "In Progress":
![]()
Clicking any of the subsequent statuses or actions in the row lets you change the Situation's status or perform an action.
When Cisco Crosswork Situation Manager creates a Situation, it is "Opened" by default. Then someone assigns it to a user who acknowledges it. When the user begins work, they update the status to 'In Progress'. When they have solved the issue, they mark it as 'Resolved'. Subsequently, someone can close the issue. The following table describes the Situation statuses:
| Status | Description |
| Opened | The Situation is open but has yet to be owned or assigned to a user or team. |
| Assigned | The Situation has been assigned to a user but has not been acknowledged. |
| In Progress | The Situation has been acknowledged and is being worked on. |
| Resolved | The Situation has been resolved. This is an internal status that is used when the operator believes they have found a resolution to the Situation. |
| Closed | The Situation has been closed. This is used when the resolution has been confirmed by the person or system who reported the issue and they are satisfied with the resolution. |
| Dormant | The Situation has been merged into a newer Situation. The older Situation adopts the dormant status. |
ChatOps
The ChatOps feature enables Cisco Crosswork Situation Manager users to run tools, such as executing utilities on remote hosts, from the Collaborate section of a Situation Room. This is useful when collaborating to resolve a Situation.
Tools run by ChatOps include Generic, Alert and Situation Server tools, as well as Alert and Situation tools.
Note: Your administrator must first configure both your tools and the ChatOps shortcuts in the System Settings.
Run a ChatOps Tool
To run ChatOps from Collaborate, you must start a new entry and type @moog or @bot and a drop-down menu of available tools appears:
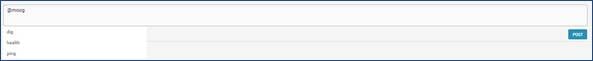
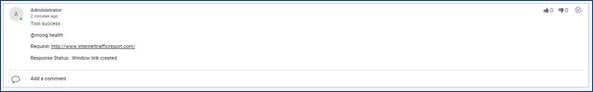
Scroll through the tools or start typing to find the required tool. Once you have found the one you want to run, press Enter or Tab to continue.
If the tool ran successfully, a message appears in green stating “Tool success”:
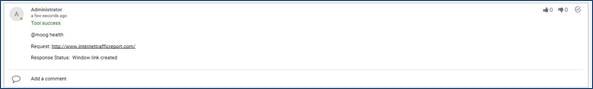
For certain tools, the diagnostic results appear as a comment under that entry and can be seen by all collaborators and team members.
If the tool did not run successfully, either because it was not configured properly or there was an error, you can expect an error response.
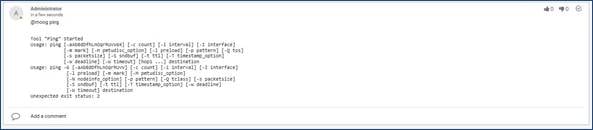
If the ChatOps tool was successful at resolving the root cause of the incident, it should be marked as a Resolving Step.
Advanced Usage
Filter Search Data
You can search for specific Alerts, Situations, and Impacted Services in Cisco Crosswork Situation Manager using filters.
The default filter views that can be accessed from the workbench are Impacted Services, My Situations, Open Situations, My Alerts, and Open Alerts.
There are two filter types: Basic Filter and Advanced Filter. Click the funnel filter icon to open the drop-down menu and switch between the filter types.

Note: We recommend that you use the Basic Filter in most cases. If you want more flexibility or need to filter for something more complex, use the Advanced Filter.
Create a Basic Filter
To use the Basic Filter, click in the "Filter" bar and a drop-down menu appears with available fields.
Select a field and any values as required then click Apply or click away from the menu. Repeat this for as many fields as you want to add to your filter.
Alternatively, type the name of the fields you want to apply to the filter. After you have entered one or more fields, click away from the menu to apply the filter.
Alert Column Parameters
You can use the columns and operators displayed in the following tables in your Basic Filter:
| Column Display Name | Associated Operators |
| Active Situations | IN |
| Alert Id | > >= < <= != = |
| Agent Name | MATCHES |
| Agent Host | MATCHES |
| Class | MATCHES |
| Count | > >= < <= != = |
| Description | MATCHES |
| Entropy | > >= < <= != = |
| External ID | MATCHES |
| First Event Time | >= AND <= |
| Host | MATCHES |
| Internal Last Event Time | >= AND <= |
| Last Change | >= AND <= |
| Last Event Time | >= AND <= |
| Manager | MATCHES |
| Owned By | IN |
| Severity | IN |
| Significance | IN |
| Situations | IN |
| Source ID | MATCHES |
| Status | IN |
| Type | MATCHES |
Situation Column Parameters
| Column Display Name | Associated Operators |
| Category | MATCHES |
| Created At | >= AND <= |
| Description | MATCHES |
| First Event Time | >= AND <= |
| ID | > >= < <= != = |
| Last Change | >= AND <= |
| Last Event Time | >= AND <= |
| Owned By | IN |
| Participants | > >= < <= != = |
| Process Impacted | CONTAINS |
| Scope Trend | >0 <=0 |
| Services Impacted | CONTAINS |
| Sev Trend | >0 <=0 |
| Severity | IN |
| Status | IN |
| Story | > >= < <= != = |
| Teams | IN |
| Total Alerts | > >= < <= != = |
| User Comments | > >= < <= != |
Create an Advanced Filter
The Advanced Filter is for complex queries and operates like the Basic Filter but uses Cisco's SQL-based filter query language.
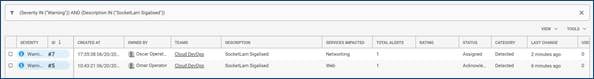
To show all Situations with 'Severity' as 'Warning' and 'Description' as 'SocketLam Sigalised', the correct syntax is:
(Internal Severity IN ("Warning")) AND (Description MATCHES "SocketLam Sigalised")
For more information on the query language syntax, see the tables of available operators and the following examples.
Pause Alerts and Situations
Click the Pause button to temporarily stop Alerts or Situations from being added to the Alert or Situation view.
Note: When paused, Cisco Crosswork Situation Manager does not update the list with the latest data unless you apply a new filter that triggers a one-time load of data.
After any edits have been made, the live feed of data can be reactivated by clicking the Play button.
Advanced Filter Syntax
The Advanced Filter query syntax can be used to create more complex filters for Alerts and Situations.
This syntax uses column display name parameters alongside common query operators used in filters. The column parameters and their associated operators are listed in the following sections.
Note: The Advanced Filter query syntax uses the display column names (those shown in the UI) rather than the database column names.
Alert Column Parameters
| Column Display Name | Associated Operators |
| Active Situations | IN CONTAINS = != |
| Alert Id | > >= < <= != = IN |
| Agent Name | MATCHES = != |
| Agent Host | MATCHES = != |
| Class | MATCHES = != |
| Count | > >= < <= != = |
| Description | MATCHES = != |
| Entropy | > >= < <= != = |
| External ID | MATCHES = != |
| First Event Time | > >= < <= |
| Host | MATCHES = != |
| Internal Last Event Time | > >= < <= |
| Last Change | > >= < <= |
| Last Event Time | > >= < <= |
| Manager | MATCHES = != |
| Owned By | IN = != |
| Severity | IN = != |
| Significance | IN = != |
| Situations | IN CONTAINS = != |
| Source ID | MATCHES = != |
| Status | IN = != |
| Type | MATCHES = != |
Situation Column Parameters
| Column Display Name | Associated Operators |
| Category | MATCHES = != |
| Created At | > >= < <= |
| Description | MATCHES = != |
| First Event Time | > >= < <= |
| ID | > >= < <= != = IN |
| Last Change | > >= < <= |
| Last Event Time | > >= < <= |
| Owned By | IN = != |
| Participants | > >= < <= != = |
| Process Impacted | IN CONTAINS = != |
| Scope Trend | >0 <=0 |
| Services Impacted | IN CONTAINS = != |
| Sev Trend | >0 <=0 |
| Severity | IN = != |
| Status | IN = != |
| Story | > >= < <= != = |
| Teams | IN CONTAINS = != |
| Total Alerts | > >= < <= != = |
| User Comments | > >= < <= != |
The associated operators are described in the following tables.
Comparison Operators
| Operator | Description | Example | Result |
| = | Equal to | Alert ID = 120 | Alerts that have an Alert Id of 120. |
| <> | Not equal to | Alert ID <> 120 | Alerts that do not have an Alert Id of 120. |
| > | Greater than | ID > 100 | Situations where the Situation Id is greater than 100. |
| < | Less than | ID < 100 | Situations where the Situation Id is less than 100. |
| >= | Greater than or equal to | ID >= 100 | Situations where the Situation Id is greater than or equal to 100. |
| <= | Less than or equal to | ID <= 100 | Situations where the Situation Id is less than or equal to 100. |
Literal Operators
| Operator | Description | Example | Result |
| ' ' or " " | Single or double quotations indicate the start and end of a string value | description = "test" | Situations with 'test' as the description. |
| ( ) | List of items | teams = (1,2,3) | Situations that are assigned to teams 1, 2 and 3 (and only 1, 2 and 3). |
Logical Operators
| Operator | Description | Example | Result |
| AND | AND allows the existence of multiple conditions | ID < 100 AND queue=4 | Situations where the Situation Id is less than 100 and the queue is 4 (both must be true). |
| OR | OR is used to combine multiple conditions | ID < 100 OR queue=4 | Situations where either the Situation Id is less than 100 or the queue is 4. |
| NOT | Reverses the meaning of the logical operator used. E.g. NOT IN, IS NOT NULL etc. | queue NOT IN (1,2,3) | Situations where the queue is not 1, 2 or 3. |
Other Operators
| Operator | Description | Example | Result |
| IN | Compares a value to a list of specified values | queue IN (1,2,3) | Situations where the queue is 1, 2, or 3. |
| IS NULL | Compares with a NULL value | queue IS NULL | Situations where there is no queue. |
| MATCHES | Matches the regular expression | description MATCHES "test" | Situations where the description matches the regular expression "test". |
| ANY_MATCH | Any matches of the regular expression | teams ANY_MATCH "team[0-9]+" | Situations where one of the teams names match the regular expression team[0-9]+. |
| ALL_MATCH | All matches of the regular expression | teams ALL_MATCH "team[0-9]+" | Situations where all of teams names match the regular expression team[0-9]+. |
| CONTAINS | Contains the value | teams CONTAINS (1,2,3) | Situations where the teams contain 1, 2, and 3. |
Create an Advanced Filter
When creating an Advanced Filter, it should contain at least one column name, an associated operator, and a value. As a general rule, the column name should always be to the left of the operator.
Important: If the column name or the value contains a space, it must be surrounded by single or double quotation marks (both " " and ' ' are accepted). This applies to columns such as External ID, Last Event Time, Last Change, Scope Trend, and so on. For example, 'External ID' MATCHES 01 or "External ID" MATCHES 01 are both valid.
It is also important to note that column names are case insensitive but the values are case sensitive. For example, 'severity' = 'Critical' is valid but 'severity' = 'critical' is not.
If the syntax is incorrect or invalid, the filter bar flashes, as follows:
For reference, see the following examples and screenshots.
Example 1
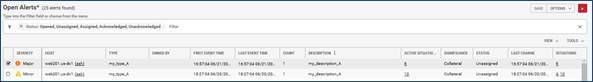
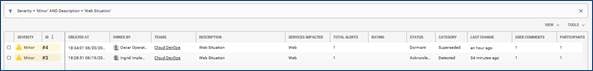
Severity = 'Minor' AND Description = 'Web Situation'
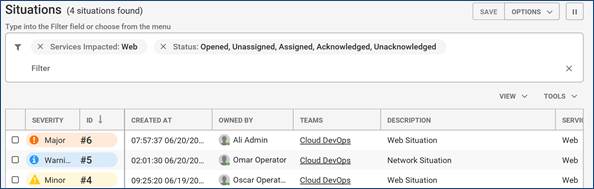
In this example, the filter shows all Alerts with 'Minor' severity and with the description 'Web Situation':
Example 2
Severity = 'Critical' OR (Severity = 'Major' AND description = 'SocketLam Sigalised')
In this example, the filter shows all Alerts with 'Critical' or 'Major' severity and with a type of 'SocketLam Sigalised':
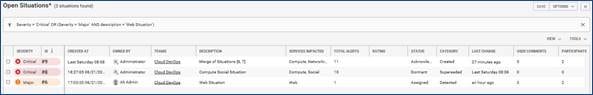
Example 3
Type MATCHES 'Anomalyflag' AND Count = 1
In this example, the filter shows all Alerts that match the 'Anomalyflag' type and have a count of 1:
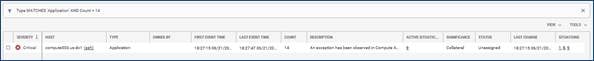
Quick tip: If you want to create a filter where the owner is empty, enter 'Owned By' = 'Moog'.
Schedule Maintenance Downtime
Maintenance Schedule is a useful tool when you have a scheduled outage and you want to reduce noise and prevent new Situations from being created.
During a maintenance window, Events continue to be correlated into Alerts and labeled as 'in maintenance', but you can choose not to group them into Situations. If an Alert under a maintenance schedule receives an Event, it is tagged as such.
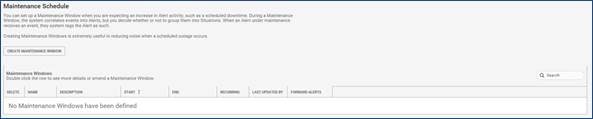
Create a Maintenance Window
Click Create Maintenance Window to create a new window:
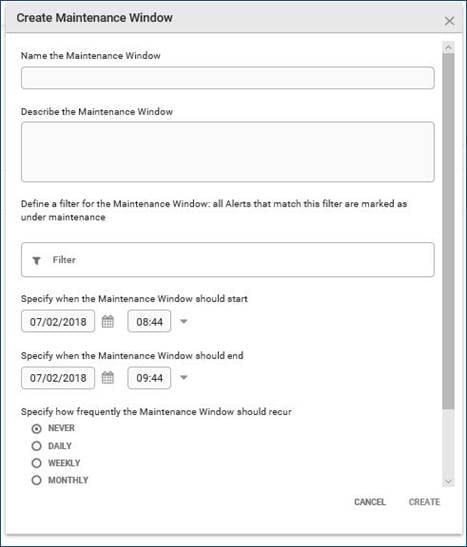
| Field | Input | Description |
| Name the Maintenance Window | Mandatory String | A text name for the new Maintenance Window. |
| Describe the Maintenance Window | Mandatory String | A description of the new Maintenance Window. |
| Define a filter for the Maintenance Window | — | Defines a filter to target specific Alert or larger group of Alerts. |
| Start date and time | Date/Time | Sets the start time and date of the new Maintenance Window. |
| End date and time | Date/Time | Sets the end time and date of the new Maintenance Window. |
| How frequently the Maintenance Window should recur | Never Daily Weekly Monthly | Selects whether the Maintenance Window never recurs or recurs on a daily, weekly, or monthly basis. |
| Allow Situation Membership for Alerts under Maintenance | Boolean | Allows Alerts created during a maintenance schedule to be included in Situations. By default, Alerts under maintenance are omitted from Situations. |
Note: Historical, expired, and manually deleted windows are not displayed here. Administrators can edit one of the displayed windows by double-clicking it.
Cisco and the Cisco logo are trademarks or registered trademarks of Cisco and/or its affiliates in the U.S. and other countries. To view a list of Cisco trademarks, go to this URL: www.cisco.com/go/trademarks. Third-party trademarks mentioned are the property of their respective owners. The use of the word partner does not imply a partnership relationship between Cisco and any other company. (1110R)
© 2018 Cisco Systems, Inc. All rights reserved.
 Feedback
Contact Cisco
- Open a Support Case

- (Requires a Cisco Service Contract)