- About this Guide
- Cisco Service Control Overview
- Getting Started
- Using the Cisco Service Control Application Reporter
- Managing Report Instances
- Working with Reports
- The SCA Reporter Command-Line Interface
- Installing and Upgrading SCA Reporter Templates
- Troubleshooting
- SCA Reporter as a Tool in the SCA BB Console
- SCA Reporter Templates
Cisco Service Control Application Reporter User Guide, Rel 3.5.0
Bias-Free Language
The documentation set for this product strives to use bias-free language. For the purposes of this documentation set, bias-free is defined as language that does not imply discrimination based on age, disability, gender, racial identity, ethnic identity, sexual orientation, socioeconomic status, and intersectionality. Exceptions may be present in the documentation due to language that is hardcoded in the user interfaces of the product software, language used based on RFP documentation, or language that is used by a referenced third-party product. Learn more about how Cisco is using Inclusive Language.
- Updated:
- April 20, 2010
Chapter: Working with Reports
- Information About Report Actions
- Filtering Report Templates and Instances
- Generating Reports
- Managing the Chart Items Hierarchy
- How to View Reports
- Adjusting the Chart Display
Working with Reports
After you have created and defined a report instance, you can generate reports from the report instance.
You can:
• Display reports in chart or tabular form
•Adjust the chart display
•Export the chart display and the report data
•Information About Report Actions
Information About Report Actions
The views found on the SCA Reporter display menu items. Some commonly used actions have icons for easy navigation.
The actions and their icons are described in Table 5-1.


 icon is displayed while system tasks are running.


Filtering Report Templates and Instances
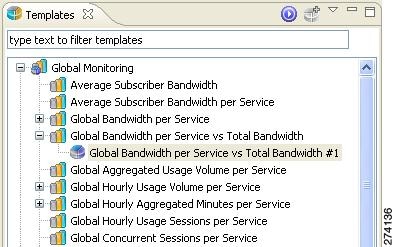
Report templates and instances can be filtered so that only specific templates and instances are displayed in the Templates view.
How to Filter Report Templates and Instances
Step 1 In the Templates view, enter a word, phrase, or more complex expression in the field.
The templates containing the text entered are displayed.
How to Clear the Filter
Step 1 In the Templates view, click  (Clear).
The filter is cleared and all templates and instances are displayed in the Templates view.
Generating Reports
You can generate a report from an existing, defined report instance. Report instances are found in the Templates view. You can duplicate, modify, rename, or delete the report instances and you can add report instances to the Favorites view (see Managing Report Instances, page 4-1). You can generate multiple reports; you can put the generate process in the background while working on other reports.
Some types of reports cannot be generated using data collected from an SCE platform running in asymmetric routing classification mode.
You can define and generate reports using the SCA Reporter Command-Line Interface (CLI). You can also use the CLI to pre-schedule reports. (See The SCA Reporter Command-Line Interface, page 6-1.)
•How to View Report Types that can be Generated in Asymmetric Routing Classification Mode
•How to Generate a Report When a Report Instance is Selected
•How to Generate Multiple Reports
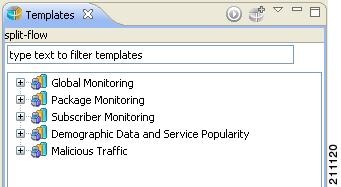
How to View Report Types that can be Generated in Asymmetric Routing Classification Mode
Step 1 In the Templates view, from the drop-down menu, select View Filter >split-flow.
Template groups whose report instances cannot be executed for asymmetric routing classification mode data are hidden.
How to Generate a Report When a Report Instance is Selected
Step 1 In the Templates view, select a report instance.
The Properties view displays the report instance properties.
Step 2 Click  ( Execute ).
The report is generated and is displayed in a new report view.
The Properties view displays the chart display properties.
How to Generate Multiple Reports

Note The maximum number of reports that can be generated simultaneously is configurable. If you select more report instances than this maximum values, the generation of some of the reports will be queued.
Step 1 From the Templates view, select the report instances while pressing Ctrl.
The selected report instances are highlighted.
Step 2 Click ( Execute ).
A Progress dialog box appears while reports are being generated.
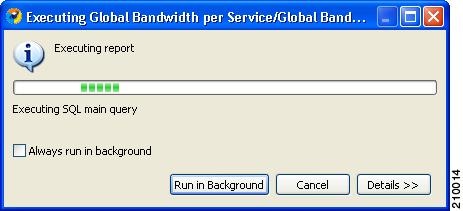
Step 3 Select a further action to take.
Do one of the following:
•Wait until the system task status at the bottom right corner of the SCA Reporter indicates that report generation is complete.
While the reports are being generated, the system task status shows:
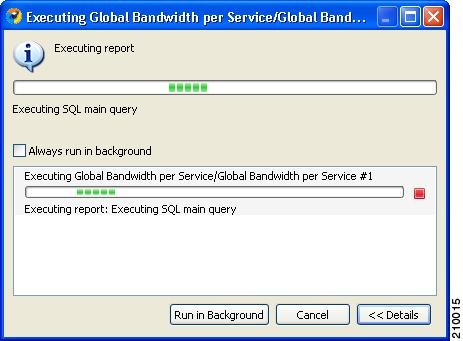
•Click Details.
The status of all reports that are being generated is displayed.
•Click Run in Background.
Report generation continues running in the background. When it finishes, each report is displayed in a separate report view.
•Click Cancel.
You can cancel a running report generation. It can take the Database Server a short time to acknowledge a cancel request, but you can move the cancelled report to the background and continue your work uninterrupted.
Managing the Chart Items Hierarchy
When reports are generated, the Hierarchy view displays a hierarchy of all the chart items included in the report.
There are two modes in which the tree structure can display the hierarchy:
•Service popularity—Configures the hierarchy according to significance. The chart item creating the most significant traffic is first in the hierarchy and the chart item with the least significant traffic is last in the hierarchy.
•Configured services tree—Configures the hierarchy according to the defined policy tree.
Note The Hierarchy availability depends on the report type. For example, pie charts have no hierarchy
How to Configure the Hierarchy Mode
Step 1 Generate a report.
Step 2 To view the hierarchical tree in configured services tree mode, click  (based on configured services tree).
The hierarchy is configured according to the service policy.
The chart is refreshed to reflect the hierarchy.
Step 3 To view the tree in service popularity mode, click  (based on service popularity).
The hierarchy is configured according to traffic weights.
The chart is refreshed to reflect the hierarchy.
Manipulating the Hierarchy
Once a report is generated, you can manipulate the chart items in the Hierarchy view in order to view a subset of the data included in the report. When the hierachy is manipulated, the report is automatically refreshed to reflect the changes. You can perform the following actions:
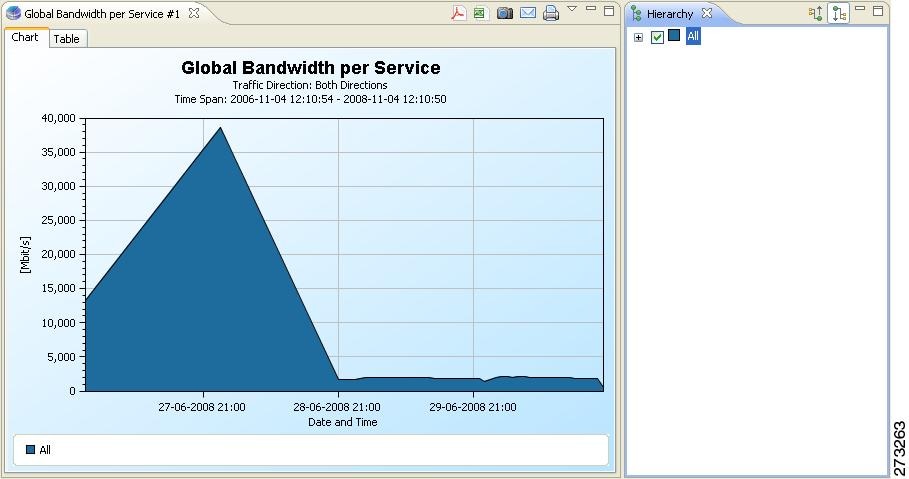
•Viewing only the parent chart items—You can contract the parent nodes so that the report displays only the parent chart items without identifying the specific children.
Note When a parent node is contracted, the parent node value is an aggregation of all the values of its children nodes.
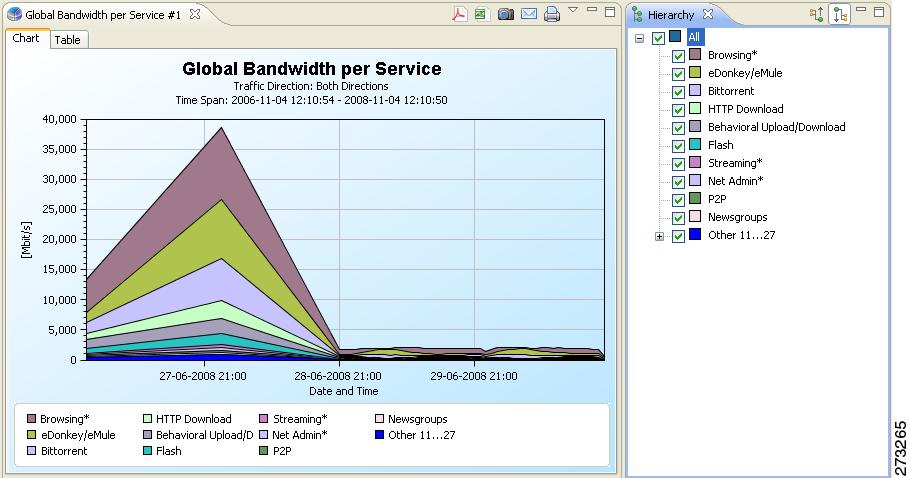
•Expanding the parent chart items—The parent nodes can be expanded in order to drill down and identify all the specific chart items included in the parent.
Note In service tree based mode, if a parent chart item has a child that is not assigned a global usage counter, when the parent is expanded, both the parent and the child chart items appear on the chart.
•Unchecking chart items—You can uncheck chart items in the hierarchy to remove them from the report.
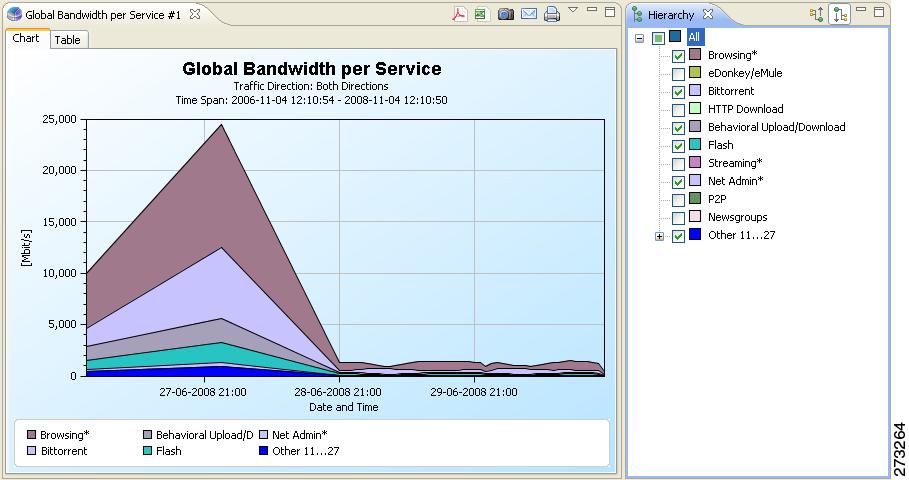
•Checking chart items—You can check chart items in the hierarchy to add them to the report.
Note When checking or unchecking a parent node, all the children mirror the parent. However, you can check or uncheck individual chart items to view in the report.
How to View Reports
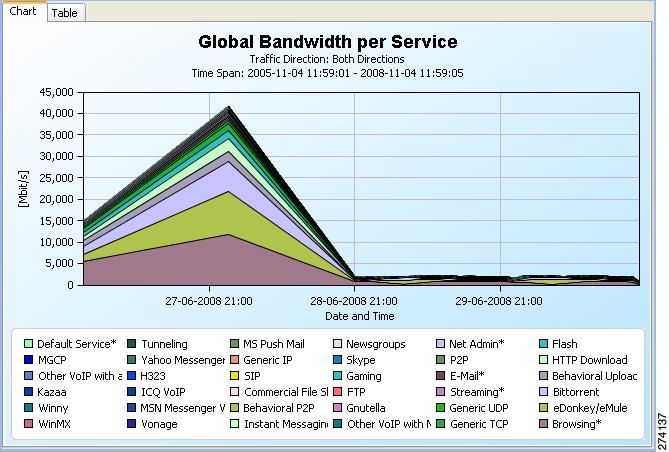
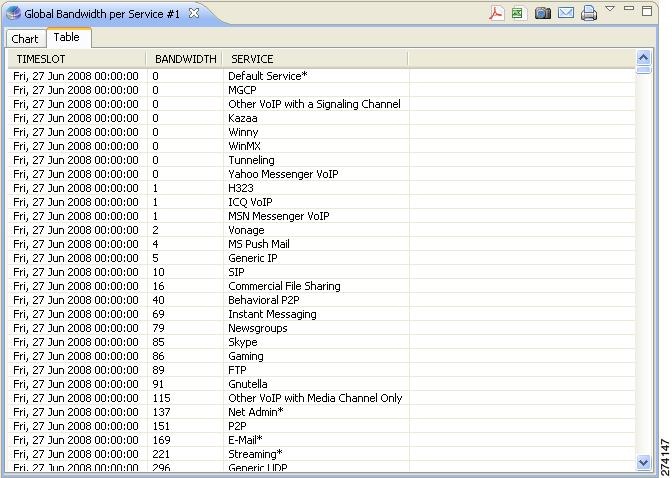
You can view a report as a chart or as a table.
Step 1 To select the desired display, click the appropriate tab located at the bottom-left of the report view.
The table is useful for locating specific information.
Adjusting the Chart Display
You can change the appearance and type of any report chart by modifying chart display properties, such as three-dimensional display settings, chart rendering, and chart colors. You can also change the appearance of a report in the following ways:
•Drag the legend to a different spot in the report.
•Hide the legend.
•Hide items from the legend; the corresponding items in the graph will be removed from view.
•Zoom in or out—drag the graph so that the desired section is in focus.
•Configuring the Properties of a Chart Display
•Changing the Appearance of the Chart
Configuring the Properties of a Chart Display
You configure chart display properties in the Properties view. As you make changes, the chart display is updated. There are also adjustments that are made directly in the report view (see Adjusting the Chart Display).
Note Changes to chart display properties are not saved in the report instance. When you next execute the report instance, the report will be generated with default chart display properties.
Table 5-2 lists chart display properties and their descriptions:
Table 5-3 shows possible values for the Chart Rendering property.
Table 5-4 lists the properties set in the 3D Properties dialog box and their possible values.
Changing the Appearance of the Chart
You can change the chart type of the report, adjust the graphical display of the chart, and change the colors used in the chart.
•How to Modify the Graphical Display
•How to Change the Colors Used in a Chart
How to Change the Chart Type
Step 1 Generate a report.
A report view opens displaying the report, and the Properties view displays the chart display properties.
Step 2 In the Properties view, select the Chart Rendering row, and click the browse button to open a drop-down list.

Step 3 From the drop-down list, choose the type of chart that you want to display.
The report is updated when you click anywhere else in the Properties view.
How to Modify the Graphical Display
Step 1 Generate a report.
A report view opens displaying the report, and the Properties view displays the chart display properties.
Step 2 To display the chart in two dimensions, click the 3D property.
The value of the 3D property toggles from True to False and the Look/3D category is removed from the Properties view.
Step 3 Click the 3D property again.
The chart displays in three dimensions, and the Look/3D category reappears.
Step 4 Select the Settings property.
The 3D properties dialog box appears.
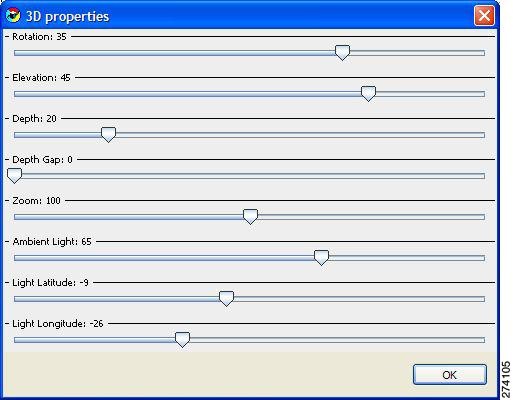
Step 5 Change the three-dimensional properties using the sliding scales.
Step 6 The chart display changes as you change the properties.
Step 7 Click OK.
The new values are assigned to the Settings property.
How to Change the Colors Used in a Chart
You can change the default color applied to a legend item in a chart. You may want to do this if, for instance, legend items that are adjacent in the chart have similar colors.
Note If legacy coloring is enabled (see How to Set the Colors Used in Charts, page 2-14), this option is not available.
Note You can create and apply your own color sets globally. See How to Set the Colors Used in Charts, page 2-14.
Step 1 Generate a report.
A report view opens displaying the report.
Step 2 Right-click an item in the legend.
A popup menu appears.
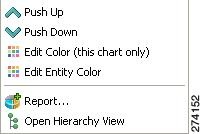
Step 3 From the menu, select either Edit Color (this chart only) or Edit Entity Color. The former option changes the color temporarily for this chart only, the latter makes the change persistent for all current and future charts.
A color palette opens.
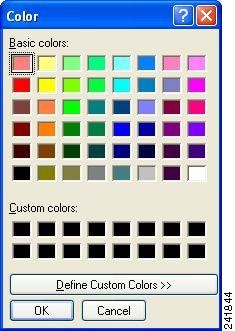
Step 4 Select a new color from the palette.
Step 5 Close the palette.
The new color is applied in the chart to the selected variable.
If you selected Edit Entity Color at Step 3, the new color is applied to all open charts, except those using temporary colors.
Zooming
•How to Zoom in on a Two-Dimensional Chart
•How to Drag a Zoomed-In Chart
•How to Zoom Out of a Zoomed-In Chart
How to Zoom in on a Two-Dimensional Chart
You can zoom in or out of two-dimensional charts.
While you are zoomed-in, you can drag the chart to view different sections.
Step 1 Generate a report.
A report view opens displaying the report, and the Properties view displays the chart display properties.
Step 2 To display the chart in two dimensions, click the 3D property.
The value of the 3D property toggles from True to False and the Look/3D category is removed from the Properties view.
Step 3 Mark off a rectangle by dragging the mouse over the chart.
The cursor changes to a plus icon.
Step 4 Release the mouse button, and the view zooms in.
How to Drag a Zoomed-In Chart
Step 1 Generate a report and display the chart in two dimensions.
Step 2 Zoom in to the top part of the chart.
Step 3 To move the chart down, click it with the middle mouse button, while dragging the chart.
The chart moves up, and the bottom of the chart appears.
How to Zoom Out of a Zoomed-In Chart
Step 1 Mark off a rectangle by right-clicking it while dragging the mouse over the chart.
The cursor changes to a minus icon.
Step 2 Release the mouse button, and the view zooms out.
How to Reset the Zoom
Step 1 In the report view, click  (Reset Zoom).
The report view is reset to its original settings.
Managing the Chart Legend
You can move the chart legend from its default position, or you can remove it from the chart display.
Note You can also globally configure how the legend is displayed. See How to Configure the Legend Displayed in Charts, page 2-19.
How to Move the Chart Legend
Step 1 Generate a report.
A report view opens displaying the report.
Step 2 Right-click the legend of the chart and drag it to the required position.
The legend moves to the new position.
How to Hide the Chart Legend
Step 1 Generate a report.
The Properties view displays the chart display properties.
Step 2 To hide the chart legend, click the Legend visibility property.
The value of the Legend visibility property toggles from True to False and the chart legend is removed from the chart.
Managing Report Output
You can manage report output in several ways:
•You can print, send by email, or export reports to PDF format.
•You can save charts to a number of graphic formats.
•You can save tables to CSV or Quoted CSV formats, which you can open as spreadsheets.
•You can print, send, or export multiple reports in one send operation.
How to Print Reports
Step 1 After executing one or more report instances, select File > Print Reports.
The Print Reports wizard appears.
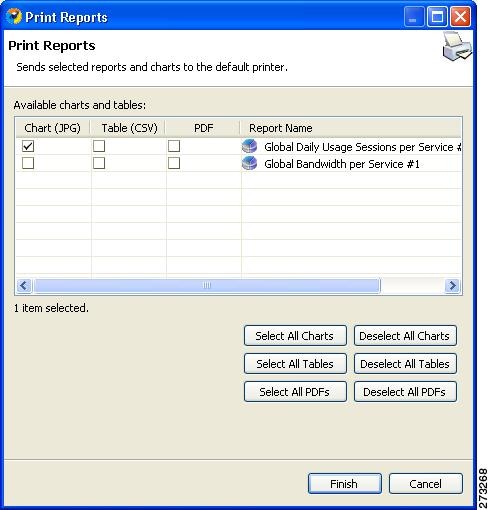
Step 2 Choose one or more formats for each report you are printing.
Step 3 Click Finish.
The selected reports print in the format or formats you chose.
Note For PDF and CSV formats, the print feature uses the desktop interface and only prints if the associated application can print from the desktop. If you can print from the desktop without opening the application, the print feature will work.
Note If you selected several reports to print, the application may freeze for several moments while sending the reports to the printer.
How to Send Reports by E-mail
Step 1 After executing one or more report instances, select File > Send Reports.
The Send Reports wizard appears.
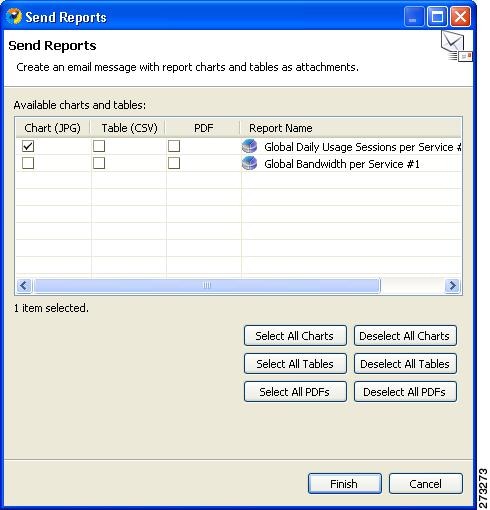
Step 2 Choose one or more formats for each report you are sending.
Step 3 Click Finish.
An email message opens from the default email application installed on the desktop, with the selected reports attached.
How to Export Reports
Step 1 After executing one or more report instances, select File >Export.
The Export wizard appears.
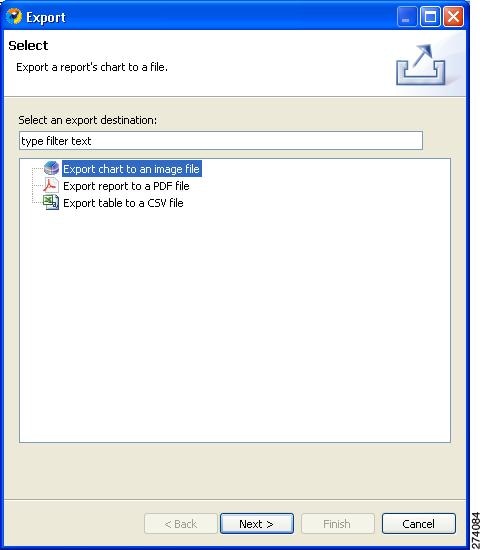
Step 2 Choose one of the following:
•Export chart to an image file
•Export report to a PDF file
•Export table to a CSV file
Step 3 Click Next.
The Tables and Destination page of the Export wizard opens.
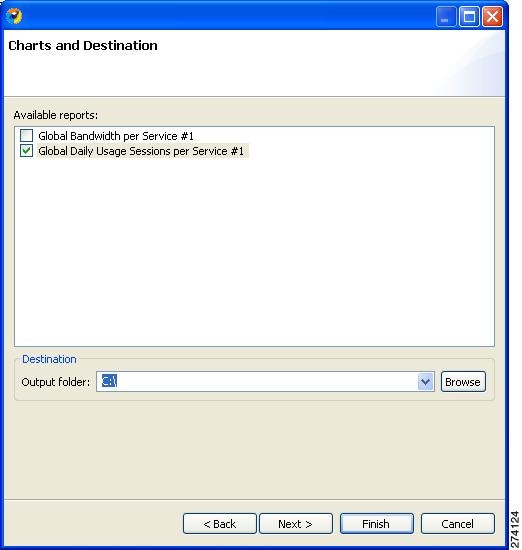
Step 4 Check one or more of the Available reports.
Step 5 (Optional) To change the Output folder, click Browse.
Step 6 Do one of the following:
•If you chose Report in Step 2 continue with Step 8.
•If you chose Chart, or Table in Step 2, click Next.
The Format page of the Export wizard opens. (The display depends on whether you chose Chart or Table in Step 2.)
Step 7 Enter required information.
Do one of the following:
•(For Chart)
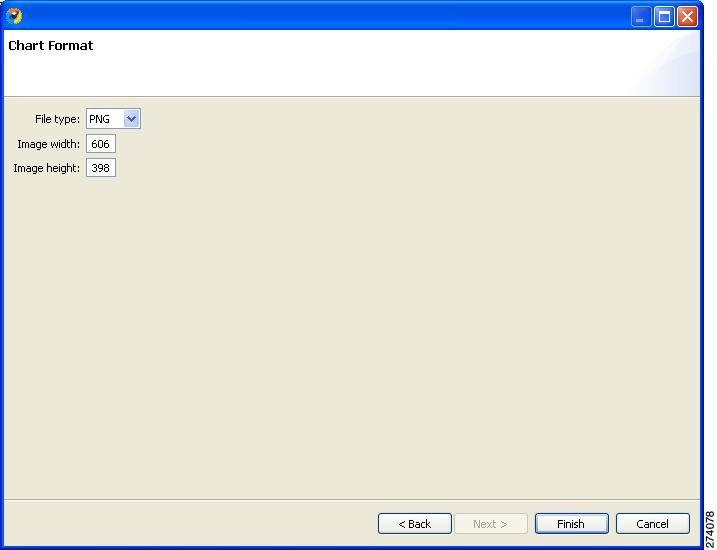
–From the File type drop-down list, choose a file type.
–In the Image width and Image height fields, enter values in pixels.
•(For Table)
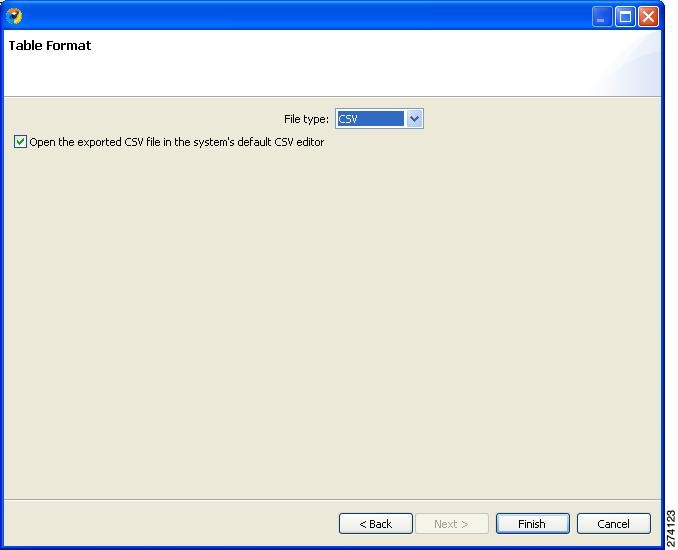
–From the File type drop-down list, choose a file type.
Step 8 Click Finish.
Each report selected is saved in a separate file.
 Feedback