Explain Packet Drop Faults in ACI
Available Languages
Contents
Introduction
This document describes each Fault type, and the procedure when you see this fault.
Background Information
During Normal Operation of a Cisco Application Centric Infrastructure (ACI) Fabric, the administrator can see Faults for certain types of Packet Drops.
Managed Objects
In Cisco ACI, all faults are raised under Managed Objects (MO). For example, a fault F11245 - ingress drop packets rate(l2IngrPktsAg15min:dropRate) is regarding the parameter dropRate in MO l2IngrPktsAg15min.
This section introduces some of the examples of Managed Object (MO) related to drop packet faults.
| Example | Description | Sample Parameters | Sample MO Against which Faults are Raised |
|
| l2IngrPkts | l2IngrPkts5min l2IngrPkts15min l2IngrPkts1h and so on. |
This represents ingress packet statistics per VLAN during each period. |
dropRate floodRate multicastRate unicastRate |
vlanCktEp (VLAN) |
| l2IngrPktsAg | l2IngrPktsAg15min l2IngrPktsAg1h l2IngrPktsAg1d and so on. |
This represents ingress packet statistics per EPG, BD, VRF, and so on. For example, EPG stats represents aggregation of VLAN stats which belong to the EPG. |
dropRate floodRate multicastRate unicastRate |
fvAEPg (EPG) fvAp (Application Profile) fvBD (BD) l3extOut (L3OUT) |
| eqptIngrDropPkts | eqptIngrDropPkts15min eqptIngrDropPkts1h eqptIngrDropPkts1d and so on. |
This represents ingress drop packet statistics per interface during each period. |
*1 forwardingRate *1 errorRate *1 bufferRate |
l1PhysIf (physical port) pcAggrIf (port-channel) |
*1:These counters in eqptIngrDropPkts can be falsely raised due to an ASIC limitation in several Nexus 9000 Platforms, because SUP_REDIRECT packets are being logged as forward drops. See also Cisco bug ID CSCvo68407  and Cisco bug ID CSCvn72699 for further details and fixed versions.
Hardware Drop Counter Types
On Nexus 9000 switches running in ACI Mode, there are 3 major hardware counters for ingress interface drop reason on the ASIC.
A dropRate in l2IngrPkts, l2IngrPktsAg includes those counters. Three parameters (forwardingRate, errorRate, bufferRate) in the table for eqptIngrDropPkts represent each three interface counters.
Forward
Forward drops are packets that are dropped on the LookUp block (LU) of the ASIC. In LU block, a packet forwarding decision is made based on the packet header information. If the decision is to drop the packet, Forward Drop is counted. There are a variety of reasons this can happen. The major ones are:
SECURITY_GROUP_DENY
A drop because of missing contracts to allow the communication.
When a packet enters the fabric, the switch looks at the source and destination EPG to see if there is a contract that allows this communication. If the source and destination are in different EPG's, and there is no contract that allows this packet type between them, the switch drops the packet and labels it as SECURITY_GROUP_DENY. This increments the Forward Drop counter.
VLAN_XLATE_MISS
A drop because of inappropriate VLAN.
When a packet enters the fabric, the switch looks at the packet to determine if the configuration on the port allows this packet. For example, a frame enters the fabric with an 802.1Q tag of 10. If the switch has VLAN 10 on the port, it inspects the contents and makes a forwarding decision based on the Destination MAC. However, if VLAN 10 is not on the port, it drops it and labels it as a VLAN_XLATE_MISS. This increments the Forward Drop counter.
The reason for XLATE or Translate is because in ACI, the leaf switch takes a frame with an 802.1Q encap and translates it to a new VLAN that is used for VXLAN and other normalization inside of the fabric. If the frame comes in with a VLAN not deployed, the translation fails.
ACL_DROP
A drop because of sup-tcam.
sup-tcam in ACI switches contains special rules to be applied on top of the normal L2/L3 forwarding decision. Rules in sup-tcam are built-in and not user configurable. The objective of sup-tcam rules is mainly to handle some exceptions or some of control plane traffic and not intended to be checked or monitored by users. When packet is hitting sup-tcam rules and the rule is to drop the packet, the dropped packet is counted as ACL_DROP and it increments the Forward Drop counter. When this occurs, it usually means the packet is about to be forwarded against basic ACI Forwarding principals.
Even though the drop name is ACL_DROP, this ACL is not same as normal Access Control List that can be configured on standalone NX-OS devices or any other routing/switching devices.
SUP_REDIRECT
This is not a drop.
A sup redirected packet (for example, CDP/LLDP/UDLD/BFD and so on) can be counted as Forward Drop even thought the packet is correctly processed and forwarded to CPU.
This is due to ASIC implementation limitation with Cloud Scale ASIC (EX/FX/FX2/FX3/GX/GX2) based ACI N9k switches.
Error
When the switch receives an invalid frame on one of the front panel interfaces, it is dropped as an error. Examples of this include frames with FCS or CRC errors. When looking at Uplink/Downlink leaf ports, or Spine ports, it is best to check for FCS/CRC errors using show interface. However, under normal operations, it is expected to see Error Packets incrementing on Uplink/Downlinks ports of leafs, or Spine ports as this counter also includes frames which are pruned by system and not expected to be sent out of the interface.
Example: TTL failures for routed packets, same interface broadcast/flooded frames.
Buffer
When the switch receives a frame, and there are no buffer credits available for either ingress or egress, the frame can be dropped with Buffer. This typically hints at congestion somewhere in the network. The link that is showing the fault could be full, or, the link containing the destination can be congested.
Viewing Drop Stats in CLI
Managed Objects
Secure Shell (SSH) to one of the APIC and run these commands.
apic1# moquery -c l2IngrPktsAg15min
This provides all object instances for this class l2IngrPktsAg15min.
Here is an example with a filter to query a specific object. In this example, the filter is to show only an object with attributes dn which includes tn-TENANT1/ap-APP1/epg-EPG1.
Also, this example uses egrep to show only required attributes.
Example output 1: EPG counter object (l2IngrPktsAg15min) of tenant TENANT1, application profile APP1 , epg EPG1.
apic1# moquery -c l2IngrPktsAg15min -f 'l2.IngrPktsAg15min.dn*"tn-TENANT1/ap-APP1/epg-EPG1"' | egrep 'dn|drop[P,R]|rep'

dn               : uni/tn-TENANT1/ap-APP1/epg-EPG1/CDl2IngrPktsAg15min
dropPer          : 30                              <--- number of drop packet in the current periodic interval (600sec)
dropRate         : 0.050000                        <--- drop packet rate = dropPer(30) / periodic interval(600s)
repIntvEnd       : 2017-03-03T15:39:59.181-08:00   <--- periodic interval = repIntvEnd - repIntvStart
repIntvStart     : 2017-03-03T15:29:58.016-08:00                          = 15:39 - 15:29
                                                                          = 10 min = 600 sec
Or you could use another option -d instead of -c to get a specific object if you know the object dn.
Example output 2: EPG counter object (l2IngrPktsAg15min) of tenant TENANT1, application profile APP1, epg EPG2.
apic1# moquery -d uni/tn-TENANT1/ap-APP1/epg-EPG2/CDl2IngrPktsAg15min | egrep 'dn|drop[P,R]|rep'
dn               : uni/tn-jw1/BD-jw1/CDl2IngrPktsAg15min
dropPer          : 30
dropRate         : 0.050000
repIntvEnd       : 2017-03-03T15:54:58.021-08:00
repIntvStart     : 2017-03-03T15:44:58.020-08:00
Hardware Counters
If you see faults, or want to check Packet drops on switchports using the CLI, the best way to do this is by viewing the platform counters in hardware. Most, but not all counters are shown using show interface. The 3 major drop reasons can only be viewed using the platform counters. In order to view these, perform these steps:
Leaf
SSH to the leaf and run these commands.
ACI-LEAF# vsh_lc
module-1# show platform internal counters port <X>
* where X represents the port number
Example output for ethernet 1/31:
ACI-LEAF# vsh_lc
vsh_lc
module-1#
module-1# show platform internal counters port 31
Stats for port 31
(note: forward drops includes sup redirected packets too)
IF          LPort                    Input                       Output
                              Packets       Bytes          Packets    Bytes
eth-1/31    31  Total          400719   286628225      2302918    463380330
                   Unicast     306610   269471065       453831     40294786
                   Multicast        0           0      1849091    423087288
                   Flood        56783     8427482            0            0
                Total Drops     37327                        0
                   Buffer           0                        0
                   Error            0                        0
                   Forward      37327
                   LB               0
                   AFD RED                                   0
                       ----- snip -----
Spine
For a box type spine (N9K-C9336PQ), it is exactly same as Leaf.
For modular spines (N9K-C9504 and so on), you must first attach the particular line card before you can view the platform counters. SSH to the spine and run these commands:
ACI-SPINE# vsh
ACI-SPINE# attach module <X>
module-2# show platform internal counters port <Y>.
* where X represents the module number for the line card you would like to view
Y represents the port number
Example output for ethernet 2/1:
ACI-SPINE# vsh
Cisco iNX-OS Debug Shell
This shell can only be used for internal commands and exists
for legacy reasons. User can use ibash infrastructure as this
can be deprecated.
ACI-SPINE#
ACI-SPINE# attach module 2
Attaching to module 2 ...
To exit type 'exit', to abort type '$.'
Last login: Mon Feb 27 18:47:13 UTC 2017 from sup01-ins on pts/1
No directory, logging in with HOME=/
Bad terminal type: "xterm-256color". can assume vt100.
module-2#
module-2# show platform internal counters port 1
Stats for port 1
(note: forward drops includes sup redirected packets too)
IF          LPort                    Input                       Output
                              Packets       Bytes          Packets    Bytes
eth-2/1      1  Total        85632884  32811563575     126611414   25868913406
                   Unicast   81449096  32273734109     104024872   23037696345
                   Multicast  3759719   487617769     22586542   2831217061
                   Flood            0           0            0            0
                Total Drops         0                        0
                   Buffer           0                        0
                   Error            0                        0
                   Forward          0
                   LB               0
                   AFD RED                                   0
                        ----- snip -----
Faults
F112425 - ingress Drop Packets Rate (l2IngrPktsAg15min:dropRate)
Description:
One of the popular reasons for this fault is that Layer 2 packets get dropped with the Forward Drop reason. There are a variety of reasons, but the most common one is:
On some platforms (see Cisco bug ID CSCvo68407), there is a limitation where L2 packets that need to get redirected to the CPU (for example, CDP/LLDP/UDLD/BFD, and so on), get logged as a Forward Drop as well as get copied to the CPU. This is due to a limitation of the ASIC used in these models.
Resolution:
The drops described are purely cosmetic, so the best practice recommendation is to increase the threshold for the fault as shown in the Stats Threshold section. In order to do this, see the instructions in the Stats Threshold.
F100264 - ingress Buffer Drop Packets Rate (eqptIngrDropPkts5min:bufferRate)
Description:
This fault can increment when packets are being dropped on a port with reason Buffer. As mentioned before, this typically happens when there is congestion on an interface at either the ingress or egress direction.
Resolution:
This fault represents actual dropped packets in the environment due to congestion. The dropped packets can be causing issues with applications running in the ACI fabric. Network Administrators can isolate the packet flow and determine if the congestion is due to unexpected traffic flows, inefficient load balancing, and so on, or expected utilization on those ports.
F100696 - Ingress Forwarding Drop Packets (eqptIngrDropPkts5min:forwardingRate)
This fault is caused by a few scenarios. The most common one is:
Description 1 - Spine Drops
If this fault is seen on a Spine interface, it could be due to traffic towards an unknown endpoint. When an ARP or IP packet is forwarded to the spine for a proxy lookup, and the endpoint is unknown in the fabric, a special glean packet is generated and sent to all leafs on the appropriate BD (internal) multicast group address. This triggers an ARP request from each leaf in the Bridge Domain (BD) to discover the endpoint. Due to a limitation, the glean packet received by the leaf is also reflected back into the fabric again and triggers a forwarding drop on the spine link connected to the leaf. The Forward Drop in this scenario is only incremented on Generation 1 Spine Hardware.
Resolution 1
Since it is known that the issue is caused by a device sending unnecessary amount of Unknown Unicast traffic into the ACI Fabric, it is required to figure out which device is causing this, and see if it can be prevented. This is usually caused by devices that scan or probe for IP addresses on subnets for monitoring purposes. In order to find what IP is sending this traffic, SSH onto the leaf that is connected to the spine interface showing the fault.
From there, you can run this command to see the Source IP Address (sip) that is triggering the glean packet:
ACI-LEAF# show ip arp internal event-history event | grep glean | grep sip | more
    [116] TID 11304:arp_handle_inband_glean:3035: log_collect_arp_glean;sip = 192.168.21.150;dip = 192.168.20.100;info = Received glean packet is an IP packet
    [116] TID 11304:arp_handle_inband_glean:3035: log_collect_arp_glean;sip = 192.168.21.150;dip = 192.168.20.100;info = Received glean packet is an IP packet
In this example output, the glean packet is triggered by 192.168.21.150 and it is recommended to see if this can be mitigated.
Description 2 - Leaf Drops
If this fault is seen on a leaf interface, the most likely cause is due to SECURITY_GROUP_DENY drops mentioned.
Resolution 2
ACI leaf keeps a log of packets denied due to violations. This log does not capture all of them to protect CPU resources, however, it still provides you a vast amount of logs.
To get required logs, if the interface the fault is raised on is part of a port-channel, it is required to use this command and grep for the port-channel. Otherwise, the physical interface can be grepped.
This log can be quickly rolled over depending on the amount of contract drops.
ACI-LEAF# show logging ip access-list internal packet-log deny | grep port-channel2 | more
[ Sun Feb 19 14:16:12 2017 503637 usecs]: CName: jr:sb(VXLAN: 2129921), VlanType: FD_VLAN, Vlan-Id: 59, SMac: 0x8c604f0288fc, DMac:0x0022bdf819ff, SIP: 192.168.21.150, DIP: 192.168.20.3, SPort: 0, DPort: 0, Src Intf: port-channel2, Pr
oto: 1, PktLen: 98
[ Sun Feb 19 14:16:12 2017 502547 usecs]: CName: jr:sb(VXLAN: 2129921), VlanType: FD_VLAN, Vlan-Id: 59, SMac: 0x8c604f0288fc, DMac:0x0022bdf819ff, SIP: 192.168.21.150, DIP: 192.168.20.3, SPort: 0, DPort: 0, Src Intf: port-channel2, Pr
oto: 1, PktLen: 98
In this case, 192.168.21.150 is trying to send ICMP messages (IP protocol number 1) to 192.168.20.3. However, there is no contract between the 2 EPG's that allows ICMP, so the packet is dropped. If ICMP is supposed to be allowed, a contract can be added between the two EPG's.
Stats Threshold
This section describes how to change a threshold for a statistics objects which could potentially raise a fault against drop counter.
A threshold for statistics of each objects (for example, l2IngrPkts, eqptIngrDropPkts) are configured through Monitoring Policy against variety of objects.
As mentioned in the table at the beggining, eqptIngrDropPkts is monitored under, for example, l1PhysIf objects through Monitoring Policy.
Forward Drop Packets Rate in eqptIngrDropPkts
There are two portions for this.
+ Access Policies (Ports towards external devices. Also called front panel ports).
+ Fabric Policies (Ports between LEAF and SPINE. Also called fabric ports).
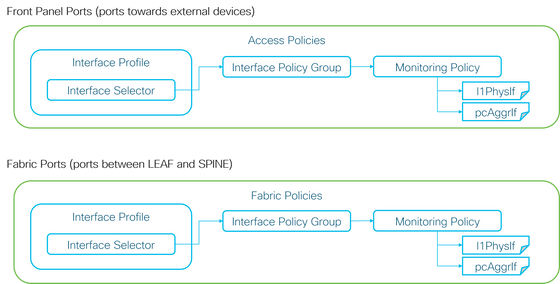
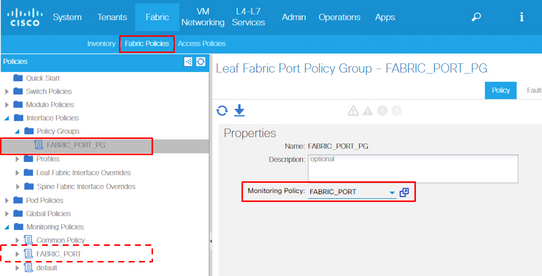
Each port objects (l1PhysIf, pcAggrIf) could be assigned its own Monitoring Policy via Interface Policy Group as shown in the previous picture.
By default, there is a default Monitoring Policy under both Fabric > Access Policies and Fabric > Fabric Policies in APIC GUI. These default Monitoring Policies are assigned to all ports respectively. The default Monitoring Policy under Access Policies is for Front Panel Ports and the default Monitoring Policy under Fabric Policies is for Fabric Ports.
Unless it is required to change thresholds per ports, the default Monitoring Policy in each section can be directly modified to apply the change for all front panel ports and/or fabric ports.
This example is to change thresholds for Forward Drop in eqptIngrDropPkts on fabric ports (Fabric Policies). Perform the same thing under Fabric > Access Policies for front panel ports.
1. Navigate to Fabric >Fabric Policies>Monitoring Policies.
2. Right click and select Create Monitoring Policy.
(If the threshold change can be applied to all fabric ports, navigate to default instead of creating a new one.)
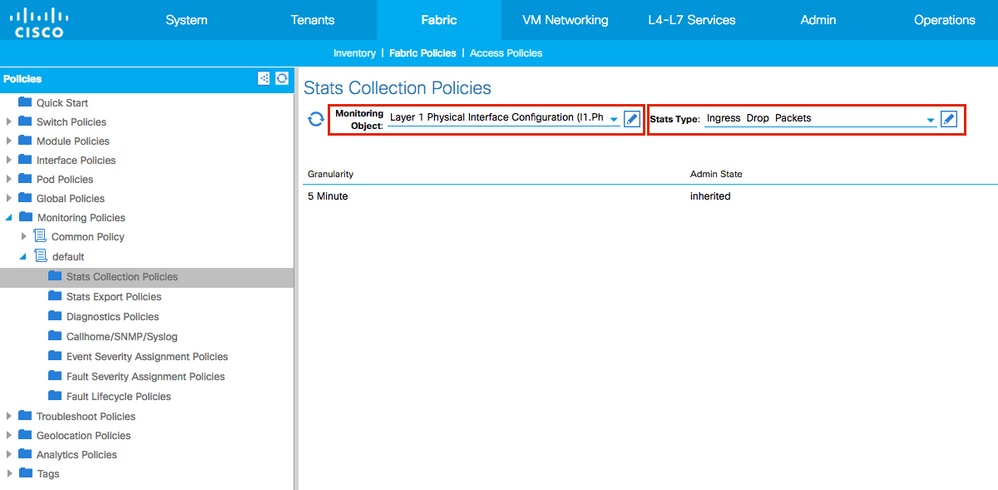
3. Expand the new Monitoring Policy or default and navigate to Stats Collection Policies.
4. Click the pencil icon for the Monitoring Object on the right pane, select Layer 1 Physical Interface Configuration (l1.PhysIf).
(Step 4 can be skipped when the default policy is used.)
5. From the Monitoring Object drop down on the right pane, choose Layer 1 Physical Interface Configuration (l1.PhysIf) and Stats Type, choose Ingress Drop Packets.
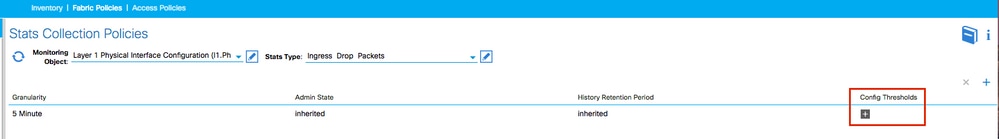
6. Click the + next to Config Thresholds.
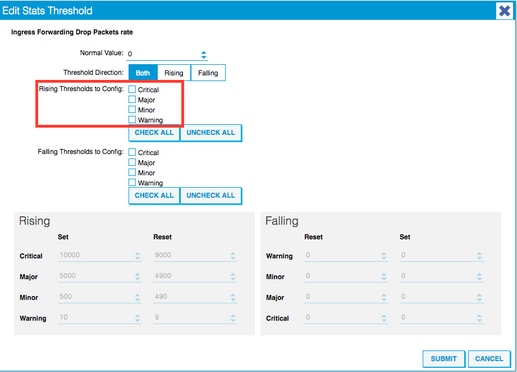
7. Edit the Threshold for Forwarding Drop.
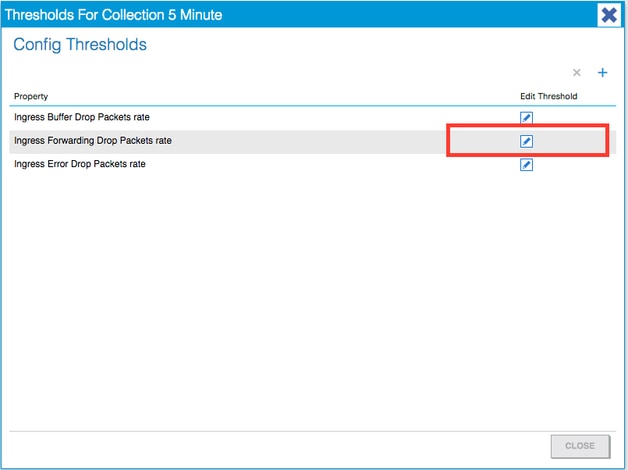
8. The recommendation is to disable the rising thresholds to config for critical, major, minor, and warning for forwarding drop rate.
9. Apply this new Monitoring Policy to the Interface Policy Group for required ports. Do not forget to configure Interface Profile, Switch Profile, and so on in Fabric Policies accordingly.
(Step 9 can be skipped when the default policy is used.)
10. If this is for Front Panel Ports (Access Policies), perform the same thing for Aggregated Interface (pc.AggrIf) as opposed to Layer 1 Physical Interface Configuration (l1.PhysIf) so that this new Monitoring Policy can be applied to port-channel as well as physical port.
(Step 10 can be skipped when the default policy is used.)
Ingress Drop Packets Rate in l2IngrPktsAg
There are multiple portions for this.
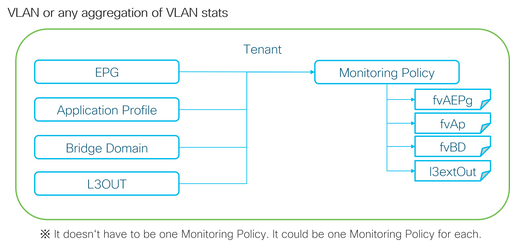
As the previous picture depicts, l2IngrPktsAg is monitored under a lot of objects. This picture only shows some examples, but not all of the objects for l2IngrPktsAg. However, the threshold for statistics is configured through Monitoring Policy as well as eqptIngrDropPkts under l1PhysIf or pcAggrIf.
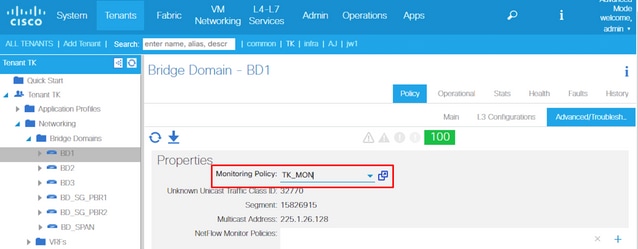
Each object (EPG(fvAEPg), Bridge Domain(fvBD), and so on) could be assigned its own Monitoring Policy as shown in the picture above.
By default, all of these objects under tenant uses the default Monitoring Policy under Tenant > common > Monitoring Polices > default unless configured otherwise.
Unless it is required to change thresholds per each component, the default Monitoring Policy under tenant common can be directly modified to apply the change for all related components.
This example is to change thresholds for Ingress Drop Packets Rate in l2IngrPktsAg15min on Bridge Domain.
1. Navigate to Tenant > (tenant name) > Monitoring Policies.
(tenant needs to be common if the default Monitoring Policy is used or the new Monitoring Policy needs to be applied across tenants)
2. Right click and select Create Monitoring Policy.
(If the threshold change can be applied to all components, navigate to default instead of creating a new one.)
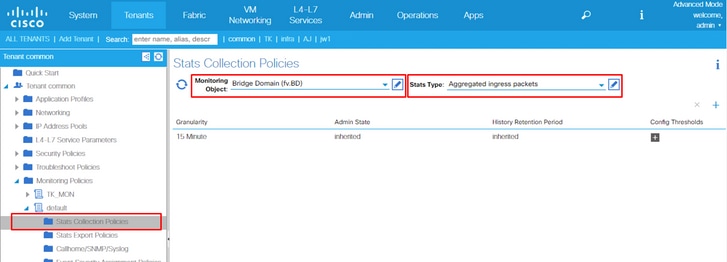
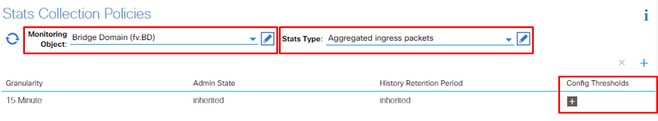
3. Expand the new Monitoring Policy or default and navigate to Stats Collection Policies.
4. Click the pencil icon for the Monitoring Object on the right pane, select Bridge Domain (fv.BD).
(Step 4 can be skipped when the default policy is used.)
5. From the Monitoring Object drop down on the right pane, choose Bridge Domain (fv.BD) and Stats Type, choose Aggregated ingress packets.
6. Click the + next to Config Thresholds.
7. Edit the Threshold for Forwarding Drop.
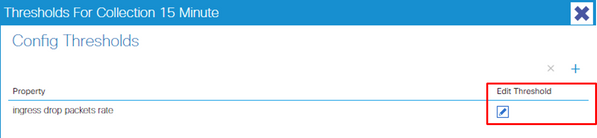
8. The recommendation is to disable the rising thresholds to config for critical, major, minor, and warning for forwarding drop rate.

9. Apply this new Monitoring Policy to the Bridge Domain which requires threshold change.
(Step 9 can be skipped when the default policy is used.)
Revision History
| Revision | Publish Date | Comments |
|---|---|---|
7.0 |
08-Jun-2026
|
Updated Introduction, Machine Translation, Style Requirements, and Formatting. |
6.0 |
18-May-2024
|
Updated article content to account for latest models of switches |
5.0 |
30-Apr-2024
|
Updated Article Description, Alt Text, Machine Translation, Style Requirements, and Formatting. |
4.0 |
04-Apr-2023
|
-FX model callouts |
3.0 |
11-Oct-2021
|
Updated content under Error Section. |
1.0 |
10-Apr-2017
|
Initial Release |
 Feedback
Contact Cisco
- Open a Support Case

- (Requires a Cisco Service Contract)