Model Driven Telemetry White Paper
Available Languages
Bias-Free Language
The documentation set for this product strives to use bias-free language. For the purposes of this documentation set, bias-free is defined as language that does not imply discrimination based on age, disability, gender, racial identity, ethnic identity, sexual orientation, socioeconomic status, and intersectionality. Exceptions may be present in the documentation due to language that is hardcoded in the user interfaces of the product software, language used based on RFP documentation, or language that is used by a referenced third-party product. Learn more about how Cisco is using Inclusive Language.
The history of the Cisco Internetwork Operating System (Cisco IOS®) goes back to Cisco’s first product, the AGS multiprotocol router, launched in 1986. At the time, Cisco IOS was still a monolithic (nonmodular) operating system. It was one of the very first network operating systems in the industry and has evolved as the industry has evolved, with thousands of features added in the last 30 years.
Over time, variations of Cisco IOS Software have been created to accommodate the expanding Cisco® portfolio of switches, routers, access points, and wireless controllers, including new operating systems for the data center (Cisco NX OS) and service providers (Cisco IOS XR).
Cisco IOS has evolved into IOS XE, designed to restructure the monolithic code infrastructure of IOS into a modular and modern software architecture. With IOS XE, the OS is divided into multiple components to achieve modularity and portability of features. A low-level Linux kernel was introduced to provide CPU load balancing and memory management and to enhance hardware resource management.
Cisco IOS now runs as a modular process on top of the Linux kernel (known as Cisco IOSd). This approach allows other modular functions to be introduced, such as Wireshark and applications running in containers.
Cisco IOS XE is continually evolving. With new applications appearing, the established models for configuration and monitoring, such as the Command-Line Interface (CLI) and Simple Network Management Protocol (SNMP), are slowly being replaced by standardized APIs based on data models. All API services on IOS XE are part of the essentials or base-level license. This helps ensure that regardless of license level the API and model driven telemetry features will be available and operational on any network device that is on the network.
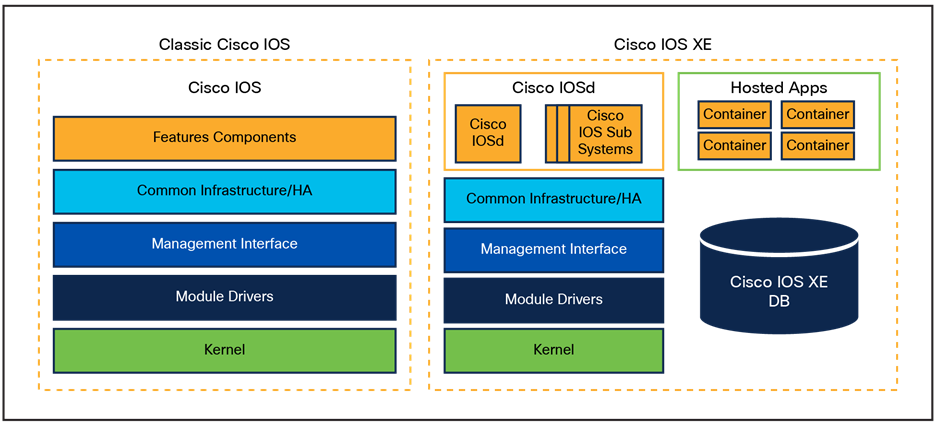
Classic Cisco IOS to Cisco IOS XE comparison
Telemetry is defined as the automated communications process by which measurements and other data are collected at remote locations and transmitted to receiving equipment for monitoring. The word is derived from the Greek roots tele, meaning “remote”, and metron, meaning “measure”. In the context of Cisco IOS XE, the networking devices are remote devices that transmit operational, configuration, and event information to remote data collectors.
Common telemetry use cases include business intelligence for network, application, and user monitoring, network planning, security analysis, accounting, logging, and traffic engineering.
Why is telemetry important to YOU?
● Growing networks require continuous real-time visibility for better manageability.
● With growing networks comes a huge amount of data that needs to be stored for analysis.
● Innovation and Cisco cloud-scale operational technologies open doors to use data to provide software-defined and automated visibility into your network using model driven telemetry leveraged by Cisco IOS XE.
Benefits of model driven telemetry
Model Driven Telemetry (MDT) provides a mechanism to stream data from an MDT-capable device to a destination receiver. It uses a new approach for network monitoring in which data is streamed from network devices continuously using a push model and provides near-real-time access to operational statistics for monitoring data. Applications can subscribe to specific data items they need by using standards-based YANG data models over open protocols. Structured data is published at a defined cadence or on-change, depending on the subscription criteria and data type.
MDT in network devices provides the following benefits:
● Improved network device visibility: MDT provides granular visibility into network traffic, device behavior, and services, allowing network administrators to monitor and troubleshoot network issues in real time.
● Faster troubleshooting: With MDT, network administrators can quickly identify the root cause of network issues and take corrective actions in real time. This helps to reduce network downtime and improve network availability.
● Better network optimization: MDT provides detailed information about network traffic, device performance, and application behavior. This information can be used to optimize network performance, automate responses, and ensure that critical applications are running smoothly.
● Simplified network management: MDT simplifies network management by providing a standardized way of collecting and reporting network telemetry data. This helps to reduce the complexity of managing a large network and enables network administrators to focus on strategic initiatives.
● Enhanced security: MDT provides visibility into network behavior, which can help to detect and prevent security threats. By monitoring network traffic in real time, MDT can detect anomalies and alert network administrators to potential security breaches.
In short, MDT is a powerful tool for network administrators that provides real-time visibility into network behavior, faster troubleshooting, better network optimization, simplified network management, and enhanced security.
Network monitoring challenges: Why use third-party telemetry?
Automation solutions based on CLI and SNMP have over time proven to be incomplete, inefficient, and hard to scale and maintain. New requirements in terms of speed, scale, fault isolation, forensic analysis, and near-real-time data availability are making legacy monitoring solutions insufficient for most organizations. MDT provides a more detailed, secure, and scalable method to ensure visibility and provide alerting systems with the needed data.
Several MDT interfaces are available that provide different transport and encoding options in a manner similar to APIs.
Model driven telemetry interfaces
Network data collection for today's high-density platforms and scale is becoming a tedious task for monitoring and troubleshooting. There is a need to collect operational data from different devices in the network and store it in a centralized location, so that cross-functional groups can collaboratively work to analyze and fix an issue.
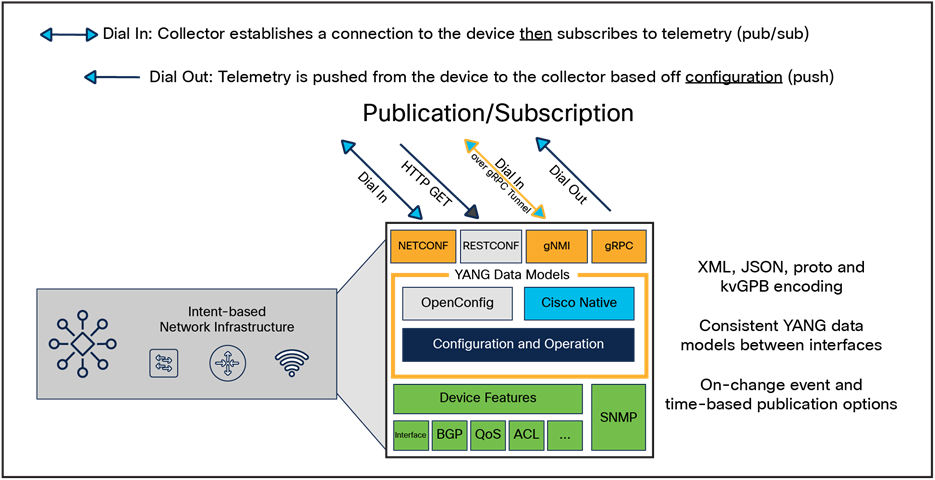
MDT provides a mechanism to stream data from an MDT-capable device to a destination. It uses a new approach for network monitoring in which data is streamed from network devices continuously using a push model and provides near-real-time access to operational statistics for monitoring data. Applications can subscribe to specific data items they need by using standards-based YANG data models over open protocols. Structured data is published at a defined cadence or on-change, based upon the subscription criteria and data type.
The main consideration when selecting the MDT interface is the source of the telemetry data and the connection. Dial-out is the configured telemetry subscription, in which the details are configured like any other device feature from the CLI or API. Dial-in is the dynamic telemetry subscription, in which the tooling collector first establishes the session and then defines the telemetry configuration.
Table 1. Model driven telemetry interface comparison
| NETCONF |
gRPC (Dial-Out) |
gNMI |
||
| Minimum IOS XE Version |
16.6 |
16.10 |
Dial-In: 16.12 Dial-Out: 17.11 |
Network architecture, security posture and policy, YANG data modules, tools and language preferences are some considerations when leveraging the various MDT interfaces |
| Recommended Version |
17.12 |
17.12 |
Dial-In: 17.12 |
|
| Telemetry Direction |
Dial-In, IOS XE is server |
Dial-Out, IOS XE is client |
Dial-In, IOS XE is server Dial-Out gRPC Tunnel |
|
| Configuration |
Dynamic per session |
Static per configuration |
Dynamic per session |
|
| Telemetry Collector |
Client |
Server |
Client |
|
| Encoding |
XML |
KV GPB |
JSON_IETF + PROTO |
|
| Security |
SSH + PKI certificate or password |
mTLs or plain-text |
mTLS certificates mTLS cert only or mTLS cert + user/pass authentication |
|
| Transport Protocol |
SSH |
HTTP2 |
HTTP2 |
|
| Data Models |
YANG |
YANG |
YANG |
Each of the MDT interfaces uses YANG models, but they have differing implementations, including network architecture, security posture and policy, YANG data modules, tools, language, etc. Refer to the table above for the requirements for each MDT interface. For more details and comparisons, see the “Benchmarking and Comparisons” section below.
Considerations for selecting an MDT interface:
● Minimum and recommended Cisco IOS XE versions: For Cisco IOS XE devices using Release 16.6 or later, the NETCONF protocol is available. The recommended version at the time this white paper was published was 17.12. For Cisco IOS XE devices using Release 16.10 or later, gRPC (dial-out) is an available telemetry option.
● Telemetry direction, configuration, and collector dial-in vs. dial-out. There are security considerations for both dial-in and dial-out, including mutual TLS (mTLS) for dial-out and role-based access control/NETCONF Access Control Module RBAC/NACM for dial-in.
◦ NETCONF and gRPC Network Management Interface (gNMI) (dial-in) support dial-in where the Cisco IOS XE device is the server and the telemetry collector is the client.
◦ gRPC (dial-out) and gNMI (dial-out), also known as gRPC tunnel, support dial-out, where the Cisco IOS XE device is the client and the telemetry collector is the server.
● Encoding:
◦ Extensible Markup Language (XML) is used for NETCONF telemetry connections with text-based formatting.
◦ Key-Value Google Proto Buffer (KV GPB) is used for Google protocols such as gRPC dial-out.
◦ JSON_IETF, or JavaScript Object Notation defined by the Internet Engineering Task Force (IETF), follows RFC 8259, and it also follows a key-value pair formatting used by gNMI.
◦ PROTO uses a binary encoding also used by gNMI.
● Security (transport):
◦ Secure Shell (SSH) and Public Key Infrastructure (PKI) allow access through a certificate or password, which is supported by NETCONF.
◦ mTLS, where the server verifies the client and the client verifies the server, and plain-text are supported by gRPC dial-out.
◦ mTLS certificates, including the following, are supported by gNMI:
◦ mTLS certificate only
◦ mTLS certificate and username/password authentication
◦ RFC 8341 for NACM can be used to secure access into MDT’s API interface when either NETCONF or gNMI dial-in is used. This is so that a user with low privileges can dial in to the device and subscribe to the telemetry data as needed, while being restricted to making operational changes to the device, including modifying the running configuration.
● Transport protocol:
◦ SSH is supported by NETCONF.
◦ HTTP2 is supported by gRPC Dial-Out and gNMI.
● Data models: Regardless of which version is used, YANG models and the data within those models will remain consistent.
There are two main MDT publication/subscription (pub/sub) models: dynamic (dial-in) and configured (dial-out).
Table 2. Telemetry comparisons of dial-in and dial-out
| Dial-In (dynamic) |
Dial-Out (static or configured) |
| Interface: NETCONF, gNMI |
Interface: gRPC |
| Telemetry updates are sent to the initiator subscriber |
Telemetry updates are sent to the specified receiver/collector |
| The life of the subscription is tied to the connection (session) that created it and over which telemetry updates are sent. No change in the running configuration is observed. |
A subscription is created as part of the running configuration; it remains the device configuration until the configuration is removed |
| Dial-in subscriptions need to be re-initiated after a reload because of established connections or sessions being killed during stateful switchover |
Dial-out subscriptions are created as part of device configuration and they automatically reconnect to the receiver after a stateful switchover, network or tooling outage |
| Subscription ID is dynamically generated upon successful establishment of a subscription |
Subscription ID is fixed and configured on the device as part of the configuration |
Dynamic (dial-in)
An application-based subscriber requests an open session to the network device via the ietf-yangpush.yang data model. The subscriber sends one or more subscriptions using the same session. If the Cisco IOS XE device approves the request, it replies with a subscription ID and starts streaming telemetry data. The network device will send the publications to the application for as long as the session stays up.
Dynamic subscriptions cannot be modified but can be terminated at any time. Dynamic subscriptions automatically terminate if the session is terminated. In a dynamic subscription, the subscriber and receiver are always the same entity. Note: Dial-in sessions are not maintained during a High Availability (HA) failover event, meaning if the session goes down, it will not be reopened unless explicitly reopened by the user. NETCONF and gNMI are the dial-in telemetry interfaces.
Configured (dial-out)
In the configured subscription, the receiver is not necessarily the subscriber, and the subscription is configured via CLI, NETCONF, or RESTCONF. Subscriptions can be modified or terminated at any point in their lifetime. Configured subscriptions are persistent between IOS XE device reboots, unlike dynamic subscriptions. Configured subscriptions can be used to stream data to more than one receiver.
Dial-out is a configured model. The subscriptions need to be statically configured on the network device using any of the available interfaces (CLI, APIs, etc.) and the device will open a session with the application. Unlike dial-in sessions, if the dial-out session goes down, the device will try to open a new session. gRPC is the dial-out telemetry interface.
Table 3. Comparison of dial-out and dial-in
| Dial-out |
Dial-in |
| Supports gRPC, http, TCP as transport protocol |
Only gRPC is supported as protocol |
| Configuration needs to be done from the CLI or other management interface |
Single channel for subscription and data transport |
| No need to open a specific port to management interface of switch |
Firewall rule needs to apply to ingress direction to switch for gRPC |
| Load balancing is easy by setting up collector behind virtual IP (VIP) |
gRPC/gNMI client need is distributed between switches |
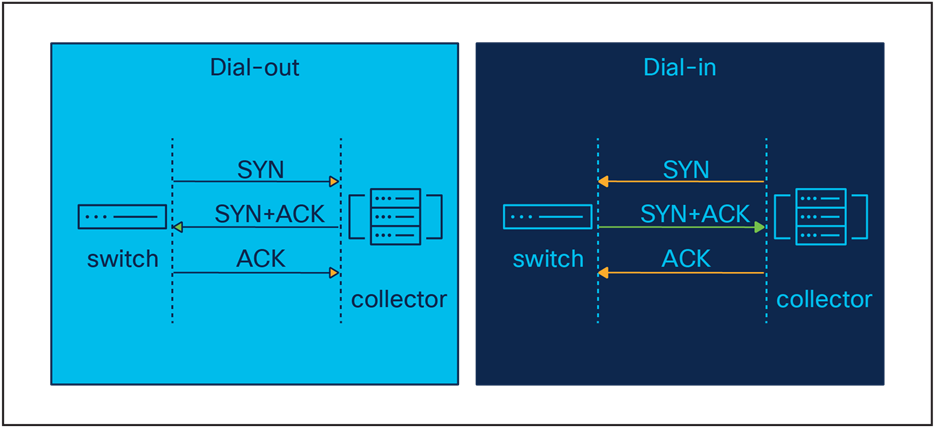
Dial-in vs. dial-out handshake
NETCONF stands for NETwork CONFiguration and was originally defined in RFC 4741 for NETCONF 1.0 and updated in RFC 6241 for NETCONF 1.1. The NETCONF protocol defines a set of operations to manipulate structured data defined by YANG data models. It is an RPC-based protocol where data is encoded in XML. Transactions are at the core of the protocol stack. It is session-oriented, provides capabilities exchange for discovering models, and uses SSH as a transport. The combination of NETCONF with YANG constitutes an API.
RESTCONF follows the REST API and provides the ability to GET, PATCH, DELETE, etc. While there is no telemetry option for RESTCONF, multiple REST GET requests can be sent to a Cisco IOS XE device. See the sections below about how to generate Ansible playbooks and Python scripts to automate this process.
SNMP is unable to discover MIBs supported by the device. NETCONF has a built-in capability exchange, providing all supported data models as well as additional operations and datastores supported on a device. For example, "notification" or "roll back-on-error" capabilities are shown below.
OpenConfig gNMI is the gRPC Network Management Interface developed by Google. gNMI provides the mechanism to install, manipulate, and delete the configurations of network devices and view operational data. The content provided through gNMI can be modeled using YANG and encoded using JSON_IETF in accordance with RFC 7951.
| gnxi gnxi server gnxi secure-server |
gRPC is the Google Remote Procedure Call developed by Google, and it supports dial-out telemetry.
In the following CLI example, two subscriptions are configured. Subscription 502 provides CPU data every 20 seconds, and subscription 503 provides memory data every 30 seconds.
| telemetry ietf subscription 502 encoding encode-kvgpb filter xpath /process-cpu-ios-xe-oper:cpu-usage/cpu-utilization/five-seconds source-address 10.100.99.14 source-vrf mgmt stream yang-push update-policy periodic 2000 receiver ip address 10.100.1.13 57500 protocol grpc-tcp |
For additional use cases and examples, check out the DevNet Code Exchange: https://developer.cisco.com/codeexchange/github/repo/jeremycohoe/cisco-ios-xe-mdt/
Configuration and operational data
Configuration data models are the set of writable data required to transform a system from its initial default state into its current state. A configuration model instructs the device to do something and can be mapped to the running configuration of a Cisco IOS XE device.
Operational data models are the set of read-only data status information and statistics on a device. An operational data model consists of what the device is doing and is mapped to the information traditionally provided by show commands.
Data represented in YANG data models can be streamed as telemetry to remote collectors for monitoring and processing. Subscriber applications, via the ietf-yang push YANG data model, request continuous and customized streams of updates from a Cisco IOS XE device. The streaming telemetry notifications are based on the data model supported by the device, which makes possible near-real-time operational and configuration insights. There are two subscription types and two notification types, described below.
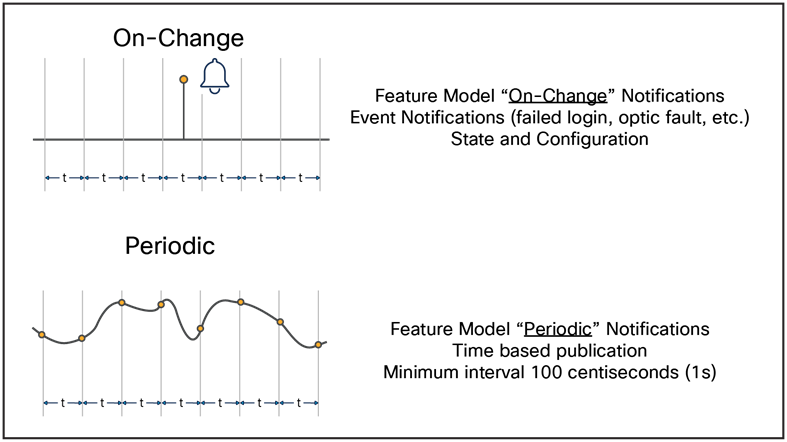
Publication notification options: On-change and periodic
Note: Notification options are independent of subscription types.
Telemetry notifications occur either at a predefined time schedule or when an event occurs. On-change or event-based notifications provide alerts of a state or configuration update. For example, configuration changes, failed logins, interface state changes, and other faults and alarms could alert the network administrator of suspicious activity. Periodic updates include notifications at a regular time interval. The periodic update interval is predefined, usually between 5 seconds and 5 minutes, depending on the use case and business requirements. The minimum interval is one update per second. An example of periodic telemetry is receiving CPU and memory utilization and interface packet counters every 30 seconds.
Telemetry publication options
Data models are one of the most important components of programmable APIs. They define the data structure, syntax, and semantics of a given feature and are meant to solve the issue of unstructured data provided by CLIs.
Yet Another Next-Generation (YANG) was defined in RFC 6020 and has been updated in RFC 7950. The YANG data modeling language was developed by IETF to enable the reuse of data models across equipment from different network vendors. It is widely used by network operators to automate the configuration and monitoring of network devices and define the capabilities of the API. Cisco IOS XE supports two categories of YANG data models: native and open.
Cisco IOS XE native data models specific to Cisco IOS XE are not interoperable with other platforms. They closely mirror the structure of the Cisco IOS XE CLI, which makes them more familiar to experienced Cisco IOS XE users. The key benefit of native data models is the breadth of feature coverage.
Examples include:
● Cisco-IOS-XE-interfaces.yang: A native module for configuring interface parameters such as IP address, description, and speed. It also contains operational data about interfaces, such as admin state and InOctets.
● Cisco-IOS-XE-ospf.yang: A native module for configuring Open Shortest Path First (OSPF) routing processes.
Open data models provide a common interface across multiple platforms. Cisco IOS XE supports a number of open data models from both the IETF and OpenConfig standards bodies.
The Internet Engineering Task Force (IETF) defines many of the standards needed for the operation of networks, including the IP protocol. IETF has released several open data models that are supported by Cisco IOS XE.
Some of the IETF YANG modules supported by IOS XE include:
● ietf-interfaces.yang: IETF module for configuring interface parameters such as IP address, description, and speed. It also contains operational data about interfaces, such as admin state and InOctets.
● ietf-ospf.yang: IETF module for configuring OSPF routing processes.
OpenConfig is a consortium of network operators created to define standards intended to make networks more open and programmable. The OpenConfig standards body consists primarily of network operators. As OpenConfig is not a formal standards body, OpenConfig data models change rapidly.
Some of the OpenConfig modules supported by Cisco IOS XE include:
● openconfig-interfaces.yang: OpenConfig module for configuring interface parameters such as IP address, description, and speed. It also contains operational data about interfaces, such as admin state and InOctets.
● openconfig-ospfv2.yang: OpenConfig module for configuring OSPF routing processes.
YANG can be used for configuration data and operational data. It can use Xpath to define the elements of the YANG data model. The sensor path of the YANG data source is configured in Xpath format, which we will explore in examples below. YANG models can be used in both dial-out and dial-in telemetry streams. If a path is a container or list, all the items under it will be streamed to the collector. YANG models support both periodic and event-based telemetry.
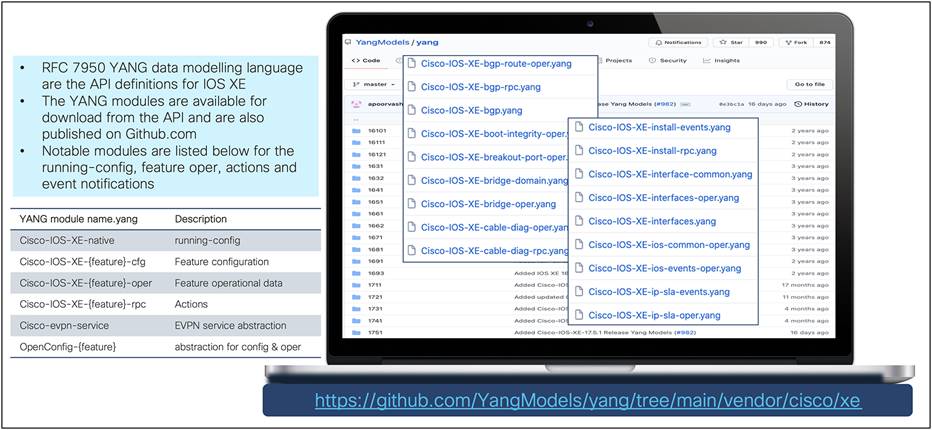
Cisco IOS XE YANG model coverage on GitHub
The YANG models supported on Cisco IOS XE are listed by XE release here: https://github.com/YangModels/yang/tree/main/vendor/cisco/xe.
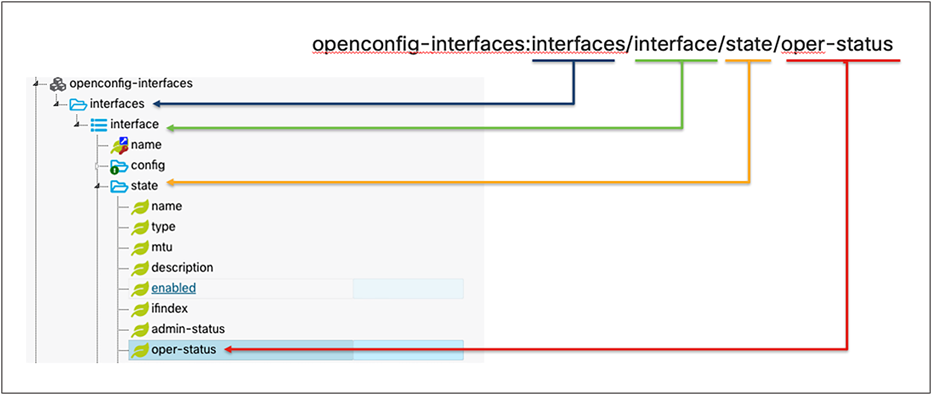
Let’s take an example with the openconfig-interfaces model by breaking down the openconfig-interfaces:interfaces/interface/state/oper-status Xpath below:
● Model name: openconfig-interfaces
● Containers, interfaces, and state
● List: interface
● Leaf: oper-status
YANG example 1
Let’s look at another example of YANG model capabilities. The following capabilities are supported in our Cisco-IOS-XE-mdt-capabilites-oper YANG model.
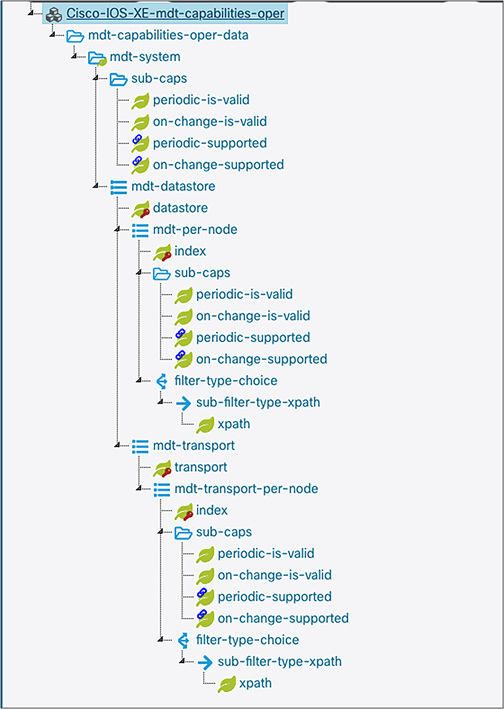
YANG example 2
To get started with telemetry, we first need to define the features and types of data to receive. The data for each feature is formatted in Xpath (RFC 6020).
The table below gives some commonly used Xpaths that are supported on a typical Cisco IOS XE device organized by data model, Xpath, and lastly a description.
Table 4. Commonly used Xpaths
| Data Model |
Xpath |
Description |
| Cisco-IOS-XE-arp-oper |
/arp-ios-xe-oper:arp-data |
ARP operational data including ARP entry. For a given address and interface, the hardware and time are provided |
| Cisco-IOS-XE-cdp-oper |
/cdp-ios-xe-oper:cdp-neighbor-details |
Cisco Discovery Protocol (CDP) neighbor operational information |
| Cisco-IOS-XE-environment-oper |
/environment-ios-xe-oper:environment-sensors |
Environment operational information including environment sensors. For a given name and location, the current sensor reading as well as low and high thresholds |
| ietf-interfaces |
/if:interfaces-state |
Interfaces and interface states following the IETF standards |
| Cisco-IOS-XE-interfaces-oper |
/interfaces-ios-xe-oper:interfaces/interface |
Interfaces and interface states following the Cisco native standards |
| Cisco-lOS-XE-native |
/ios:native |
All of the running-config is modeled here |
| Cisco-lOS-XE-lldp-oper |
/iidp-ios-xe-oper:lldp-entries |
Link Layer Discovery Protocol (LLDP) information including LLDP entries containing a LLDP entry. LLDP state details LLDP interface details |
| Cisco-lOS-XE-matm-oper |
/matm-ios-xe-oper:matm-oper-data |
MAC Address Translation Manager (MATM) information including a MATM table. For a given table—type an VLAN ID number, the aging-time and MATM MAC entry |
| Cisco-lOS-XE-mdt-oper |
/mdt-oper:mdt-oper-data/mdt subscriptions |
Streaming telemetry operational data including model driven telemetry streams, subscriptions and connections |
| Cisco-lOS-XE-memory-oper |
/memory-ios-xe-oper:memory-statistics/memory-statistic |
Memory statics. For a particular name, the total, used, free, lowest an highest memory is provided |
| Cisco-IOS-XE-platform-oper |
/platform-ios-xe-oper:components |
Power utilization for POE or non-POE devices |
| Cisco-IOS-XE-poe-oper |
/poe-ios-xe-oper:poe-oper-data/poe-switch |
Power utilization for POE devices |
| Cisco-IOS-XE-process-cpu-oper |
/process-cpu-ios-xe-oper:cpu-usage/cpu-utilization |
CPU usage including five-seconds, one-minute, and five-minutes |
| Cisco-lOS-XE-process-memory-oper |
/process-memory-ios-xe-oper:memory-usage-processes |
Memory usage of processes. For a given process ID and name, the TeIeTYpe (TTY), memory and buffer information is provided |
For some commonly used wireless-specific Xpaths, see the table below.
Table 5. Commonly used wireless-specific Xpaths
| Data Model |
Xpath |
Description |
| Cisco-IOS-XE-wireless-access-point-oper |
/wireIess-access-point-oper:access-point-oper-data |
Wireless access point data (AP) including CAPWAP, mapping between AP ethernet MAC and base radio MAC, radio and SSID counter data |
| Cisco-IOS-XE-wireless-client-oper |
/wireIess-client-oper:client-oper-data |
Wireless client operational data including 802.11, VLAN policy, client traffic statistics, common client data, IPv4 binding and multiple IPv6 bindings |
| Cisco-IOS-XE-wireless-mobility-oper |
/wireless-mobility-oper:mobility-oper-data |
Wireless mobility operational data including mobility node data. For a given node IP, the nat IP ulink status, group name, etc |
| Cisco-IOS-XE-wireless-rrm-oper |
/wireIess-rrm-oper:rrm-oper-data/rrm-measurement |
Wireless radio RF operational data including 802.11, radio, spectrum etc |
Cisco native YANG models provide more granularity for Cisco products. Cisco native models are helpful in networks with all or mostly Cisco devices because the same models can be used across Cisco IOS XE devices, including switching, routing, and wireless devices. These models can provide more granularity since they are made specifically for Cisco products.
OpenConfig YANG models are industry standards, meaning they can be used to configure Cisco and third-party networking devices. These models are best leveraged when working with a mixed-vendor network.
Finding a YANG model Xpath for gRPC dial-out
Use YANG Suite to explore, visualize, and use YANG models. To find the Xpath for a given YANG model, navigate to YANG Suite and explore YANG. Load the YANG set and select YANG module(s). Then find the Xpath listed. To build a gRPC dial-out subscription configuration, use the format filter Xpath /<PREFIX>:<Xpath> as in the example below. Note, for Cisco IOS XE native models, the shortened format can simply be filter Xpath /<Xpath>, where <Xpath> is replaced with the Xpath found in YANG Suite.
See the example below for CPU utilization.
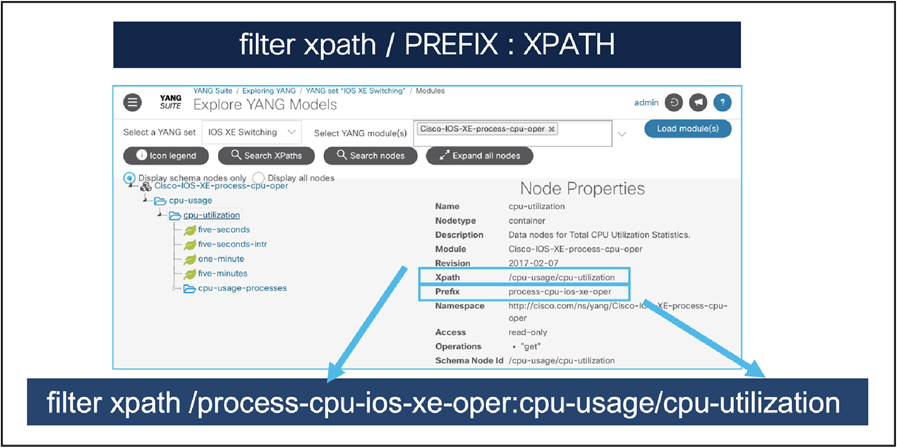
Finding an Xpath for CPU utilization
The YANG Catalog is helpful for exploring and finding YANG models from a variety of vendors and is available at https://yangcatalog.org. It is maintained by IETF with contributions from Cisco when new YANG modules are contributed as part of the standard release cycle. The YANG Catalog has a friendly API that is available to help ensure that data points can be found with ease and using automation.
YANG Catalog – Getting Started
Below is an example of using the YANG Catalog’s YANG Module Detail Viewer to view the “Cisco-IOS-XE-poe-oper” module’s tree view. This view shows that there is a container with four more containers with Power over Ethernet (PoE) port, port detail, stack, and switch level information.
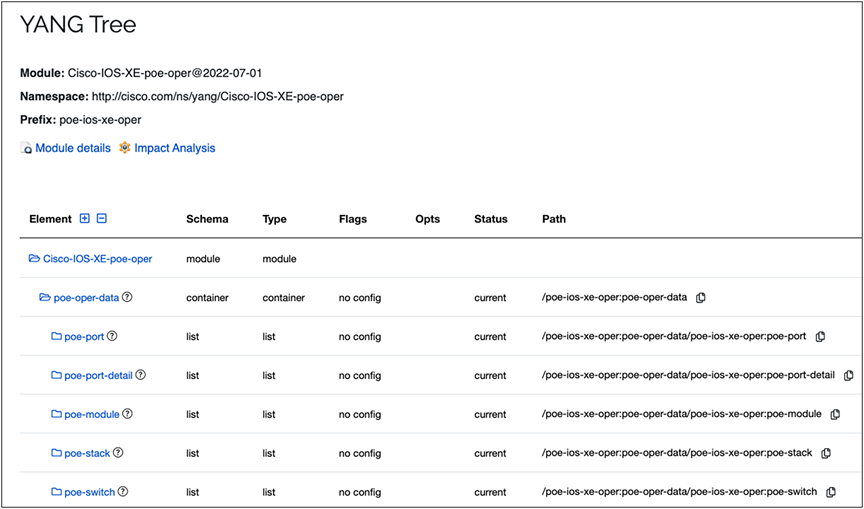
YANG Catalog – YANG Tree
Customers are continuing to move away from SNMP and toward using model-driven telemetry. Why, you may ask? The answer is demonstrated in the data from test results below. SNMP provides less data and provides that data at a slower rate than any of the MDT interfaces. Regardless of size or setup, MDT consistently provides more data at a lower CPU and memory cost than SNMP. Let’s look at the side-by-side comparisons below.
Benchmarking topology and scale
In this use case, each of the MDT options (gNMI, gRPC, NETCONF, and RESTCONF) provides data for 17 features at a CPU and memory rate faster than SNMP provides data for 1 feature (interfaces). These tests were run on a 48-port Cisco Catalyst™ 9300 Series Switch.
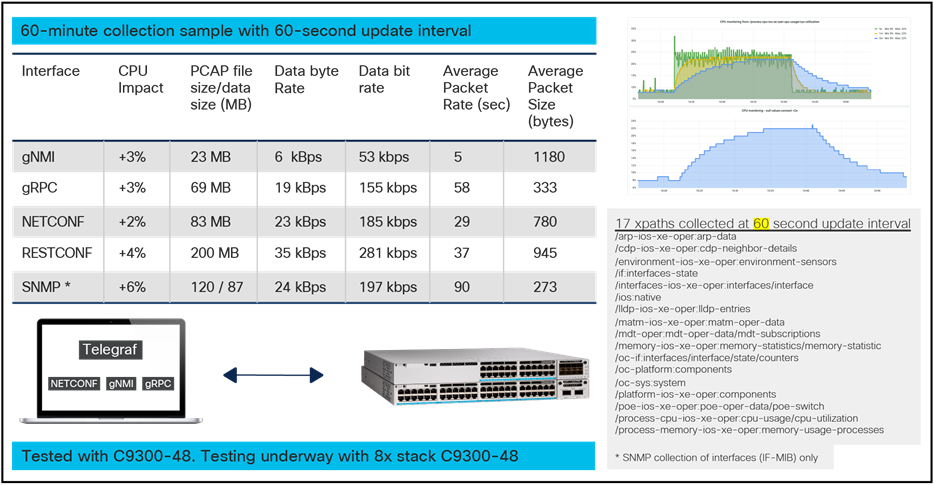
MDT usage comparison
As the examples above show, working with YANG-based models as opposed to SNMP provides a greater quantity of data at a faster rate. Overall, the industry trend is moving away from SNMP and toward using MDT because much more data can be sent across for more features with less CPU and memory impact on the Cisco IOS XE device.
Controller-level and device-level automation are both valid choices for managing a network. Device-level automation provides more control but requires more effort to manage. Conversely, controllers do not allow the granular level of control of device-level automation and are easier to manage.
For example, it is possible to deploy the individual features of a Software-Defined Access fabric device-by-device by using either NETCONF or even the CLI, with configuration management tools such as Ansible and Puppet. This allows the user more granular control than providing the configuration through Cisco Catalyst Center. However, configuring many devices for a fabric in this way would require more work to define the configuration parameters and data models and to ensure that proper validation of the configuration takes place. Cisco Catalyst Center would do these automatically.
It is also possible to use a combination of controller-based and device-based automation. For example, Cisco Catalyst Center could be used to provision and manage most of the settings in the network, but certain scripts could be used to collect certain pieces of operational data.
While the controller still manages the devices and provides a layer of abstraction to the network operator, it is still possible to use scripts or other tools to automate the network using the northbound REST APIs available to the controller.
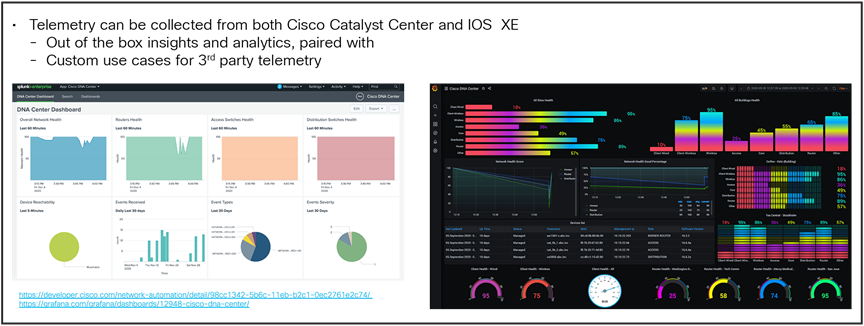
Cisco Catalyst Center provides the capabilities for ongoing and proactive monitoring of network status and for providing alerts of network failures. It uses various methods to communicate with network elements for ongoing monitoring, such as syslog, SNMP, and streaming telemetry. The Cisco Catalyst Center solution provides ongoing analysis of monitored Key Performance Indicators (KPIs) and includes the ability to provide trend-line analysis.
Additionally, it provides the capability for on-demand troubleshooting by recognizing faults in the network and suggesting recommended actions and by leveraging the path-trace application, which visualizes the route the data takes on the network. More details about Cisco Catalyst Center are available at https://cisco.com/go/dna-analytics-and-assurance.
For features not yet available in Cisco Catalyst Center, use a third-party solution or do it yourself. The Cisco Catalyst Center APIs can be used to visualize telemetry data in custom third-party dashboards.
Custom dashboarding and collection
Cisco Crosswork Suite
Cisco Crosswork® is designed with modern low-touch and no-touch operations in mind. It is multivendor and multidomain, centered on both programmatic infrastructure control and access to operational and state data, and spans both cloud/Software-as-a-Service (SaaS) and on-premises tooling. The tools in the portfolio encompass the full-service lifecycle and deliver a closed operational loop that includes planning and design, implementation, and ongoing monitoring and assurance.
While elements of the Crosswork portfolio can be licensed individually, Crosswork is also available packaged in two suite options. These suites group tools that share a common purpose and provide the advantage of lower licensing costs than if you purchased the tools individually.
Learn more about the entire Crosswork Suite options here: https://www.cisco.com/c/en/us/products/collateral/cloud-systems-management/crosswork-network-automation/crosswork-essentials-adv-suites-ds.html
Cisco Crosswork Data Gateway
Cisco Crosswork Data Gateway has been developed for real-time data collection from multivendor network devices. This application simplifies the challenges of collecting all this network traffic.
Cisco Crosswork Data Gateway is an on-premises application deployed close to network devices, enabling multiple data collection methods — MDT, SNMP, CLI, etc. The collected data is delivered securely and consumed by on-premises and cloud analytics applications. Cisco Crosswork Data Gateway enables a critical and important tenet of data collection: the collection process should be an efficient and centralized step.
Cisco Crosswork Data Gateway assumes the job of connecting to devices, collecting the data, and publishing it. Pushing a first-stage processing function closer to the source data, Crosswork Data Gateway can reduce the amount of data sent to the application and the stress on the devices, abstracting the network complexity and reducing application vendor dependencies. If the use case dictates, Cisco Crosswork Data Gateway can send the raw data for direct consumption by the registered application.
Instances of Cisco Crosswork Data Gateway can be distributed to support large-scale networks. Crosswork applications scale better by offloading data collection and processing to distributed Data Gateway instances closer to the devices.
Learn more about Cisco Crosswork Data Gateway here: https://www.cisco.com/c/en/us/products/collateral/cloud-systems-management/crosswork-network-automation/datasheet-c78-743287.html
Another solution for device monitoring using MDT is the Meraki® dashboard.
Cloud monitoring for Catalyst provides an integrated view of Catalyst 9000 switches, seamlessly integrated into the Meraki dashboard experience.
Cloud monitoring provides the ability to view Catalyst switch statistics, configuration, and troubleshooting capabilities. These switches will be automatically tagged with “Monitor Only” in the dashboard to distinguish them from fully managed Meraki switches. Aside from this difference, “Monitor Only” Catalyst switches appear and function very much like Meraki MS switches in the dashboard, including a visual representation of connected ports and traffic information.
The Meraki dashboard API is an interface for software to interact directly with the Meraki cloud platform and devices managed by Meraki. The API contains a set of tools known as "endpoints" for building software and applications that communicate with the Meraki dashboard. Use cases include provisioning, bulk configuration changes, monitoring, and role-based access controls. The dashboard API is a modern, RESTful API using HTTPS requests to a URL and JSON as a human-readable format. The dashboard API is an open-ended tool that can be used for many purposes. Here are some examples of how it is used today by Meraki customers:
● Add new organizations, administrators, networks, devices, VLANs, and Service Set Identifiers (SSIDs)
● Provision thousands of new sites in minutes with an automation script
● Automatically onboard and off-board new employees' teleworker devices
● Build your own dashboard for store managers, field techs, or unique use cases
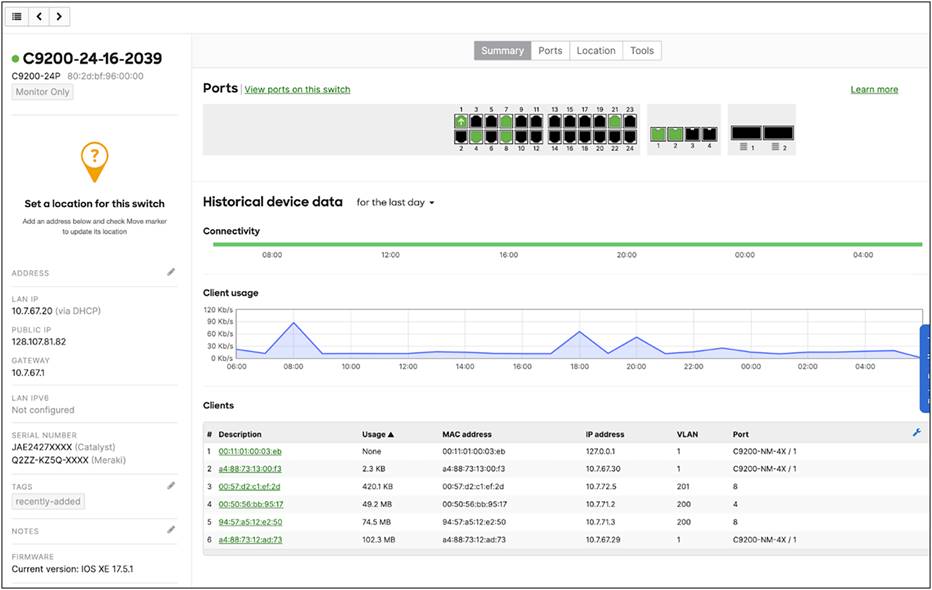
Meraki Dashboard Insights for a Cisco Catalyst 9200 Switch
Learn more about Meraki dashboard here: https://documentation.meraki.com/General_Administration/Other_Topics/Cisco_Meraki_Dashboard_API.
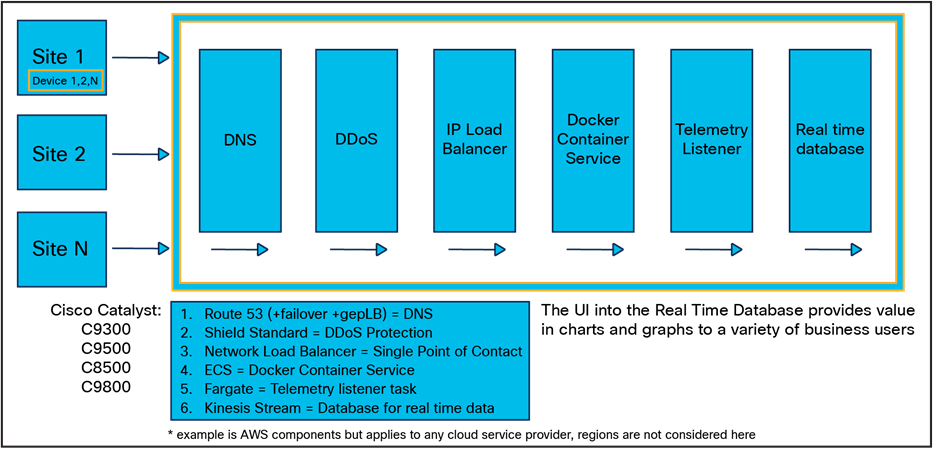
Cloud-based HA telemetry architecture in AWS*
For testing and validation, the Cisco YANG Suite tooling can be used to dial in to NETCONF and gNMI and to function as the receiver for the gRPC dial-out telemetry. Once the telemetry has been validated, there are several solutions available to process, store, and visualize the data for production use cases. The most common tooling stack is TIG, or Telegraf, InfluxDB, and Grafana. Telegraf is the collector and receiver of telemetry data directly from IOS XE. Telegraf will send any received telemetry to the InfluxDB, where it is stored and later used by other tools for visualizing the data and alerting based on it. The Grafana dashboarding tool can be used to access the data within the InfluxDB to display data over time and with more meaningful representations.
There are many tools available when working with MDT, including Cisco Telemetry Broker, YANG Suite, gNMIc, and the TIG/ELK stacks. Some of these will be covered in this section and compared by cost, support, scale, and location.
Table 6. MDT tooling
| Tool |
Description |
||
| Cisco Telemetry Data Broker |
Telemetry collector / receiver |
||
| YANG Suite |
● Testing and validation environment for using YANG models for NETCONF, RESTCONF, and Gmni
● gRPC telemetry receiver with optional TLS
|
||
| gNMIc |
gNMI testing |
||
| TIG/ELK stacks |
Telemetry receivers, databases, and visualization tools |
||
| TIG |
ELK |
||
| Receiver |
Telegraf |
ElasticSearch |
|
| Database |
InfluxDB |
Logstash |
|
| Visualization |
Grafana |
Kibana |
|
Cisco Telemetry Broker has roots in the Stealthwatch® UDP Director (UDPD), which simply replicated UDP traffic to multiple destinations. Cisco Telemetry Broker builds upon the successes of the UDPD while also creating a new Telemetry Broker market. Cisco Telemetry Broker optimizes telemetry pipelines for the hybrid cloud. In doing so, it vastly simplifies the consumption of telemetry data for customers’ business-critical tools by brokering hybrid cloud data, filtering unneeded data, and transforming data to a usable format.
The benefits of Cisco Telemetry Broker include brokering, filtering, and transforming data. It provides the ability to route and replicate telemetry data from a source location to multiple destination consumers, to filter data that is being replicated to consumers for fine-grained control over what consumers can see and analyze, and to transform data protocols from the exporter to the consumer’s protocol of choice.
Learn more about Cisco Telemetry Broker here:
● Cisco Telemetry Broker https://cs.co/telemetrybroker
● Read more in this blog post: https://blogs.cisco.com/security/taking-full-control-of-your-telemetry-with-the-intelligent-telemetry-plane
Many tools have been created to navigate through data models and device API interfaces, perform validation, and build various API operations. Cisco YANG Suite (https://developer.cisco.com/yangsuite/) provides the testing and validation environment for all IOS XE device API features and capabilities. From building and sending API payloads with NETCONF, RESTCONF, and gNMI, to receiving MDT with NETCONF, gNMI, and gRPC, this tool is widely used for a variety of validation, testing, and integration use cases.
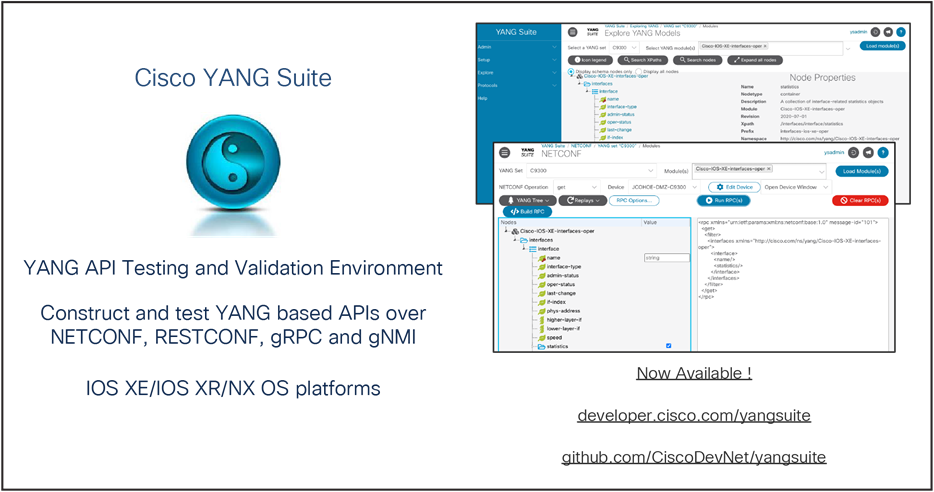
Intro to YANG Suite
Working with YANG Suite to understand YANG models
The typical workflow for getting started with MDT and using YANG Suite includes the following:
1. Run the initial setup for YANG Suite.
2. For the feature of interest, send a GET payload to understand the formatting.
3. After understanding the GET response, determine if you need this value at a certain frequency (periodic) or every time the value changes (on-change).
For more details on periodic vs. on-change notifications, see the related section above.
Examples:
◦ Periodic: CPU. If we get this value each time it changes, we’ll get constant updates, whereas 1-minute CPU updates could meet our granularity requirements.
◦ On-change: Interface shutdown. If we want to monitor interface flapping and other changes, we may want to receive this data only when a change occurs.
4. After defining the requirements for which YANG model to receive and when to receive it (periodically or on-change), we can now subscribe to the model.
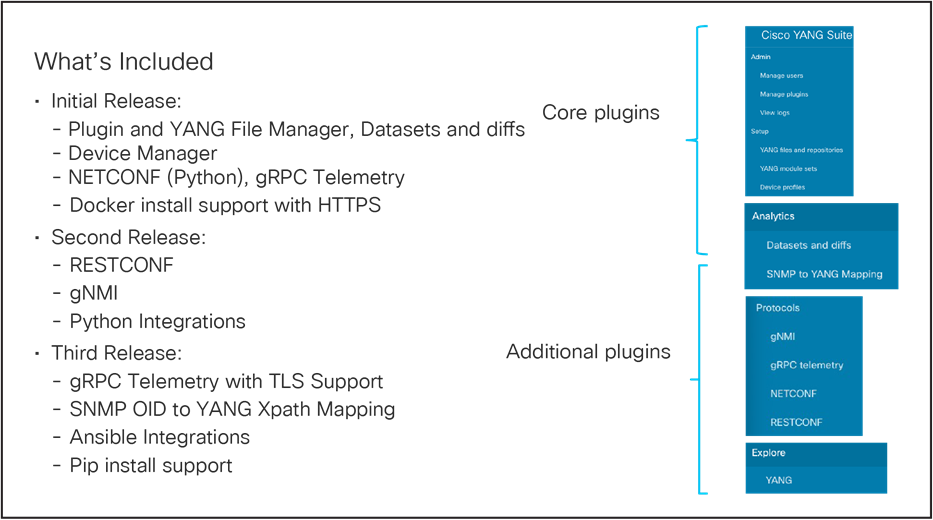
YANG Suite Capabilities
YANG Suite: YANG Explore
Use YANG Explore to understand and visualize YANG models to understand the feature and how to use Xpaths (show interfaces).
gNMI
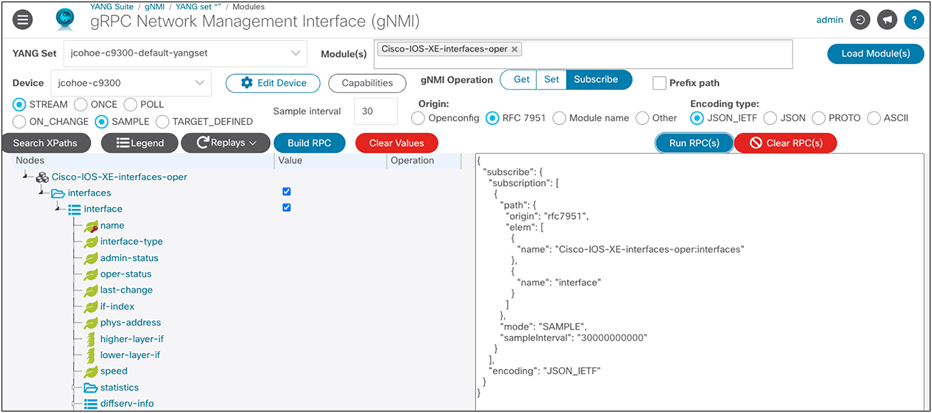
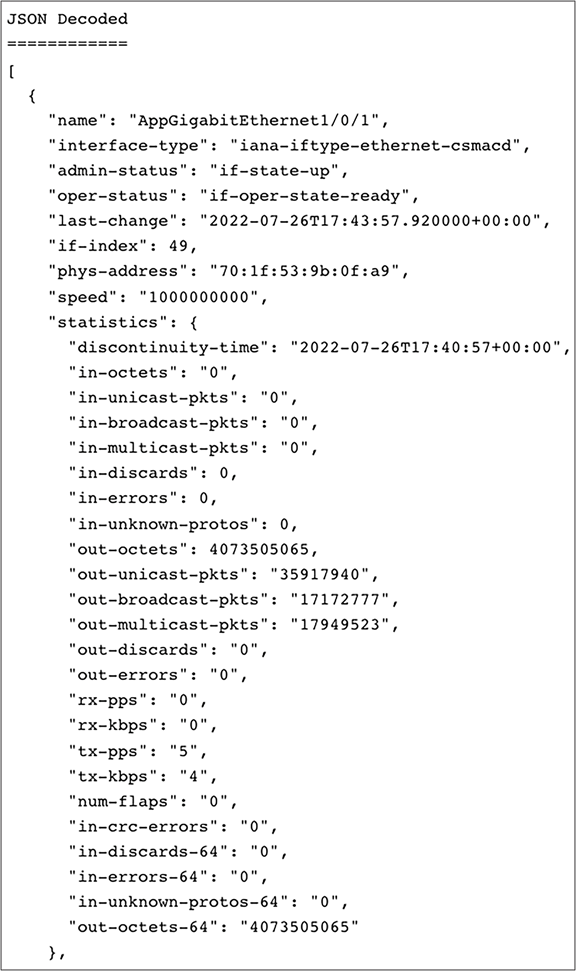
YANG Suite can be used as a receiver for dial-in gNMI subscriptions. In this case, the device will make a connection to YANG Suite through a gNMI subscribe and send data to the YANG Suite console as long as the connection is up.
In this example, we configure a gNMI subscription to OpenConfig interfaces:
gNMI Subscribe payload to send to device:
| { "subscribe": { "subscription": [ { "path": { "origin": "rfc7951", "elem": [ { "name": "Cisco-IOS-XE-interfaces-oper:interfaces" }, { "name": "interface" } ] }, "mode": "SAMPLE", "sampleInterval": "30000000000" } ], "encoding": "JSON_IETF" } }
|
See the full MDT example here: https://github.com/jeremycohoe/cisco-ios-xe-mdt#example-subscribe-to-access-point-oper-data
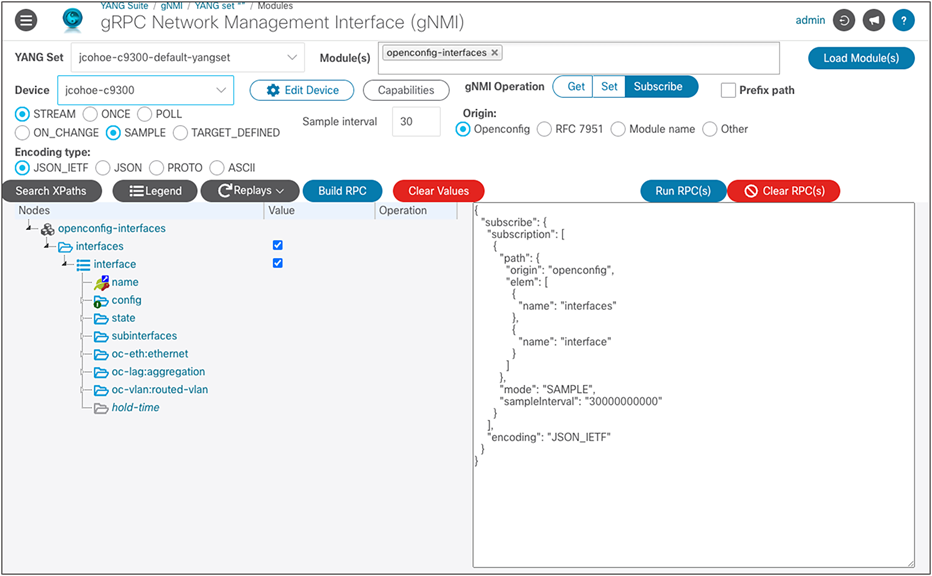
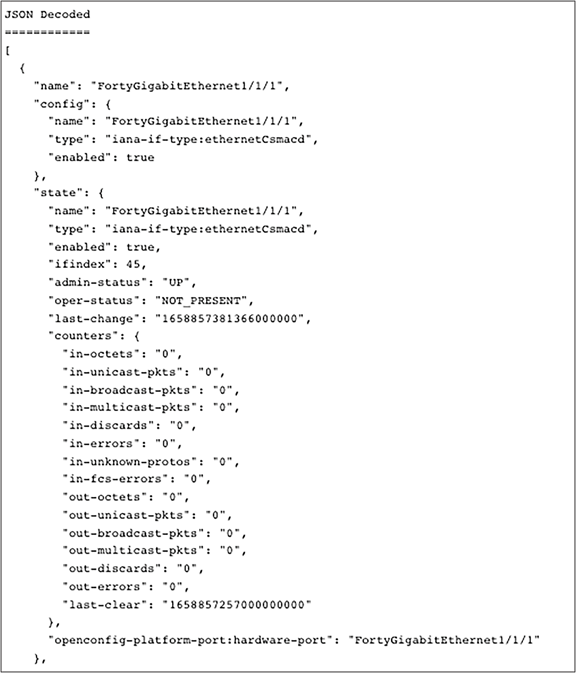
OpenConfig example:
gRPC telemetry
YANG Suite can be used as a receiver for dial-out subscriptions. In this case, gRPC telemetry data appears in the YANG Suite console.
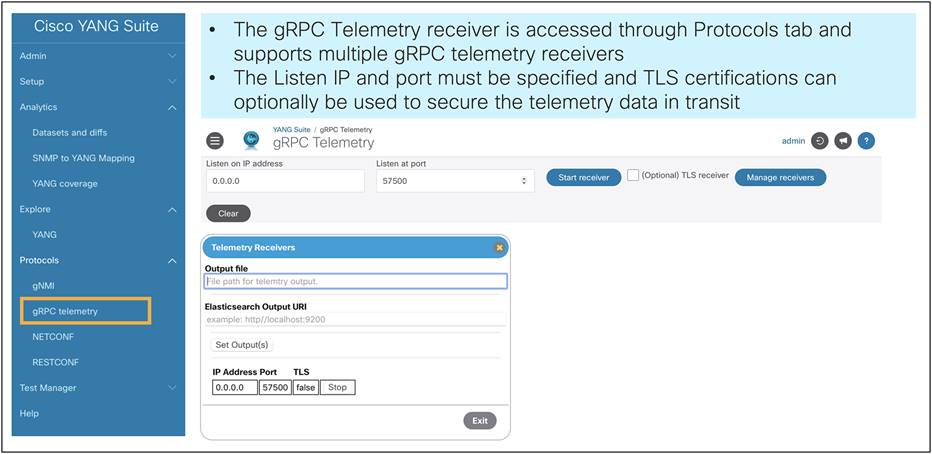
gRPC dial-out with TLS support
NETCONF subscribe operation
NETCONF can be used to configure a device, receive operational data from the device, or subscribe to a device. It can also be used to configure a dial-out subscription See an example configuration here: https://www.youtube.com/watch?v=dTun33611JA
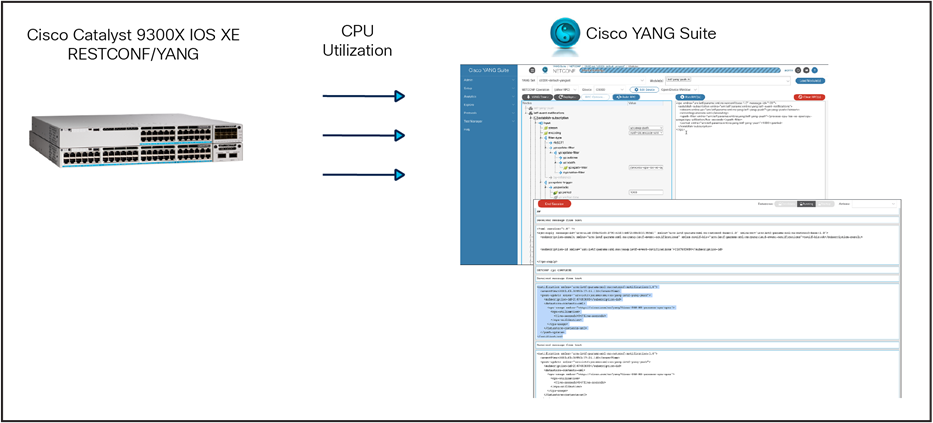
Use NETCONF and Cisco YANG Suite to monitor CPU utilization
YANG Suite plug-in: SNMP to YANG mapping
Many customers are moving aways from SNMP and toward MDT because it provides a faster way to receive more data across the wire. With the introduction of the new SNMP-to-YANG plug-in within YANG Suite, this transition from SNMP is made easier. Users can provide an SNMP object ID (OID) to run an SNMP walk against their Cisco IOS XE device. Next, they can use YANG Suite to help find the relevant YANG model associated with that SNMP OID. Once identified, the user can get the response from that data value and compare it to that of the returned value from the SNMP OID. This provides users confidence in the SNMP-to-YANG transition.
gNMIc is a user-friendly tool to use GET, SET, SUBSCRIBE, and COLLECT features using gNMI.
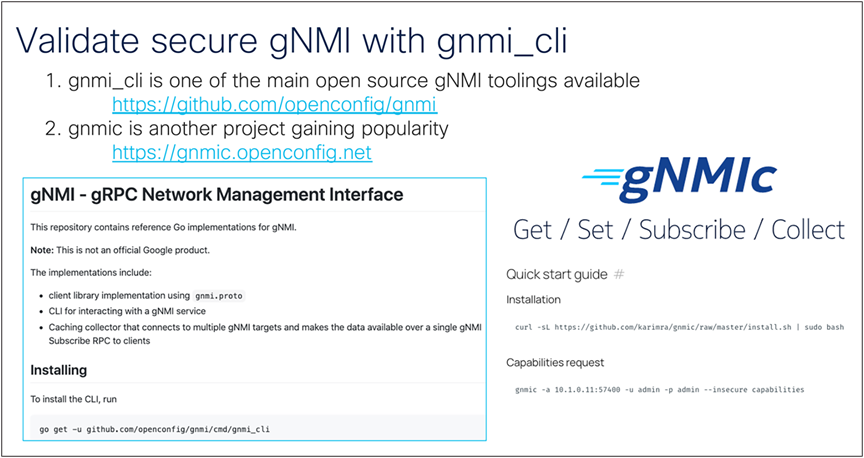
Validating secure gNMI with gnmi_cli
https://github.com/openconfig/gnmi
To securely learn about the capabilities exchange, validate the API and secure connectivity using the following command:
| $ gnmic -a c9300:9339 -u admin -p Cisco123 --log --tls-ca ./rootCA.pem --tls-cert client.crt --tls-key client.key capabilities |
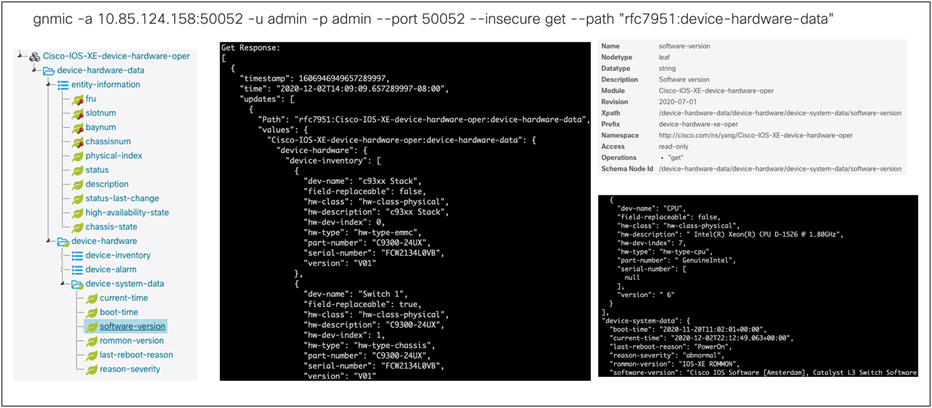
Device-hardware-data with gNMIc
Google Network Management Interface (gNMI) is the official tool created by Google to use gNMI as part of OpenConfig. Learn more here: https://github.com/openconfig/gnmi.
Dashboards help visualize trends in data over time. We can use dashboards to validate that the connection between a Cisco IOS XE device and the defined receiver is properly made.
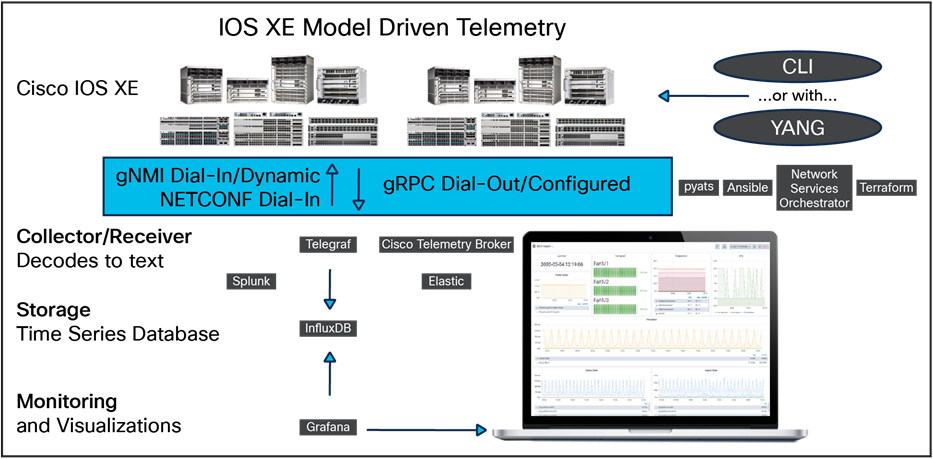
Telegraf, Influx, and Grafana (TIG) stack
Telegraf is the tool that receives and decodes the telemetry data that is sent from the IOS XE devices. It processes the data and sends it into the InfluxDB datastore, where Grafana can access it to create visualizations. gRPC dial-out telemetry was released in IOS XE 16.10, along with the open-source software stack for collection and visualization:
● Telegraf (collection): Used with the cisco_telemetry_mdt plug-in that decodes the gRPC data to text.
● InfluxDB (storage): An open-source time series database optimized for fast, high-availability storage and retrieval of time series data in fields such as operations monitoring, application metrics, Internet of Things sensor data, and real-time analytics. It provides a SQL-like language with built-in time functions for querying a data structure composed of measurements, series, and points.
● Grafana (GUI visualization): An open-source platform to build monitoring and analytics dashboards.
The TIG stack
Grafana is an open-source platform to build monitoring and analytics dashboards that also runs within the Docker container. Navigate to the web-based user interface to visualize the MDT dashboard.
The prebuilt Grafana dashboards below can be imported into an existing Grafana deployment.
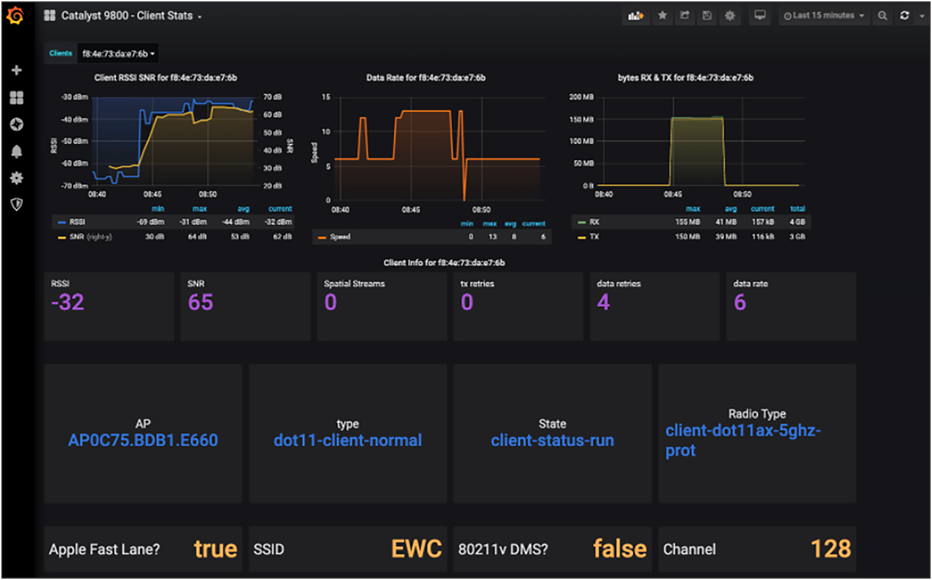
The Catalyst 9800 – Client Stats dashboard shows client statistics on a Cisco IOS XE Catalyst 9800 WLC using the gRPC dial-out MDT interface: https://grafana.com/grafana/dashboards/12468
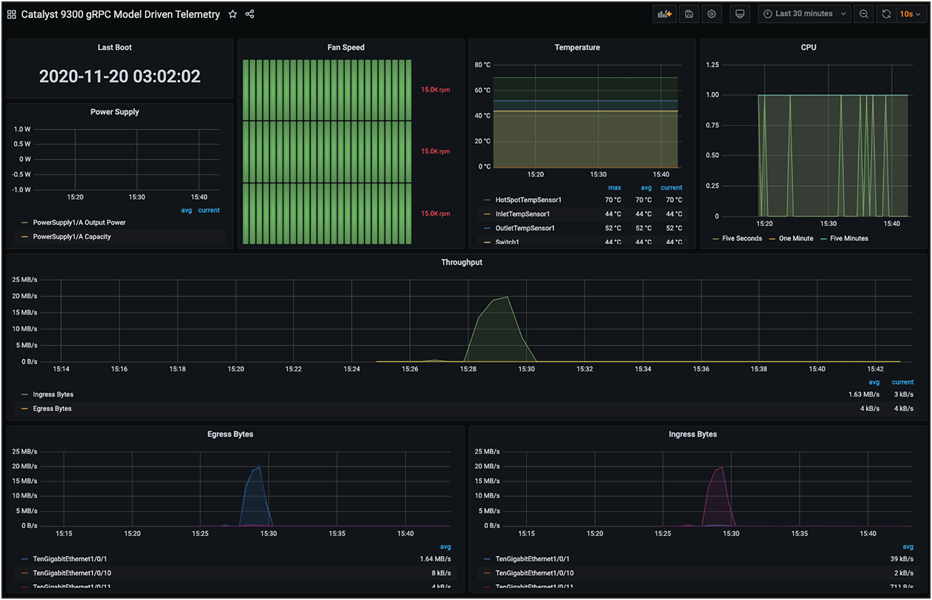
The Device Health Monitoring dashboard shows Cisco IOS XE and the Catalyst 9300 switch using the gRPC dial-out MDT interface to provide basic health and interface monitoring capabilities: https://grafana.com/grafana/dashboards/13462
Another use case for MDT is sustainability and PoE dashboards. Here, the poe-port-detail and poe-switch YANG models are used. In this case, PoE devices can be turned on and off based on the time of day when they will be used. For example, the devices in this case will be used only during the workday (around 8am to 5pm). They can be turned off during the evening to conserve energy.
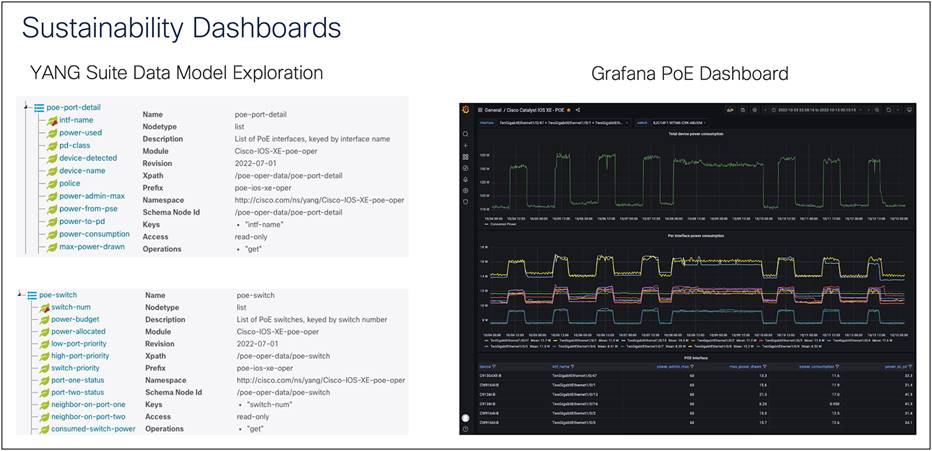
Examples of Grafana sustainability dashboards
See further examples at https://github.com/jeremycohoe/cisco-mdt-poe.
Using the Docker container with the open-source TIG stack, we can receive, store, and visualize the telemetry information.
This Docker container is maintained and updated.
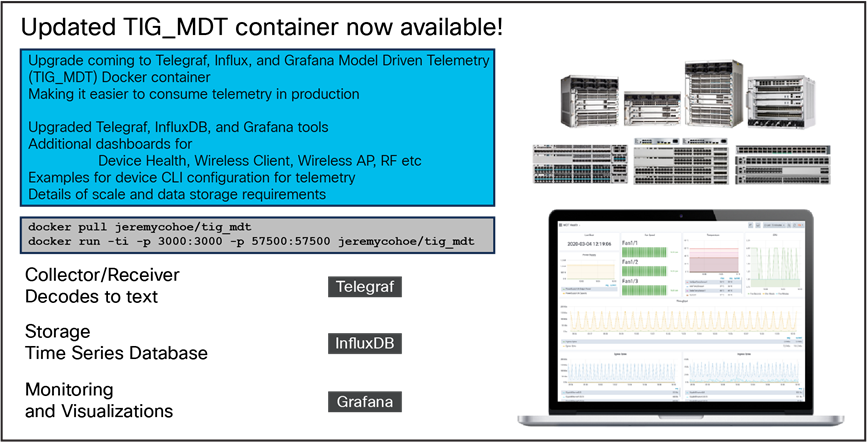
Container update announcement
To learn more, check out the following resources:
● https://hub.docker.com/r/jeremycohoe/tig_mdt
● https://github.com/jeremycohoe/cisco-ios-xe-mdt
● Programmability Configuration Guide: https://www.cisco.com/c/en/us/td/docs/ios-xml/ios/prog/configuration/1712/b_1712_programmability_cg.html.
Taking the TIG stack a step further, we can use a load balancer such as Envoy. Learn more here: https://www.envoyproxy.io/
Elasticsearch, Logstash, and Kibana (ELK) stack
Similar to the TIG stack, the ELK stack is a collection of open-source applications used for data collection and visualization. The three applications that make up the stack are:
● Elasticsearch (collection): Search and analytics engine
● Logstash (storage): Log data processor
● Kibana (GUI visualization): Visualization front end
MDT receives data on the collector in near real time. More information on the ELK stack is available from the Elastic website at https://www.elastic.co/elk-stack. The following blog post shows how to ingest NetFlow into the ELK stack: https://blogs.cisco.com/security/step-by-step-setup-of-elk-for-net.
Splunk
Splunk is a powerful data analytics and monitoring platform that can be used to collect, index, and analyze model-driven telemetry. It provides a variety of data visualization tools, including dashboards, charts, and graphs providing insights with patterns and trends in data.
For example, you can use Splunk dashboards to monitor 802.11 client probes, as in the screen shot below.
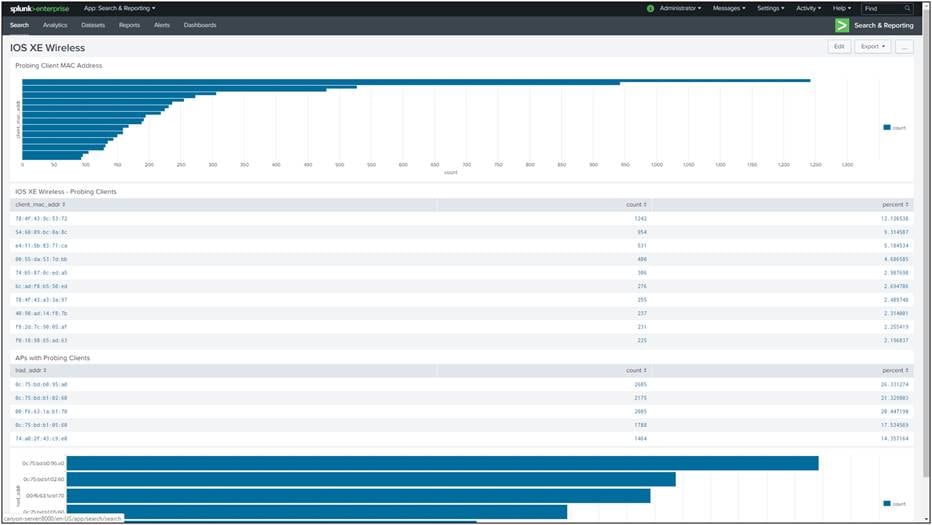
Splunk is a tool to make working with data easier. Learn more at https://www.splunk.com/.
Let’s take a deeper look at MDT seeing how dial-out and dial-in subscriptions are configured.
gRPC dial-out
Configure a gRPC dial-out periodic subscription to receive CPU utilization data:
| configure terminal telemetry ietf subscription 101 encoding encode-kvgpb filter xpath /process-cpu-ios-xe-oper:cpu-usage/cpu-utilization/five-seconds source-address 10.1.1.5 stream yang-push update-policy periodic 500 receiver ip address 10.1.1.3 57500 protocol grpc-tcp |
Analyze the main parts of the subscription configuration:
● telemetry ietf subscription 101 (subscription ID)
● encoding encode-kvgpb (encode using key-value pair using Google’s protobuf)
● filter xpath /process-cpu-ios-xe-oper:cpu-usage/cpu-utilization/five-seconds (select the Xpath associated with the YANG model describing the feature from which to receive data updates)
● update-policy periodic 500 (period in 1/100 seconds; here we receive data every 5 seconds)
● receiver IP address 10.1.1.3 57500 protocol grpc-tcp (receiver’s IP, port, and protocol)
Verify the configured subscription using the following telemetry IOS XE commands:
| c9300# sh telemetry ietf subscription all |
The result should look like the following:
| Telemetry subscription brief
ID Type State Filter type ------------------------------------------------------- 101 Configured Valid xpath |
Additionally, you can view the details for this subscription using the following show command:
| c9300# sh telemetry ietf subscription 101 detail |
The result should look like the following:
| Telemetry subscription detail: Subscription ID: 101 Type: Configured
sh telemetry ietf subscription 11 detail Telemetry subscription detail: Subscription ID: 11 Type: Configured State: Valid Stream: yang-push Filter: Filter type: xpath XPath: /process-cpu-ios-xe-oper:cpu-usage/cpu-utilization/one-minute Update policy: Update Trigger: periodic Period: 2000 Encoding: encode-kvgpb Source VRF: Source Address: 10.85.134.65 Notes: Subscription validated
Named Receivers: Name Last State Change State Explanation ------------------------------------------------------------------------------------- grpc-tcp://10.85.134.66:57500 03/05/24 11:22:43 Connected
|
Similarly, we can create the same subscription, but this time using a named receiver. This is helpful when creating many subscriptions that will all send data to the same receiver. To create a gRPC dial-out or push-based subscription to gather CPU data every 2 seconds, configure the following on a Cisco IOS XE device:
| conf t telemetry ietf subscription 1010 encoding encode-kvgpb filter xpath /process-cpu-ios-xe-oper:cpu-usage/cpu-utilization/five-seconds source-address 10.1.1.5 stream yang-push update-policy periodic 2000 receiver-type protocol receiver name yangsuite
telemetry receiver protocol yangsuite host name 10.1.1.3 57500 protocol grpc-tcp |
gRPC dial-out with FQDN
There are two components to configure for the DNS-based telemetry receiver. The telemetry ietf subsection remains similar to previous versions; however, the receiver type and receiver name commands are new. These are used to define the host and port that the telemetry subscriptions use.
Instead of an IP address, the DNS name can now be used when configuring the telemetry receiver. The following example covers the gRPC dial-out with DNS telemetry released in Cisco IOS XE 17.6. In this case, the DNS name is yangsuite-telemetry.cisco.com.
Table 7. Configuring a telemetry receiver
| Command or action |
Purpose |
| configure terminal |
Enters global configuration mode. |
| telemetry ietf subscription 1010 |
Creates a telemetry subscription and enters telemetry-subscription mode. |
| encoding encode-kvgpb |
Specifies kvGPB encoding. |
| filter xpath /process-cpu-ios-xe-oper:cpu-usage/cpu-utilization/five-seconds |
Specifies the XPath filter for the subscription. |
| source-address 10.1.1.5 |
Specifies the IP address of the Cisco device that will send data to the receiver (defined below). |
| stream yang-push |
Configures a stream for the subscription. |
| update-policy periodic 2000 |
Configures a periodic update policy for the subscription. |
| receiver-type protocol |
Configures a protocol-type receiver. |
| receiver name yangsuite |
Defines the host that the telemetry subscriptions use. This can be an IP address or a DNS name. |
| telemetry receiver protocol yangsuite |
Configures the device to receive and process telemetry data using the YANG Suite protocol. |
| host name yangsuite-telemetry.cisco.com 57500 |
Configures the device to use the hostname yangsuite-telemetry.cisco.com and port number 57500 for remote telemetry data transmissions. |
| protocol grpc-tcp |
Specifies the transport protocol to be used for the gRPC service. |
For more information about model-driven telemetry, refer to the Programmability Configuration Guide, Cisco IOS XE Dublin 17.12.x: https://www.cisco.com/c/en/us/td/docs/ios-xml/ios/prog/configuration/1712/b_1712_programmability_cg/m_1712_prog_ietf_telemetry.html
To enable the gNMI dial-in MDT interface, use the following commands. Refer to the gNMI module for more details.
Versions earlier than 17.3
| gnmi-yang gnmi-yang server |
The term “gNxI” is used to encompass all Google protocol components, including gRPC, gNMI, and gNOI. As of Cisco IOS XE Release 17.3, the “gnxi” configuration is used in place of the previous “gnmi-yang.”
Version 17.3 or later
| gnxi |
Note: This enables gNMI only in insecure mode. The command gnmi-yang secure-server (<v17.3) or gnxi secure-server (v17.3+) enables the gNMI server in secure mode and requires TLS certificates to be loaded into IOS XE first.
The following example uses the gnmi_cli tool to create an insecure subscription with the following flags:
| gnmi_cli -address 10.1.1.5:9339 -server_name c9300 -with_user_pass -timeout 5s -ca_crt rootCA.pem -client_crt client.crt -client_key client.key -proto "$(cat ~/gnmi_proto/sub_vlan1.txt)" -dt p |
The NETCONF MDT interface needs only to be enabled within IOS XE. Once enabled, the dial-in (dynamic) connection can be established from the tooling.
Enable NETCONF telemetry using the netconf-yang command:
| configure terminal netconf-yang |
The Authentication, Authorization, and Accounting (AAA) requirements for NETCONF are for the user to have privilege level 15 upon login, which can be achieved using either local or RADIUS-based authentication, as shown below:
| configure terminal aaa new-model aaa authentication login default local aaa authorization exec default local aaa session-id common username admin privilege 15 password 0 Cisco123 |
Telemetry configuration management
Catalyst Center composite template
Cisco Catalyst Center composite templates make it possible for configuration templates to be grouped and used to simplify deployment of configurations. This would be analogous to creating a template for a branch router or a hub router, which can then apply individual templates for that particular device class.
In the context of telemetry, this means you can add templates for different functions that may be standard configurations within an organization, such as a template for NETCONF or for gNMI dial-out. These feature templates can then be applied within a composite template for a given deployment.
This document will not provide exhaustive documentation on the full functionality of templates, but it is very easy to create templates to enable specific MDT capabilities, such as enabling gNMI and NETCONF, as well as adding subscriptions. Once these base templates are created, apply them to composite templates for a device deployment, such as a “Branch Routers” template.
This capability becomes increasingly useful when rationalizing a telemetry policy across an existing IT infrastructure, which can have well over a decade of legacy equipment in production, some of which may not support the most recent capabilities. Within Catalyst Center, you can have a template for the features and also generational composite templates, which can match a particular software version or device type. For example:
● Newer Catalyst 9000: Match to the Catalyst 9000 template, which includes more recent features.
● Older Catalyst 4500 switches: Match to the Catalyst 4500 template, which doesn’t include some recent streaming telemetry or gNMI features.
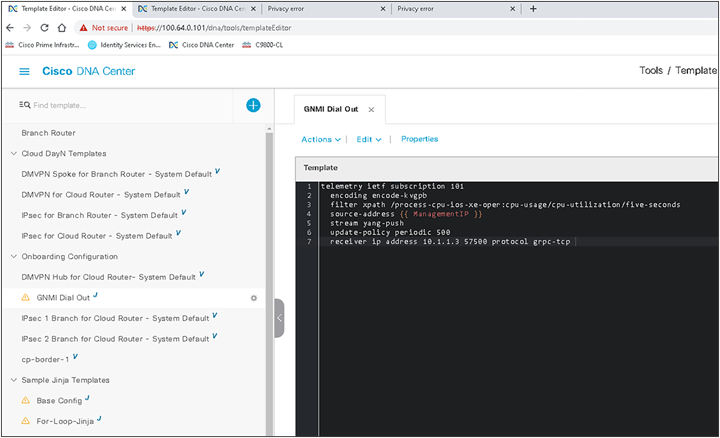
Below is an example of how to create a template in Catalyst Center. We can create feature-specific or OS-specific “configlets,” which we then stitch together into a composite sequence. We can allow this template to match to particular OS or device types or software versions.
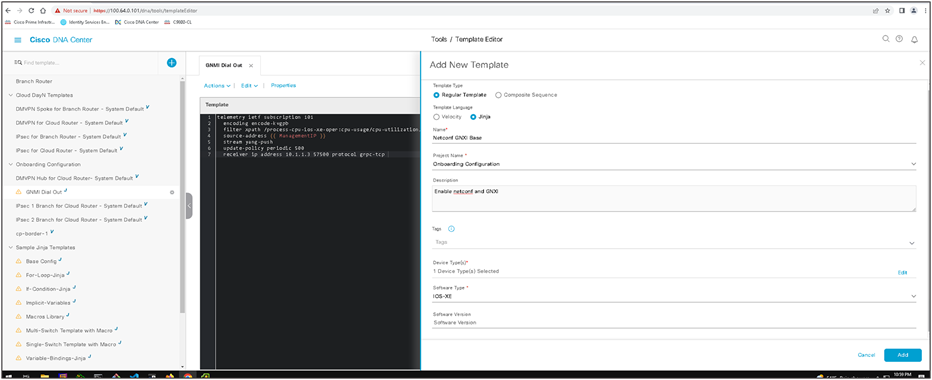
The screen shot below shows the configuration in the Catalyst Center template of the gNMI dial-out feature, which will apply the configuration for gNMI dial-out. A feature of these templates is the ability to inherit or use variables, and below you can see that the management IP can be referenced as a source for the gNMI dial-out, without having to manually create the configuration for every device.
To begin the composite template, we create a composite template similar to the regular template in the prior example. We fill it out with an appropriate name and matching device types/OS levels.
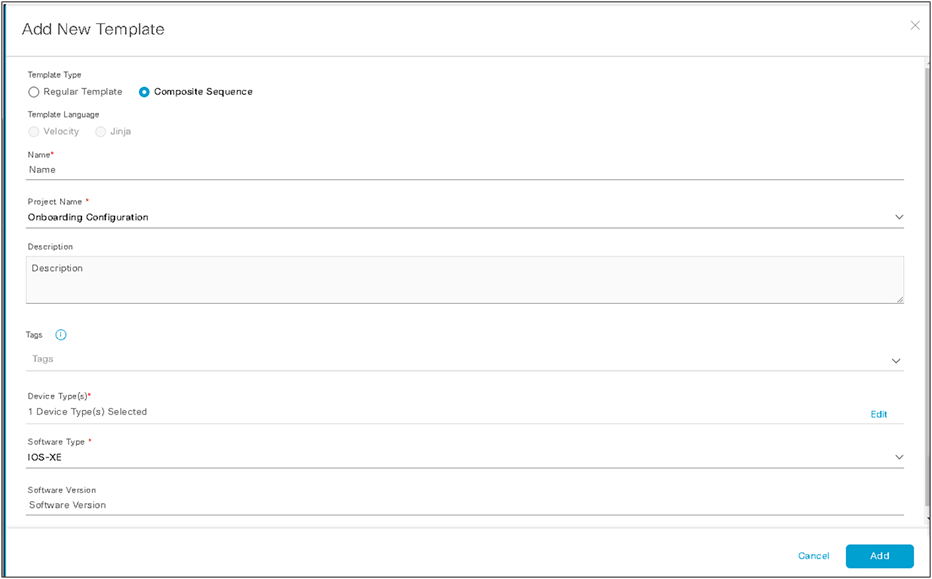
After finishing the first part of the composite template, note that the configuration screen allows us to select, add, delete, and reorder the regular templates in a sequence. Whereas in the regular template we applied syntax, the composite template is an ordered structure of existing regular templates to apply to a device.
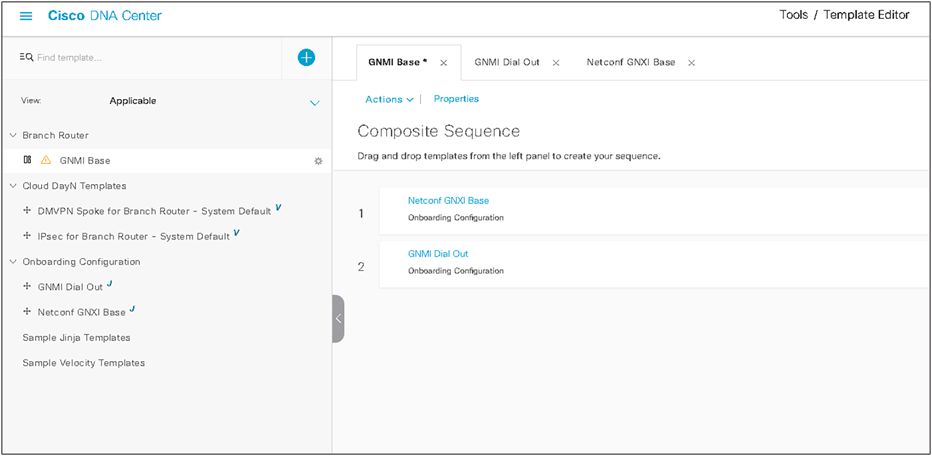
As you can see, through the use of composite templates, you have the ability to deploy programmability features that take into account the device’s capabilities and role in the network.
Crosswork Health Insights now supports MDT from XR, XE, and NX OS.
Cisco Network Service Orchestrator (NSO)
Cisco Network Services Orchestrator is an orchestration platform for hybrid networks.
Northbound, NSO provides a number of interfaces, including NETCONF and REST, based on services defined using YANG data models to automate network services.
NSO supports various southbound network management protocols, including NETCONF and CLI, to maintain multivendor device configurations in the network.
Some of the advantages of NSO are:
● Device abstraction: Abstracts device details and focuses on the network services that are being managed.
● Networkwide transactions: Enables networkwide transactional service provisioning.
● Simplified automation: Provides a simpler automation workflow.
● Multivendor: Makes it possible to manage multivendor environments.
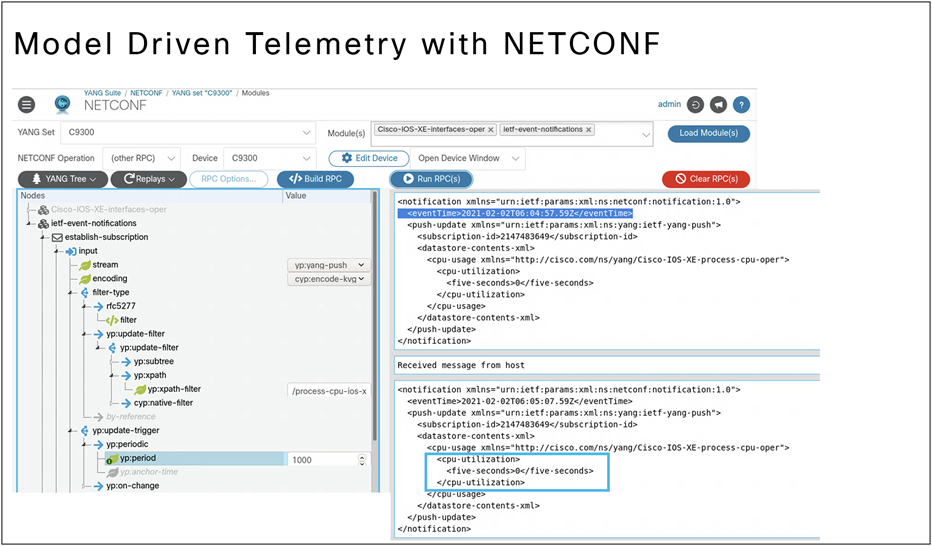
YANG Suite NETCONF
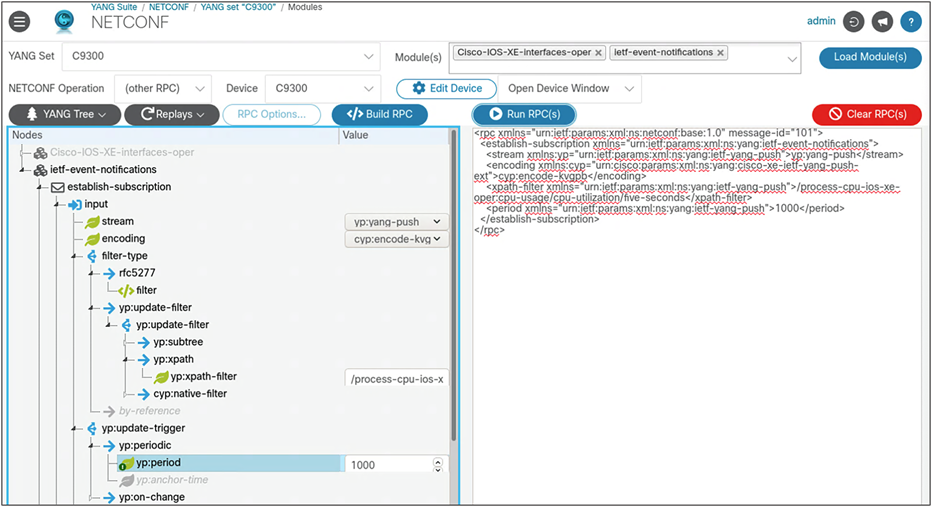
YANG Suite can be used to configure a gRPC dial-out connection using the following steps.
1. Select the YANG set.
2. Select the YANG modules. In this case, use ietf-event-notifications.
3. Click the blue Load Module(s) button.
4. For NETCONF Operation, select “(other RPC)” from the drop-down menu.
5. Select the device.
6. Expand the tree and provide:
◦ Stream: yp:yang-push
◦ Encoding: cyp:encode-kvg
◦ Yp:xpath-filter: /process-cpu-ios-xe-oper:cpu-usage/cpu-utilization/five-seconds
◦ Yp:period: 1000
7. Select the blue Build RPC button.
8. After verifying that the build RPC looks correct and all the inputs provided are as expected, select the blue Run RPC(s) button.
The following screen shot illustrates the steps described above:
For further details, watch this video: https://www.youtube.com/watch?v=dTun33611JA
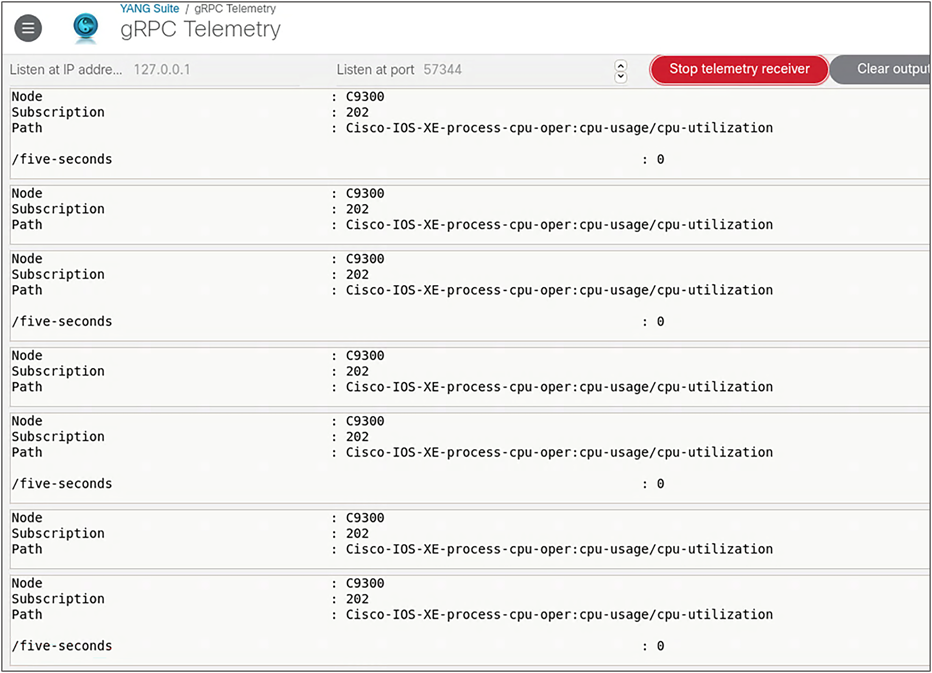
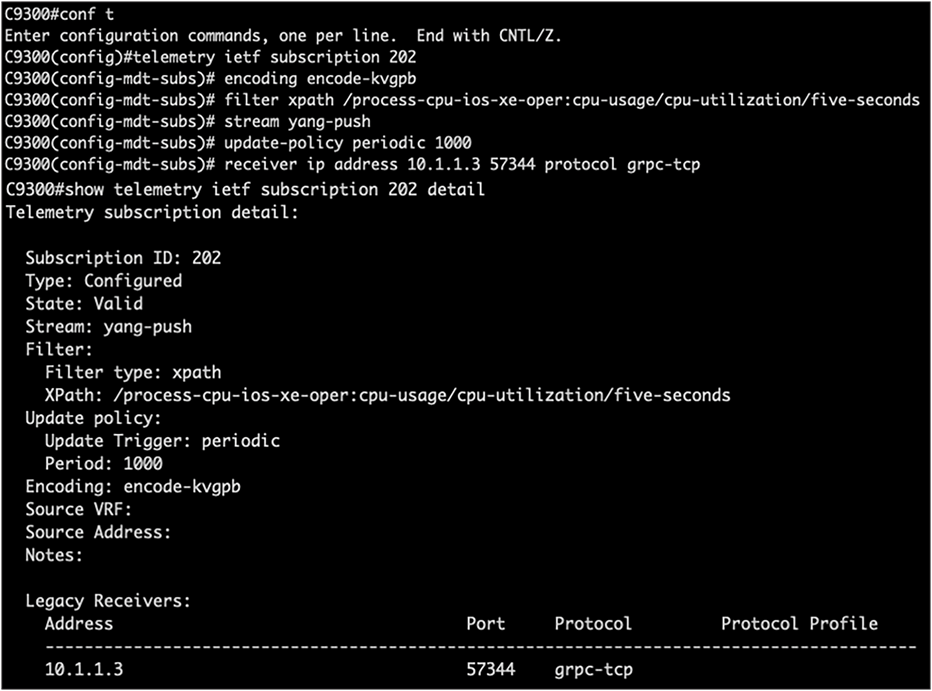
YANG Suite can be used as a gRPC telemetry receiver. For example, when a CPU telemetry subscription is configured on an IOS XE device, YANG Suite can be used to collect the telemetry data. In this case, the following telemetry subscription is applied to a Catalyst 9300 switch.
| configure terminal telemetry ietf subscription 202 encoding encode-kvgpb filter xpath /process-cpu-ios-xe-oper:cpu-usage/cpu-utilization/five-seconds stream yang-push update-policy periodic 1000 receiver ip address 10.1.1.3 57344 protocol grpc-tcp |
After the subscription is configured, YANG Suite can be used to receive the data. To do this, complete the following steps:
1. From YANG Suite, navigate to Protocols then gRPC Telemetry.
2. Add the IP and port of the receiver configured in the line receiver ip address 10.1.1.3 57344 protocol grpc-tcp.
3. Start the telemetry receiver.
4. Note that the data is coming in at regular intervals.
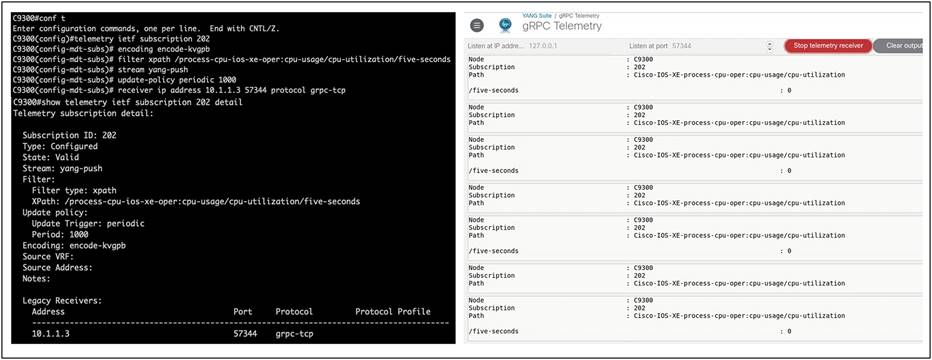
Configuring an MDT receiver for gRPC
Generate an Ansible playbook using YANG Suite
YANG Suite can be use generate Ansible playbooks. Playbooks built in YANG Suite can be replicated, which can be helpful for reconfiguring devices at scale. This can be done using the NETCONF, RESTCONF, and gNMI plug-ins. For gNMI, OpenConfig is supported. The following example uses these steps to generate an Ansible Playbook:
1. After building a payload in YANG Suite, select the gray Replays button and click “Generate Ansible Playbook.”
2. Provide names for the file, playbook, and task, respectively.
3. The Ansible Playbook will be downloaded to the device running YANG Suite.
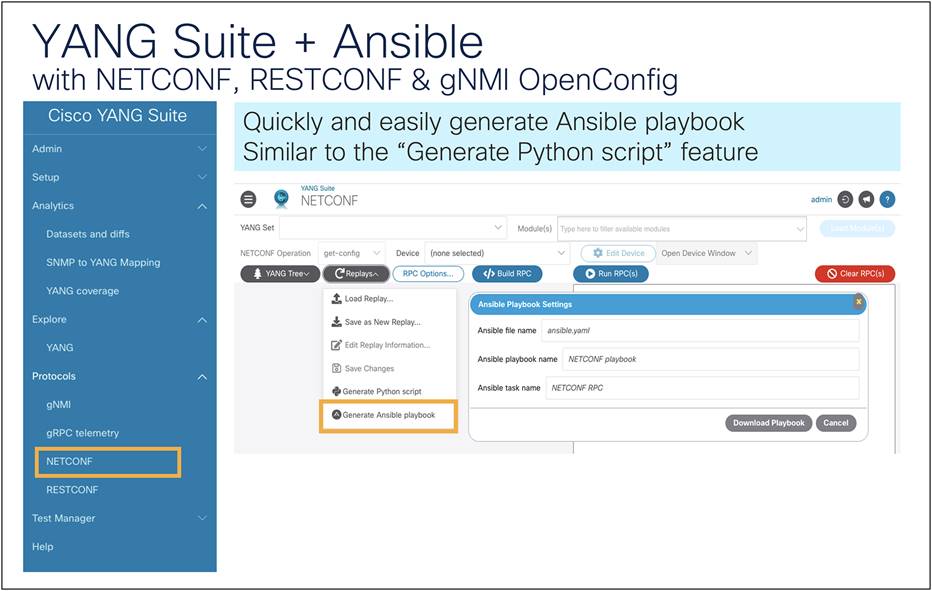
Generating an Ansible playbook using YANG Suite
For example, you can configure multiple gRPC dial-out subscriptions at once using NETCONF to configure the Cisco IOS XE device.
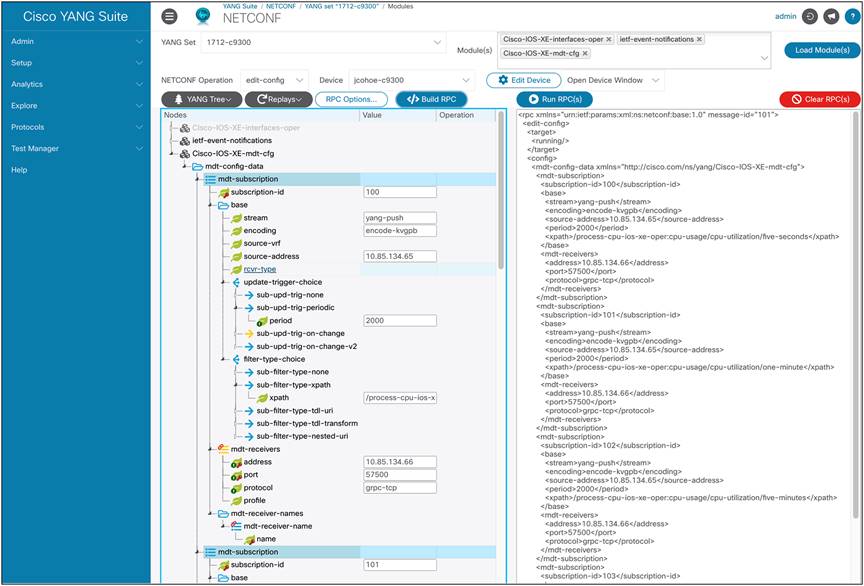
Configuring gRPC dial-out subscriptions using NETCONF
To do this, select the following in YANG Suite:
1. Navigate to the NETCONF protocol.
2. Specify the YANG set and load the Cisco-IOS-XE-mdt-cfg model.
3. Select the device.
4. Expand the tree and add the following:
a. Under the mdt-subscription list:
◦ subscription-id: 100
◦ encoding: yang-push
◦ source-address: 10.85.134.65 (replace with the proper source address for the given network)
◦ period: 2000
b. Under update-trigger-choice, sub-upd-trig-periodic:
◦ xpath: /process-cpu-ios-xe-oper:cpu-usage/cpu-utilization/five-seconds
c. Under mdt-receivers:
◦ receiver: 10.85.134.66 (replace with the proper receiver address for the given network)
◦ port: 57500 (replace with the proper receiver port for the given network)
◦ protocol: grpc-tcp
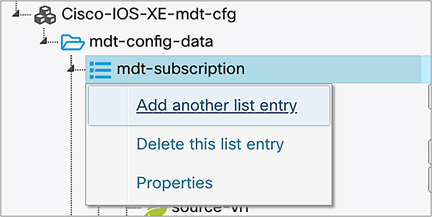
5. Note: This will create one subscription. To add more subscriptions, right-click “mdt-subscription” and select “Add another list entry.”
Next, generate the Ansible playbook and provide the necessary names for the file, playbook, and task.
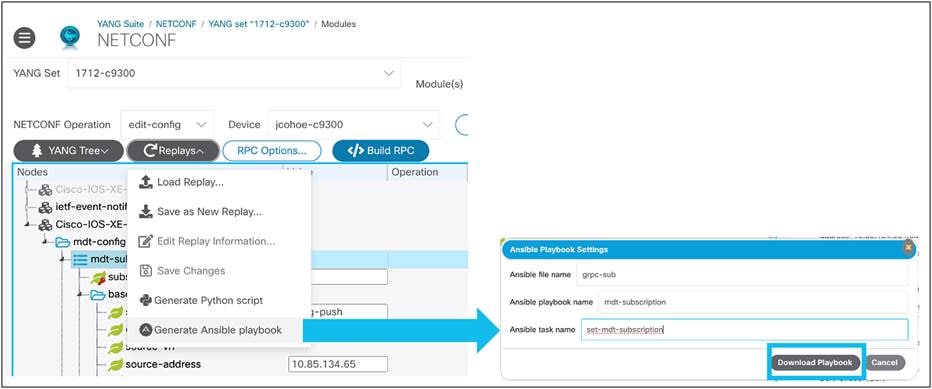
Generating an Ansible playbook to configure telemetry subscriptions at scale
The result will look like the following with instructions on how to use the playbook at the top. Note: the variable MY_HOST_NAME will need to change per the specific network:
| # Ansible will need some basic information to make sure # it can connect to the target device before attempting # a NETCONF message. Ansible will look in the same directory # as the playbook file for ansible.cfg. # # Nearly all parameters in ansible.cfg can be overridden # with ansible-playbook command line flags.
# Example of basic ansible.cfg file # #[defaults] #inventory = ./ansible_host #host_key_checking = False #remote_user = USERNAME_HERE
# Example of basic ansible_host file referred to in # ansible.cfg inventory. # #[all:vars] #ansible_connection=netconf #ansible_password=PASSWORD_HERE # #[MY_HOST_NAME] #IP_ADDRESS_HERE # - name : mdt-subscription hosts: MY_HOST_NAME connection: netconf gather_facts: no
tasks: - name: add-mdt-subscriptions netconf_config: xml: | <config xmlns="urn:ietf:params:xml:ns:netconf:base:1.0"> <mdt-config-data xmlns="http://cisco.com/ns/yang/Cisco-IOS-XE-mdt-cfg"> <mdt-subscription> <subscription-id>100</subscription-id> <base> <stream>yang-push</stream> <encoding>encode-kvgpb</encoding> <source-address>10.85.134.65</source-address> <period>2000</period> <xpath>/process-cpu-ios-xe-oper:cpu-usage/cpu-utilization/five-seconds</xpath> </base> <mdt-receivers> <address>10.85.134.66</address> <port>57500</port> <protocol>grpc-tcp</protocol> </mdt-receivers> <mdt-receivers> <address>10.85.134.66</address> <port>57500</port> </mdt-receivers> </mdt-subscription> <mdt-subscription> <subscription-id>101</subscription-id> <base> <stream>yang-push</stream> <encoding>encode-kvgpb</encoding> <source-address>10.85.134.65</source-address> <period>2000</period> <xpath>/process-cpu-ios-xe-oper:cpu-usage/cpu-utilization/one-minute</xpath> </base> <mdt-receivers> <address>10.85.134.66</address> <port>57500</port> <protocol>grpc-tcp</protocol> </mdt-receivers> <mdt-receivers> <address>10.85.134.66</address> <port>57500</port> </mdt-receivers> </mdt-subscription> </mdt-subscription> </mdt-config-data> </config> |
Generate Python scripts using YANG Suite
YANG Suite can be used to generate Python scripts. Similar to YANG Suite’s capability to generate Ansible playbooks, generating Python scripts is helpful when building a payload to replay later to the same device or to many devices at scale. This can be used with both the NETCONF and RESTCONF YANG Suite plug-ins. In the following example, we will edit a VLAN ID:
1. After building a payload in YANG Suite, select the gray Replays button and click “Generate Python script.”
2. The Python script will be downloaded to the device running YANG Suite.
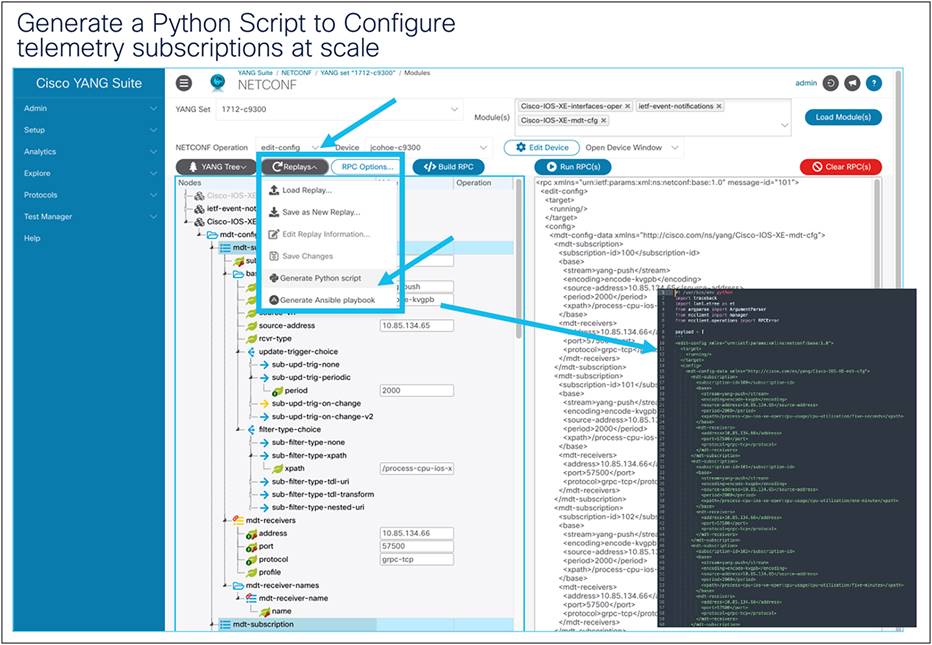
Generating a Python script to configure telemetry subscriptions at scale
Similar to the Ansible example above, the same payload is built in YANG Suite. Next we can generate a Python script to configure the necessary gRPC dial-out subscriptions using NETCONF.
The resulting Python script will look like the following:
| #! /usr/bin/env python import traceback import lxml.etree as et from argparse import ArgumentParser from ncclient import manager from ncclient.operations import RPCError
payload = [ ''' <edit-config xmlns="urn:ietf:params:xml:ns:netconf:base:1.0"> <target> <running/> </target> <config> <mdt-config-data xmlns="http://cisco.com/ns/yang/Cisco-IOS-XE-mdt-cfg"> <mdt-subscription> <subscription-id>100</subscription-id> <base> <stream>yang-push</stream> <encoding>encode-kvgpb</encoding> <source-address>10.85.134.65</source-address> <period>2000</period> <xpath>/process-cpu-ios-xe-oper:cpu-usage/cpu-utilization/five-seconds</xpath> </base> <mdt-receivers> <address>10.85.134.66</address> <port>57500</port> <protocol>grpc-tcp</protocol> </mdt-receivers> </mdt-subscription> <mdt-subscription> <subscription-id>101</subscription-id> <base> <stream>yang-push</stream> <encoding>encode-kvgpb</encoding> <source-address>10.85.134.65</source-address> <period>2000</period> <xpath>/process-cpu-ios-xe-oper:cpu-usage/cpu-utilization/one-minute</xpath> </base> <mdt-receivers> <address>10.85.134.66</address> <port>57500</port> <protocol>grpc-tcp</protocol> </mdt-receivers> </mdt-subscription> <mdt-subscription> <subscription-id>102</subscription-id> <base> <stream>yang-push</stream> <encoding>encode-kvgpb</encoding> <source-address>10.85.134.65</source-address> <period>2000</period> <xpath>/process-cpu-ios-xe-oper:cpu-usage/cpu-utilization/five-minutes</xpath> </base> <mdt-receivers> <address>10.85.134.66</address> <port>57500</port> <protocol>grpc-tcp</protocol> </mdt-receivers> </mdt-subscription> </mdt-subscription> </mdt-config-data> </config> </edit-config> ''', ]
if __name__ == '__main__':
parser = ArgumentParser(description='Usage:')
# script arguments parser.add_argument('-a', '--host', type=str, required=True, help="Device IP address or Hostname") parser.add_argument('-u', '--username', type=str, required=True, help="Device Username (netconf agent username)") parser.add_argument('-p', '--password', type=str, required=True, help="Device Password (netconf agent password)") parser.add_argument('--port', type=int, default=830, help="Netconf agent port") args = parser.parse_args()
# connect to netconf agent with manager.connect(host=args.host, port=args.port, username=args.username, password=args.password, timeout=90, hostkey_verify=False, device_params={'name': 'csr'}) as m:
# execute netconf operation for rpc in payload: try: response = m.dispatch(et.fromstring(rpc)) data = response.xml except RPCError as e: data = e.xml pass except Exception as e: traceback.print_exc() exit(1)
# beautify output if et.iselement(data): data = et.tostring(data, pretty_print=True).decode()
try: out = et.tostring( et.fromstring(data.encode('utf-8')), pretty_print=True ).decode() except Exception as e: traceback.print_exc() exit(1)
print(out) |
Ansible is an agentless management tool that can be used to configure any device features using SSH CLI, and it also has support for NETCONF, RESTCONF, and gNMI-modeled configurations. Ansible is heavily used to configure a variety of applications, services, and network topologies, including Border Gateway Protocol ‒ Ethernet VPN (BGP-EVPN).
Terraform is a popular cloud-native and agentless tool that leverages the RESTCONF API to define the intended infrastructure-as-code (IaC) state. It is used to orchestrate and configure a variety of cloud services, applications, and network devices.
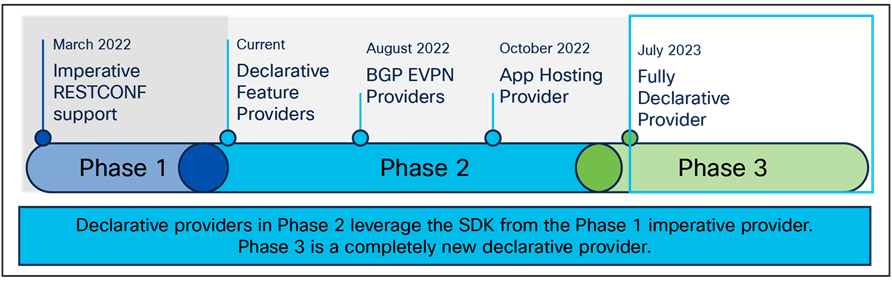
Evolution of Terraform providers
The first phase of Cisco IOS XE Terraform support included an imperative Terraform provider. Most Terraform users work with a declarative format, so BGP-EVPN and App Hosting declarative providers were introduced in phase 2. These declarative providers leveraged the SDK and GO files from the phase 1 imperative provider. More recently, phase 3 was introduced as a new, fully declarative provider.
This fully declarative provider allows users to get, create, and edit Cisco IOS XE features using a single cloud-native provider. There is a rich feature set with examples of how to configure these features directly on GitHub. The resource examples for features show how to create or update a feature, while the data source examples show how to get data from a given configured feature.
Check out the new provider on the Terraform Registry and GitHub:
● Terraform Registry: https://registry.terraform.io/providers/CiscoDevNet/iosxe/latest
● Cisco DevNet GitHub: https://github.com/CiscoDevNet/terraform-provider-iosxe
One example of a use case for Terraform is to configure many gRPC dial-out telemetry subscriptions to one or more given Cisco IOS XE devices.
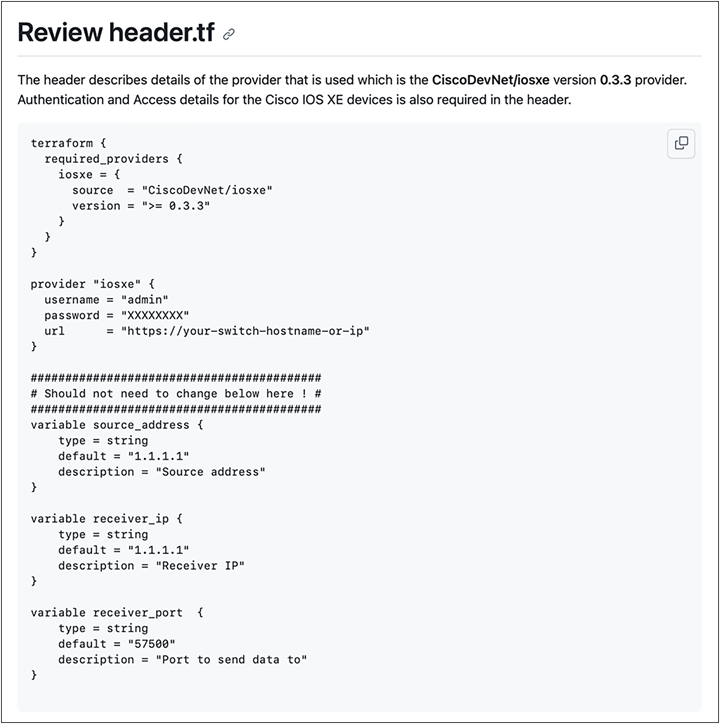
Check out the following resources for additional details on this use case:
● https://registry.terraform.io/providers/CiscoDevNet/iosxe/latest/docs/resourc-es/mdt_subscription
● https://registry.terraform.io/providers/CiscoDevNet/iosxe/latest/docs/data-sources/mdt_subscription
● https://github.com/jeremycohoe/cisco-ios-xe-panda-lab-terraform
Troubleshooting and validation with show commands and MDT OPER YANG
You can check subscriptions regardless of whether they are dial-in or dial-out with show commands and MDT-OPER YANG.
MDT-Oper.YANG model
To view the operational status of MDT subscriptions, the following YANG model can be used:
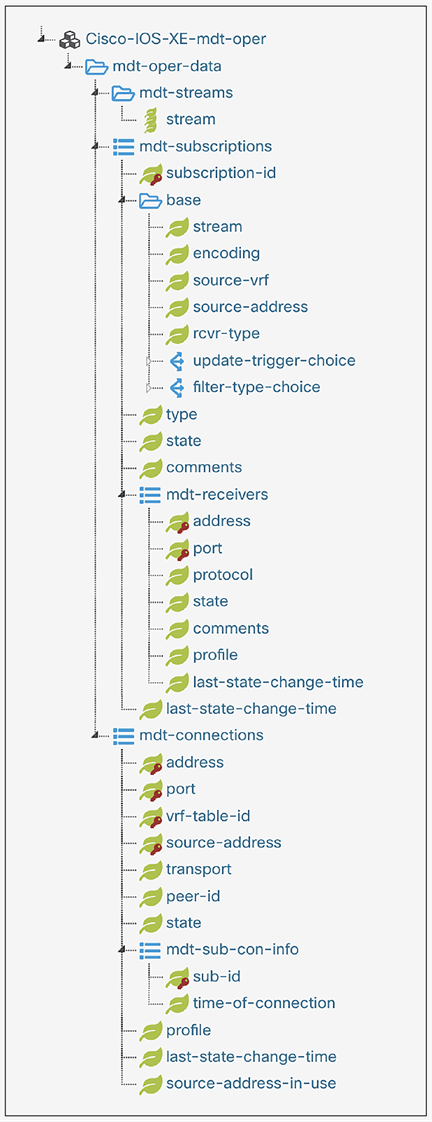
The following show commands can be used to verify and validate telemetry subscriptions configured on a Cisco IOS XE device. See more details here: https://www.cisco.com/c/en/us/td/docs/ios-xml/ios/prog/configuration/1712/b_1712_programmability_cg/m_1712_prog_ietf_telemetry.html
Review the following show commands to better understand a telemetry configuration state:
| show telemetry ietf subscription all show telemetry receiver all show telemetry receiver name receiver1 show telemetry ietf subscription 101 detail show telemetry ietf subscription all detail |
Table 8. Troubleshooting named receiver connections
| Problem |
How to Check/Symptom |
What to Do |
| Subscription is not valid. |
show telemetry ietf subscription id details |
Fix the subscription configuration. |
| Subscription receiver is not valid. |
show telemetry ietf subscription id receiver |
Fix the named receiver configuration. |
| Subscription receiver's connection parameters cannot be resolved. |
show telemetry ietf subscription id receiver Subscription receiver state appears to never leave the resolving state. |
Verify the receiver, the network configuration, or the interface state. |
| Subscription receiver connection does not come up. |
show telemetry ietf subscription id receiver Subscription receiver state constantly changes from resolving to connecting. |
Verify that the resolved connection is valid, and the receiver or collector is reachable and able to accept inbound connections using the specified transport. |
| Subscription receiver connections are rejected. |
show telemetry ietf subscription id receiver Subscription receiver state constantly changes through all states except disconnected. |
Verify that the collector is of the correct type, and that the configured authentication and authorization is valid. |
| Subscription receiver is connected, but no updates are received. |
show telemetry internal subscription id stats Message drop count is incrementing, but the records sent is not. |
Verify that the collector is able to keep up with the flow of update notifications. |
| Subscription receiver is connected, but no updates are received. |
show telemetry internal subscription No change in the count. |
If the subscription is on—change, ensure that there really have been no events. If the subscription is periodic, ensure that the update period is small, that the time is specified in hundredths of a second. |
Another option for debugging is to reference programmatically using the MDT YANG model. See more details about the Cisco-IOS-XE-mdt-capabilites-oper YANG model at the beginning of this document.
Best practices and lessons learned
There are many telemetry subscription use cases. The following are some common wireless Xpaths and periodic intervals. See further examples here.
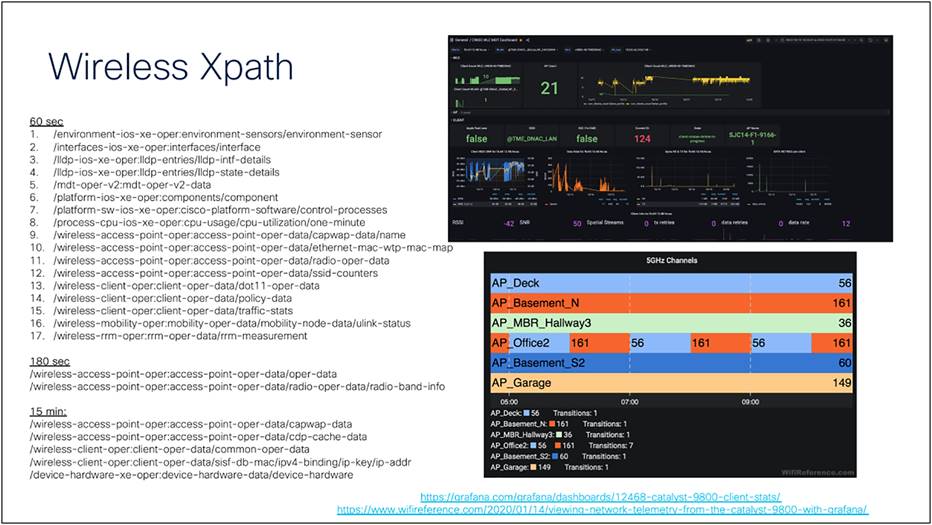
Common wireless Xpaths and periodic intervals
Network application and user monitoring
Telemetry data provides detailed time-based and application-based data on usage of a network. This information assists in the planning and allocation of network and application resources, including extensive near-real-time network monitoring capabilities. It can be used to display traffic patterns and application-based views. Telemetry enables proactive problem detection, efficient troubleshooting, and rapid problem resolution. This information is used to efficiently allocate network resources and to detect and resolve potential security and policy violations.
Telemetry can be used to capture data over a long period of time to track and anticipate network growth and plan upgrades to increase the number of routing devices, ports, or higher-bandwidth interfaces. Telemetry data helps in network planning, which includes peering, backbone upgrade planning, and routing policy planning. It can be used to minimize the total cost of network operations while maximizing network performance, capacity, and reliability. Telemetry data allows the user to identify traffic and validate bandwidth and Quality of Service (QoS), and assists in the analysis of new network applications.
Telemetry data can be used to identify and classify Denial-of-Service (DoS) attacks, malware, and threats in real time. Changes in network behavior indicate anomalies that can be detected using telemetry data. The data is also a valuable forensic tool to understand the history of security incidents.
Telemetry can be used to measure the amount of traffic crossing peering or transit points to determine whether the peering arrangement with service providers is fair and equitable.
Troubleshooting collection
When using gRPC dial-out, if a subscription such as the following is configured but the state shows “Connecting” and not “Connected”:
| telemetry ietf subscription 101 encoding encode-kvgpb filter xpath /process-cpu-ios-xe-oper:cpu-usage/cpu-utilization/five-seconds source-address 10.1.1.5 stream yang-push update-policy periodic 500 receiver ip address 10.1.1.3 57500 protocol grpc-tcp |
the subscription may need to be reconfigured by removing and re-adding the configurations:
| configure terminal no telemetry ietf subscription 101 telemetry ietf subscription 101 encoding encode-kvgpb filter xpath /process-cpu-ios-xe-oper:cpu-usage/cpu-utilization/five-seconds source-address 10.1.1.5 stream yang-push update-policy periodic 500 receiver ip address 10.1.1.3 57500 protocol grpc-tcp |
Note: If the state does not show "Connected," ensure that the Docker container with the Telegraf receiver is running correctly. Follow the steps below to confirm the status of each component.
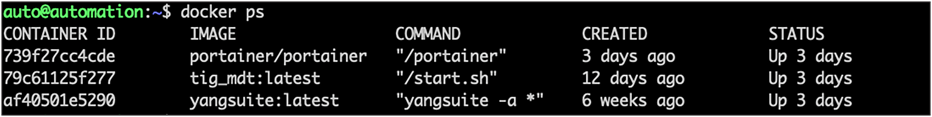
1. On the host with the Docker container, type docker ps to get the container ID:
| docker ps |
It will look like the image below. Make sure to select the container ID for the Docker container hosting the TIG stack. In this case, the container ID is 79c61125f277.
2. Use the container ID to enter into the Docker’s /bin/bash directory:
| docker exec -it CONTAINER_ID /bin/bash |
3. Inside the Docker container, navigate to the Telegraf directory and review the configuration file and log by tailing the log file. In this case the file is stored in the /tmp directory and the file is named telegraf-grpc.log, so the command would be tail -F /tmp/telegraf-grpc.log.
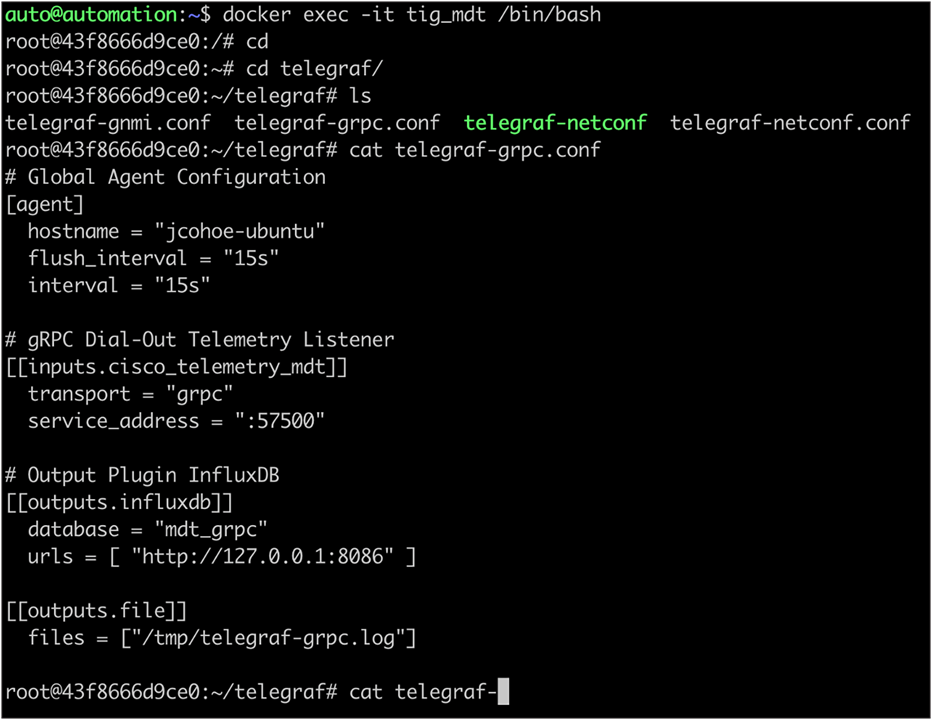
The telegraf-grpc.conf configuration file shows us the following:
● gRPC dial-out telemetry input: This defines the Telegraf plug-in (cisco_telemetry_mdt) that is being used to receive the data, as well as the port (57500).
● Output plug-in: This defines where the received data is sent to (outputs.influxdb), the database to use (mdt_grpc), and the URL for InfluxDB (http://127.0.0.1:8086)
● Outputs.file: This sends a copy of the data to the text file at /tmp/telegraf-grpc.log/telegraf.log.
● These configuration options are defined as per the README file in each of the respective input or output plug-ins. For more details on the cisco_telemetry_mdt plug-in that is in use here, see the page at https://github.com/influxdata/telegraf/tree/master/plugins/inputs/cisco_telemetry_mdt
● Examining the output of the telegraf.log file shows the data coming in from the IOS XE device that matches the subscription we created. Press Ctrl+C to stop the output.
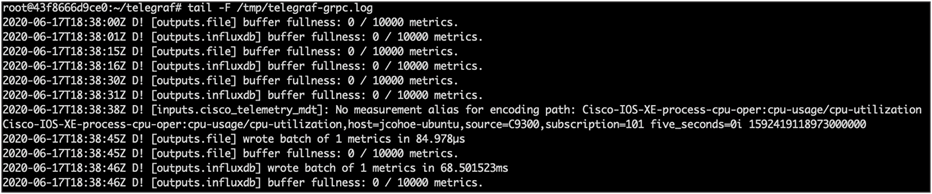
Verify the data stored on the Influx database using the command shown below:
| root@43f8666d9ce0:~# influx Connected to http://localhost:8086 version 1.7.7 InfluxDB shell version: 1.7.7 > show databases name: databases name ---- _internal mdt_gnmi mdt_grpc cisco_mdt mdt_netconf > > drop database cisco_mdt > quit root@43f8666d9ce0:~# root@43f8666d9ce0:~# root@43f8666d9ce0:~# root@43f8666d9ce0:~# root@43f8666d9ce0:~# root@43f8666d9ce0:~# root@43f8666d9ce0:~# influx Connected to http://localhost:8086 version 1.7.7 InfluxDB shell version: 1.7.7 > > show databases name: databases name ---- _internal mdt_gnmi mdt_grpc mdt_netconf > > use mdt_grpc Using database mdt_grpc > show measurements name: measurements name ---- Cisco-IOS-XE-process-cpu-oper:cpu-usage/cpu-utilization > > SELECT COUNT("five_seconds") FROM "Cisco-IOS-XE-process-cpu-oper:cpu-usage/cpu-utilization" name: Cisco-IOS-XE-process-cpu-oper:cpu-usage/cpu-utilization time count ---- ----- 0 1134 > |
The output above shows:
● A Telegraf database as defined in the Telegraf config file that holds that telemetry data
● One measurement defined as the YANG model used for the gRPC dial-out subscription (Cisco-IOS-XE-process-cpu-oper:cpu-usage/cpu-utilization)
● The number of publications received so far (33251).
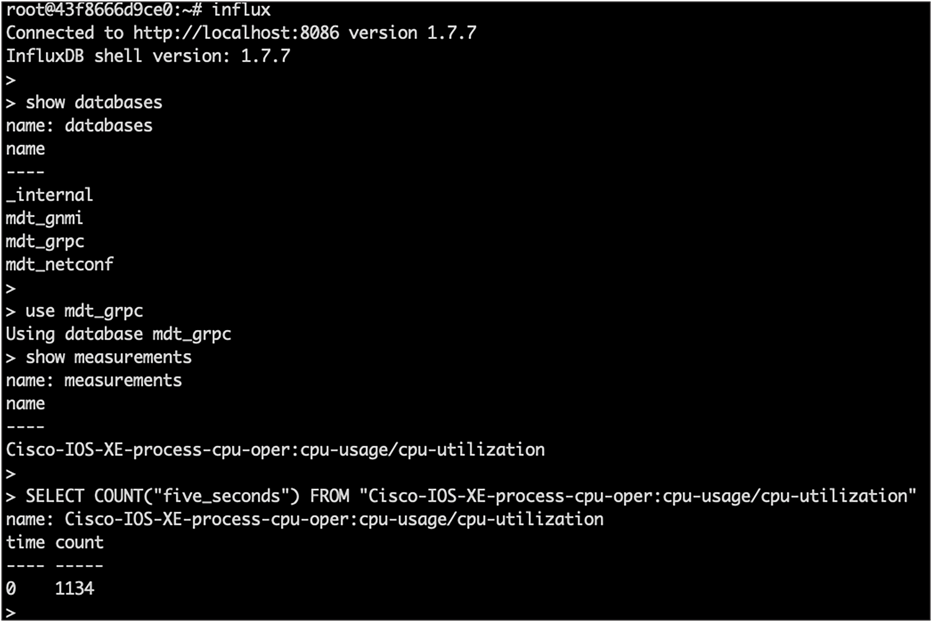
As can be seen through the examples above, we can get telemetry data from Cisco IOS XE devices using NETCONF, gRPC dial-out, and gNMI. To determine the MDT interface to use, we can compare the various network architectures, security postures and policies, tools, and language preferences used for the various interfaces. This data can be collected over time on a periodic or on-change basis. The YANG models, including Cisco native and OpenConfig, to work with the telemetry data are all defined on GitHub.
● Cisco DevNet
◦ Cisco DevNet is a program that helps developers and network engineers write applications and develop integrations with Cisco products, platforms, and APIs. Some recommended resources include:
◦ Network Programmability Basics: Expert-led video series introducing network programmability, https://developer.cisco.com/video/net-prog-basics.
◦ Network Programmability Learning Labs: Guided learning platform for network programmability, https://learninglabs.cisco.com/tracks/iosxe-programmability.
◦ IOS XE Sandbox: "Always-on" sandbox that provides an environment for developers and network engineers to build and test their applications and scripts, https://devnetsandbox.cisco.com/.
◦ Developer Support Spark Chat: https://developer.cisco.com/spark-chat/; Knowledge Base and Community, https://devnetsupport.cisco.com.
◦ Events: In-person events where developers and network engineers can listen, learn, and practice with hands-on training. More information about events can be found at https://devnetevents.cisco.com.
◦ DevNet sandboxes: https://devnetsandbox.cisco.com/DevNet.
◦ Resources for NX/XR MDT WP
◦ Programmability configuration guides: https://www.cisco.com/c/en/us/support/ios-nx-os-software/ios-xe-17/products-installation-and-configuration-guides-list.html.
◦ DevNet MDT: https://cisco.com/go/iosxemdt.
◦ Similar content as above, but GitHub link for programmability and automation MDT: https://github.com/jeremycohoe/cisco-ios-xe-mdt.
● Cisco MDT TIG: https://github.com/muhammad-rafi/cisco-mdt-tig.
● CI/CD sandbox: https://developer.cisco.com/learning/labs/nso-cicd/define-the-cicd-pipeline/.
● Programmability and automation e-book: http://cs.co/programmabilitybook.
● Docker container: https://github.com/jeremycohoe/cisco-ios-xe-mdt.
● Cisco Live!
◦ Attending Cisco Live provides great opportunities to increase one’s personal knowledge of Cisco products. More information about this event can be found at https://www.ciscolive.com.
◦ Recordings of previous Cisco Live sessions can be accessed online from the Cisco Live On-Demand Library at https://www.ciscolive.com/on-demand/on-demand-library.html#/.
◦ Recommended programmability and MDT sessions are:
◦ DEVNET-1693: Model-Driven Telemetry for Cisco IOS XE.
◦ BRKCRS-2004: Application Hosting and Model-Driven Telemetry on Cisco IOS XE.
◦ BRKDEV-2016: Programmability and Automation with Catalyst IOS XE Platforms.
◦ BRKEWN-2730: Everyday Wireless Operational Headaches: Cured Using Programmability!