

39M
Networking devices connected to our platform
Trusted by 99% of the Fortune 500 and over 1 million customers worldwide
Market-defining technologies driving the future of AI

Powering outcomes you need to thrive in the AI era
AI-ready data centers
Modernize and transform your data centers to power traditional and AI workloads anywhere—with speed, scale, and flexibility.
Future-proofed workplaces
Create agile, resilient workplaces that evolve with employee needs and deliver incredible customer experiences everywhere.

Digital resilience
Keep your organization securely up and running in the face of any disruption—from cyberattacks to third-party outages and other technical failures.


Innovation in action: Real results powered by leading technology


The latest from Cisco

Broadcast
Glasswing: Mythos demands a new model for infrastructure

News
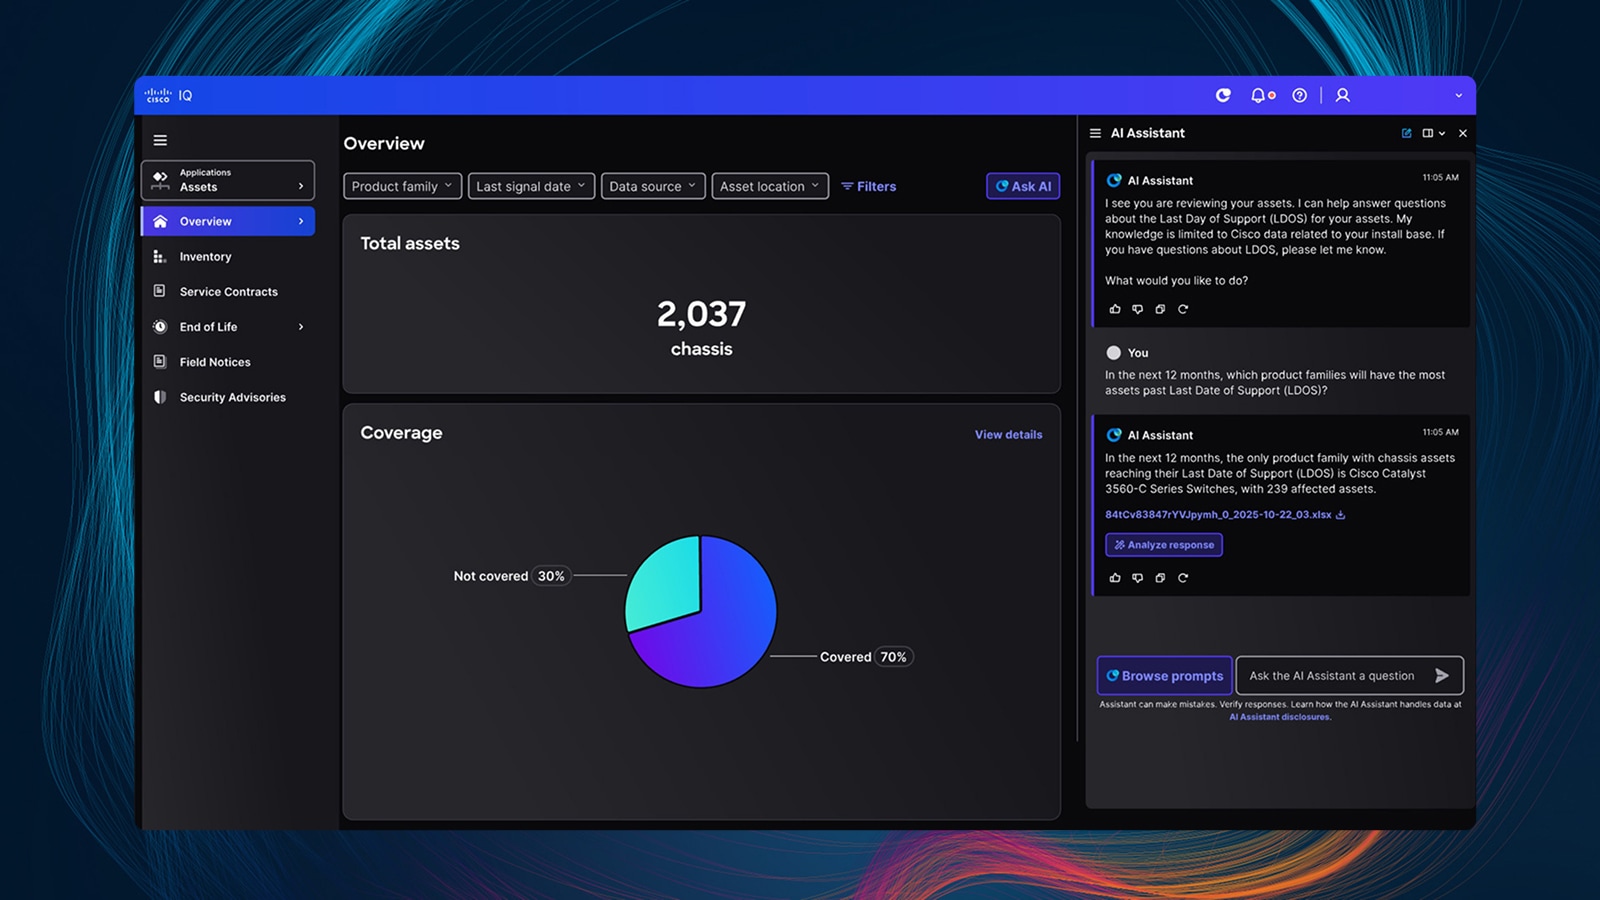
Cisco IQ is now generally available

News
Meet the Cisco Universal Quantum Switch

Report