
Smarter networks. Greater value.
Reduce complexity, drive new revenue, and secure your network with smarter, data-driven solutions.
Simplify networking and operations
Reduce costs by converging network layers to simplify operations and topology, minimize risk, and lower consumption of power, space, and cooling.
Accelerate service delivery
Leverage deep network insight to optimize your infrastructure so you can monetize AI, 5G, and IoT services—and deliver the performance and innovation customers demand.
Deliver secure, resilient experiences
Gain observability and security with data-driven insights, real-time visibility, and end-to-end protection across your owned and unowned networks.

Advanced solutions for service providers
Discover new revenue opportunities and reduce costs with solutions that deliver unmatched simplicity, resilience, and scale for service providers.

Cisco Non-Terrestrial Networking
Connect beyond boundaries by seamlessly integrating terrestrial and satellite networks, creating a comprehensive, intelligent connectivity ecosystem.

Cisco Routed Optical Networking
Converge IP and optical layers for scalable, efficient, and reliable connectivity—while reducing CapEx, energy costs, and operational complexity.

Cisco Routed PON
Eliminate separate OLT chassis and deliver agile, scalable broadband services with greater efficiency and operational simplicity.

Cisco Mobility Services Platform
Accelerate 5G and IoT deployments. Deliver enterprise-ready mobility solutions with immediate revenue potential.
What our customers are saying


Cisco 8000 Series Routers
Deliver scale and performance for metro, core, and data center networks with Silicon One-based platforms built for AI-ready connectivity.

Cisco ASR 9000 Series
Support application performance and power your services with rich edge routing features at scale.

Cisco NCS 5700 Series
Scale with high-density 400G routers for long-term growth and segment routing for SLA-based services.

Cisco NCS 5500 Series
Handle massive traffic growth with 100G and 400G density, streamline operations, and reduce energy use to scale efficiently and sustainably.

Cisco NCS 500 Series
Simplify your access network with secure, compact, and programmable routers that converge services for access use cases.
Crosswork Network Automation
Reduce complexity with an AI-powered automation platform that streamlines operations and enhances service delivery at scale.

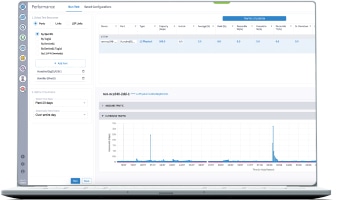
Cisco Crosswork Assurance
Get granular visibility and insights across multivendor, multilayer, and multidomain networks to deliver exceptional digital experiences.

ThousandEyes
Assure every digital experience across home, enterprise, cloud, internet, and SaaS environments.

Splunk
Drive digital resilience with unified observability and use AIOps to detect, monitor, and resolve issues quickly.


Cisco DDoS Edge Protection
Protect your network by using access, aggregation, and peering routers at the edge to block disruptive traffic.
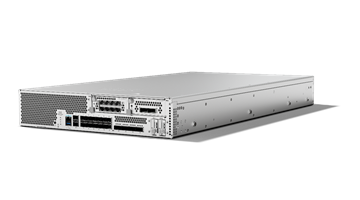
Cisco Secure Firewall 6100 Series
This ultra-high-end series protects AI-ready data centers with exceptional firewall performance density, line-rate advanced threat protection, and modular scalability.
Flexible deployment, optimized growth
Cisco Capital
Get the Cisco technology you need to transform, simplify, and grow with flexible payment options.
Cisco Services
Get the full value of your IT investment faster with Cisco Customer Experience (CX).
Sustainability investments
Transform your network and join Cisco on the journey to a sustainable and inclusive future.