Cisco Unity Troubleshooting Guide, Release 3.1(4)
Introduction

Table Of Contents

Introduction

Troubleshooting Preparation

Setting Up For a Diagnostic Test (Cisco CallManager Integration Only)

Setting Up for a Single-Line Test (Circuit-Switched Phone System Integrations Only)

Reporting Problems to Cisco TAC

System Information

Problem Description

Logs and Traces

Dr. Watson Logs

Event Log Traces

Miu Diagnostics

TSP Traces

Diagnostic Traces for the Exchange 5.5 Directory Monitor

Flags To Enable

Diagnostic Traces for the Active Directory Monitors

Flags To Enable


Introduction


In this chapter you will find basic information that will help you prepare for troubleshooting Cisco Unity. See the following sections:

Troubleshooting Preparation—This section includes instructions for setting up for a diagnostic test.

Reporting Problems to Cisco TAC—This section explains what information you will need to interact with the Cisco Technical Assistance Center (TAC), including instructions for obtaining logs and traces and enabling Miu diagnostics.

Troubleshooting Preparation

Problems with external and internal calls, message notification calls, and message waiting indicators can be caused by the phone system, by Cisco Unity, or by both, and are therefore difficult to diagnose. Several of the procedures for resolving problems use the single-line test, in which the phone lines connected to Cisco Unity are tested one at a time.

Most phone systems provide documentation on the codes that perform transfers, recalls, and other call progress functions. Have the phone system documentation available while performing the procedures in this section.

Setting Up For a Diagnostic Test (Cisco CallManager Integration Only)

To perform diagnostic tests you need three test extensions. Phone 1 is assigned to the Unity Example Subscriber. Phones 2 and 3 are set up only in Cisco CallManager and do not need to have a Cisco Unity subscriber assigned. All three extensions must be in the same calling search space as Cisco Unity.

To set up the test configuration


Step 1 Set up two test extensions (Phone 1 and Phone 2) on the same phone system that Cisco Unity is connected to.

Step 2 Set Phone 1 to forward calls to the Cisco Unity pilot number when calls are not answered.

Step 3 In the Cisco Unity Administrator, go to the Subscribers > Subscribers > Profile page for the Example Subscriber.

Step 4 In the Extension field, enter the extension of Phone 1.

Step 5 Click the Save icon.

Step 6 In the navigation bar, click Call Transfer to go to the Subscribers > Subscribers > Call Transfer page for Example Subscriber.

Step 7 Under Transfer Incoming Calls, click Yes, Ring Subscriber's Extension, and confirm that the extension number is for Phone 1.

Step 8 Under Transfer Type, click Release to Switch.

Step 9 Click the Save icon.

Step 10 Click Messages for Example Subscriber.

Step 11 Under Message Waiting Indicators (MWIs), check Use MWI for Message Notification.

Step 12 In the Extension field, enter x.

Step 13 Click the Save icon.


Setting Up for a Single-Line Test (Circuit-Switched Phone System Integrations Only)

To perform diagnostic tests, you need a lineman test set or an analog phone with a ringer. Additional equipment and the method you use to set up for a single-line test depend on the type of voice cards in the Cisco Unity server.

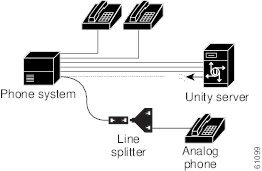
To set up a Dialogic D/120 card for single-line testing

This voice card supports two lines per jack, so you need a line splitter to test individual lines.


Step 1 Determine which line you are having trouble with, and unplug it from the voice card.

.

Step 2 Plug that line into a line splitter.

Step 3 Plug the test phone into the jack on the line splitter corresponding to the port you are having trouble with. The inner pair of wires correspond to the first port, and the outer pair of wires correspond to the second port.


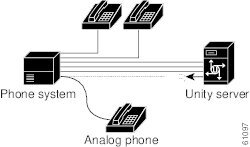
To set up a Dialogic D/41E-series card for single-line testing

This voice card supports only one line per jack.


Step 1 Determine which line you are having trouble with, and unplug it from the voice card.

Step 2 Plug that line into the test phone.


Reporting Problems to Cisco TAC

When you report a problem to the Cisco Technical Assistance Center (TAC), you will be asked to provide information about your system and about the problem. This section provides procedures for gathering the system information and problem description that may be requested.

System Information

Have the following system information ready when you call:

Cisco Unity version currently in use. See one of the following procedures: To determine the Cisco Unity version in use by using the Cisco Unity Administrator, or To determine the Cisco Unity version in use by using the AvCsMgr.exe file.

Cisco Unity-CM TSP version currently in use. See the procedure, To determine the Cisco Unity-CM TSP version in use.


Note In versions earlier than 3.1(1), the Cisco Unity-CM TSP was known as the AV-Cisco TSP.


RealSpeak TTS version currently in use. See the procedure, To determine the RealSpeak ENU language engine in use.

Build number(s) of any software releases or upgrades installed.

Number, type, and speed of processors.

Memory and pagefile size.

Hard disk size and free space.

Number and type of voice ports installed.

Phone system integration, including the manufacturer, model, and version (if applicable).

Cisco Unity switch.ini file version currently in use. See the procedure, To determine the Switch.ini file version in use.

Other telephony software or hardware installed, such as fax, UniModem, or pcAnywhere.

Microsoft Windows 2000 and Exchange service packs installed.

Number of subscribers in the Cisco Unity and Exchange databases.

Size of the Exchange database file.

Approximate normal Cisco Unity server CPU utilization. (For example, does the Windows task manager often show 100 percent CPU utilization, or is it usually less than 80 percent?)

To determine the Cisco Unity version in use by using the Cisco Unity Administrator


Step 1 In the Cisco Unity Administrator, go to the System > Configuration > Software Versions page. The version is displayed in the Cisco Unity Version field.


To determine the Cisco Unity version in use by using the AvCsMgr.exe file


Step 1 Browse to the CommServer directory (the default location is C:\CommServer).

Step 2 Right-click AvCsMgr.exe, and click Properties.

Step 3 In the Properties window, click the Version tab.

Step 4 In the Item Name list, click Product Version. The Cisco Unity version is displayed in the Value window.

Note that Cisco Unity version 3.1(2b) can not be determined by using this procedure. Refer to the CD1.ID file on the Cisco Unity CD 1.


To determine the Cisco Unity-CM TSP version in use


Step 1 Browse to the WinNT\System32 directory.

Step 2 Right-click the Avskinny.tsp file, and select Properties.

Step 3 In the Properties window, click the Version tab.

Step 4 The File Version value is the Cisco Unity-CM TSP version currently in use.


To determine the Switch.ini file version in use


Step 1 Browse to the CommServer directory (the default location is C:\CommServer).

Step 2 Double-click Editswitch.exe.

Step 3 Click Edit this Switch Configuration.

Step 4 The Switch.ini file version is displayed in the title bar of the window.


To determine the RealSpeak ENU language engine in use


Step 1 Browse to the CommServer\RealSpeak\Engine directory.

Step 2 Right-click the file Enu_g2p.dll, and click Properties.

Step 3 Click the Version tab.

Step 4 In the Items list, click Product Version. The DLL version is displayed in the Value window; it corresponds to the following RealSpeak versions:

2.1.0.0 = RealSpeak ENU language engine version 2.0(1)

2.11.0.0 = RealSpeak ENU language engine version 2.1(1)

3.6.0.0 = RealSpeak ENU language engine version 3.0(1)


To determine the RealSpeak base engine version in use


Step 1 Browse to the CommServer\RealSpeak\Api\Lib directory.

Step 2 Right-click the file Lhstts.dll, and click Properties.

Step 3 Click the Version tab.

Step 4 In the Items list, click Product Version. The DLL version is displayed in the Value window; it corresponds to the following RealSpeak versions:

2.1.0.0 = RealSpeak base engine version 2.0(1)

2.11.0.0 = RealSpeak base engine version 2.1(1)

2.12.0.0 = RealSpeak base engine version 3.0(0)

2.13.0.0 = RealSpeak base engine version 3.0(1)


Problem Description

Be prepared to give a complete description of the problem, including:

Symptoms such as lost ports, Event log errors, or Dr. Watson errors.

Problem frequency under normal load conditions (for example, every call, once per hour, or once only).

Problem frequency when specific attempts are made to reproduce it.

Detailed sequence of steps to reproduce the problem.

Date and time of last known occurrence of the problem.

Which digits were entered by the caller (for example, menu selections or subscriber extensions, or the extension of the caller and/or called port), if known.

Which port(s) were affected by the problem, if known.

Applicable logs and traces (see the following "Logs and Traces" section for more information on how to obtain log and trace files).

Logs and Traces

For problems in the Miu or TSP, Cisco TAC may ask for logs and traces before the problem can be diagnosed and fixed. Miu diagnostic logs, along with the Event log and/or Dr. Watson logs, if available, are usually sufficient for the initial phase of diagnosing a problem. TSP traces are typically not required unless Cisco TAC determines that the problem is happening at a level below the Miu.


Caution Diagnostic traces that are set before a Cisco Unity software upgrade are not preserved and must be reset after the upgrade.

Refer to the following sections for details about third-party logs and traces:

Dr. Watson Logs

Event Log Traces

Most Cisco Unity components such as the Miu, Arbiter, Notifier, Conversations, and SA can write diagnostic information to a log file. Diagnostic output of the problem occurring is critical to determining what caused the problem. If the problem seldom occurs, such as only once a day, it can be difficult to find the actual occurrence of the problem in the diagnostic log. See the following sections for details about Cisco Unity diagnostic traces:

Miu Diagnostics

TSP Traces

Dr. Watson Logs

Dr. Watson is a program invoked by Windows 2000 when a serious problem occurs that is not handled by Cisco Unity. When Dr. Watson is invoked, a dialog box appears containing an error message, for example, "Dr. Watson encountering an error in the AvCsMgr.exe process." Dr. Watson errors may occur in other processes such as Tapisrv.exe, or Dlgc_srv.exe.

To obtain a Dr. Watson log


Step 1 When a Dr. Watson error occurs, make a copy of the file Winnt\drwtsn32.log.

Step 2 Before you attempt to reproduce the problem, from a command prompt, enter drwtsn32 and press Enter.

Step 3 Set Number of Instructions to 50.

Step 4 Specify the number of errors to record in the Number of Errors to Save field. The default is 10.

Step 5 In the Dump Symbol Table box, confirm that the Dump All Thread Contexts, Append to Existing Log File, Visual Notification, and Create Crash Dump File check boxes are checked.

Step 6 Click OK to close the dialog box.

Step 7 Reproduce the problem.

Step 8 Make a copy of the file Winnt\drwtsn32.log.


Event Log Traces

The Event log is used by Windows applications to report errors and warnings. The Miu reports serious failures to the Event log, for example, "Component Miu: thread <XXX> had a failure on port <YYY> in AvWav."

To obtain an Event log trace


Step 1 On the Windows Start menu, click Programs > Administrative Tools > Event Viewer.

Step 2 Go to the Application log.

Step 3 Look for failure messages in the Application log. These can include errors from the Miu or AvWav, as well as errors from other Cisco Unity components or Exchange errors.

Step 4 If failure messages are present in the Application log, go to the Event Viewer Action menu.

Step 5 Choose Save as Type CSV (Comma Delimited) *.csv and click Save. Do not save the raw Event log data in a *.evt file.


Miu Diagnostics

Enable the Miu diagnostics when you are obtaining traces for an Miu problem. Enable any other applicable diagnostic traces (see Table 1-1). For example, if there are AvWav errors in the Event log, enable the AvWav diagnostics. However, keep in mind that running additional diagnostics can affect system performance and hard drive space.

To enable Miu diagnostics


Step 1 On the Windows Start menu, click Programs > Unity > Unity Diagnostic Tool.

Step 2 On the Cisco Unity Diagnostic Viewer screen, click the Configure Micro Traces icon.

Step 3 Check the check boxes for selected traces beginning with MIU. See Table 1-1.

Step 4 On the Cisco Unity Diagnostic Viewer screen, click Start New Log Files.

Step 5 Reproduce the problem.

Step 6 To view the log files, click Processes > AvCsMgr, and then click the Current log file.

Step 7 The selected log file is formatted and displayed in the right pane.

Step 8 To export or save a copy of the log file, click Action > Export list.

Step 9 Name the file and save it to a location of your choice in .txt or .csv format.

Step 10 To turn off the traces set in Step 3, on the Cisco Unity Diagnostic Viewer screen, click the Disable All Traces icon.

Step 11 In the Disable All Traces Wizard screen, check the Disable All Traces check box, and click Finish.


Table 1-1 Diagnostic Traces by Problem Type 

Type of Problem
Trace
Purpose

None

FailoverConfig 0, 1, and 10

MiuGeneral 0-4

SystemConfig 10-12

MiuCall 15

UnityDiagnostics 10

Default system traces that provide basic system-wide diagnostic information. These should be enabled at all times.

Miu

MiuGeneral 12

Enables diagnostics for messages that the Miu receives from TAPI.


MiuGeneral 16

Enables diagnostics for the Miu internal synchronization.


MiuIO 11

Enables high-level diagnostics for play and record operations.


MiuMethods 14

Enables diagnostics for the Miu line object.


MiuMethods 18

Enables diagnostics for the Miu interface to TAPI.


MiuIO 14

Enables diagnostics for wave operations at a lower level by tracing each call from the Miu into the AvWav component.

Determining which call had the problem

MiuCall 14

Enables diagnostics for each portion of CallInfo, for example, CallerID and CalledID.

Always enable this diagnostic if the problem takes a long time to reproduce.

MiuGeneral 14

Enables diagnostics for all digits, which can help determine on which call the user entered a particular string of digits.

Always enable this diagnostic if the problem takes a long time to reproduce.

AvWav

MiuIO 15-23

Enables all AvWav traces.

Note that enabling AvWav traces will often use a lot of disk space.

Message notification

MiuMethods 10, 12

Enables diagnostics for the portion of the Miu that is called when new calls are generated.

MWIs

MiuIntegration 12, 14

Enables diagnostics that trace MWI requests.

MiuMethods 10

Enables diagnostics for the portion of the Miu that is called when MWI requests are made.

MiuMethods 20, 22

Enables diagnostics for the integration components of an analog or serial integration.

Notifier 12, 20, 21

Enables additional diagnostics for MWI requests.

Digit related (such as digits missed when entered by callers)

MiuGeneral 14

Enables diagnostics for new digits received from TAPI.

MiuIntegration 10, 11

Enables diagnostics for integration digits for an analog or serial integration.

Extension remapping

MiuCall 15

Enables diagnostics for extension remapping.

MiuGeneral 10

Enables diagnostics for Miu initialization.

MiuIntegration 10

Enables verification of extension number information before it is mapped.

Call routing

MiuIntegration 13

Enables diagnostics indicating if a call did not receive any CallInfo from TAPI or the integration.

MiuCall 14

Enables diagnostics for each piece of CallInfo, such as Caller ID or Forwarding ID.

MiuMethods 20, 22

Enables diagnostics for an analog or serial integration.

MiuIntegrations 10, 11

Enables diagnostics for integration digits for an analog or serial integration.

Miu failed to initialize, or initialized but did not find any ports available

MiuGeneral 10

Enables diagnostics for the Miu initialization sequence.

MiuMethods 10

Enables diagnostics for the portion of the Miu that is called when initialization requests are made.

Reports

ReportCrunch 00, 01, 02, 10, 11, 12
ReportExtractor 00, 01, 02, 10, 11, 12
ReportPostprocess 00, 01, 02, 10, 11, 12
ReportPreprocess 00, 01, 02, 10, 11, 12
ReportPump 00, 01, 02, 10, 11, 12
ReportRunrep 00, 01, 02, 10, 11, 12

Enables diagnostics for reports.


TSP Traces

TSP traces of a problem are normally not needed. However, if Cisco TAC determines that TSP traces are needed, they will ask you to provide them. Do the applicable procedure, depending on the TSP.

To obtain Dialogic analog or Libra TSP traces


Step 1 Exit Cisco Unity, if it is running.

Step 2 Open a command prompt window and browse to the CommServer directory.

Step 3 At the command prompt, enter kill tapisrv and press Enter.

Step 4 Browse to the System32 directory. Copy the TSP(s) and Wave Driver files in this directory to a temporary location for later retrieval.

Step 5 Browse to one of the following directories, based on your system configuration:

CommServer\Dialogic\Debug

For Dialogic analog systems.

LibraTspSetup\Debug

For Libra systems.


Locate the Debug TSP(s) and Wave Driver files for your system. For Dialogic analog systems, the Debug TSP file is D41mt.tsp. For Libra, the Debug TSP files needed are D41mt.tsp, Dlglibra.tsp, and Dlgarb.tsp. The Wave Driver for both Dialogic and Libra systems is Dlgwave.dll.

Step 6 Copy the Debug TSP(s) and Debug Wave Driver files you located in Step 5 to the System32 directory.


Caution The debug version of the Dialogic TSP can have a significant impact on system performance. We recommend that this debug TSP be used only while actively reproducing the problem during a period of light system usage.

Step 7 Go to the Services applet, and set the AvCsGateway process to Manual Startup.

Step 8 Restart the Cisco Unity server.

Step 9 Log on and go to a command prompt window.

Step 10 Browse to the CommServer\Dialogic\Debug directory.

Step 11 Enter dbmon > dbmon.txt to begin tracing the TSP. The output will go to the Dbmon.txt file.

Step 12 Go to the Services applet, and start the AvCsGateway process.

Step 13 Reproduce the problem.

Step 14 After the problem has been reproduced, press Ctrl-C to stop Dbmon.

Step 15 Copy the dbmon.txt. Send the file to Cisco TAC.

Step 16 Replace the debug versions of the TSP(s) and Wave Driver with the original files that you copied into a temporary location in Step 4.

Step 17 Go to the Services applet, and set the AvCsGateway process to Automatic Startup.

Step 18 For the changes to take effect, restart the Cisco Unity server.


To obtain Cisco Unity-CM TSP traces


Step 1 Confirm that the clocks on Cisco Unity and Cisco CallManager are synchronized.

Step 2 Enable tracing on the Cisco CallManager system.

Step 3 On the Windows Start menu, click Programs > Unity > Unity Diagnostic Tool.

Step 4 On the Cisco Unity Diagnostic Viewer screen, click the Configure Micro Traces icon.

Step 5 Check the check boxes for all SkinnyTSP traces except 23 - KeepAlive Messages.

Step 6 On the Cisco Unity Diagnostic Viewer screen, click Start New Log Files.

Step 7 Reproduce the problem.

Step 8 To view the log files, click Processes > AvSkinnyTsp, and then click the Current log file.

Step 9 The selected log file is formatted and displayed in the right pane.

Step 10 To save a copy of the log file, click Action > Export list.

Step 11 Name the file and save it to a location of your choice in .txt or .csv format.

Step 12 To turn off the traces set in Step 5, on the Cisco Unity Diagnostic Viewer screen, click the Disable All Traces icon.

Step 13 In the Disable All Traces Wizard screen, check the Disable All Traces check box, and click Finish.

Step 14 Send a copy of the TSP log files to Cisco TAC, along with the Miu diagnostic log and the Cisco CallManager trace file.


Diagnostic Traces for the Exchange 5.5 Directory Monitor

You use the Unity Diagnostic Tool to set micro traces for the Exchange 5.5 directory monitor. The micro traces to enable are in the DSEx55 group.

Flags To Enable

If the creation, modification, and/or deletion of subscriber accounts, distribution lists, and/or location objects in the Cisco Unity Administrator fails, then enable flags 00 and 10. If the diagnostics show an error when accessing the directory with LDAP, then also enable flag 13 to get more details.

If changes made in the Exchange 5.5 directory are not reflected in Cisco Unity, enable flags 10, 11, and 12. If the error is related to inconsistency in distribution list membership, then also enable flag 17.

If the directory monitor service logs an error to the Windows event log saying that it has thrown an exception, then enable flags 00, 01, and 10.

The table below provides descriptions of the diagnostic flags.

Table 1-2 Diagnostics Flags for the Exchange 5.5 Directory Monitor 

Diagnostic Flag
Description

00—High level, method entry and exit, and parameter values

Traces Cisco Unity Administrator calls to create, modify, delete, and find subscribers, distribution lists, and locations. Also traces calls to get and set system configuration parameters.

01—Low level, method entry and exit, and parameter values

Traces calls to internal methods. Note that enabling this flag will produce very large diagnostic files.

02—Memory

Traces memory allocation and deallocation. There is seldom a need to enable this flag.

10—General

Traces main events and all errors associated with them. This flag should always be enabled when a diagnostic file is needed.

11—Synchronization start and end

Records the time when a synchronization cycle starts and ends.

12—Objects queued for change app

Traces the change or deletion of every object that has been detected and sent to Cisco Unity.

13—LDAP

The Exchange 5.5 monitor uses LDAP to access the Exchange 5.5 directory. When this flag is enabled, all LDAP operations are traced. Note that this produces a very large amount of data.

14—Initialization

Traces all the initialization activity for the directory monitor service.

15—Shutdown

Traces all the shutdown activity for the directory monitor service.

16—Configuration

Traces all configuration activity: reading and writing from the registry, default settings at initialization time, and access to internal configuration at run time.

17—Database access

For performance reasons, the directory monitor keeps some information in a SQL database: the names of all distribution lists and their members, and a list of all Cisco Unity objects and the domain that they are in. Enable this flag when investigating errors in these areas.

18—Import directory connector

The import directory connector (IDC), is used by the Cisco Unity Administrator and the Cisco Unity Import utility to get lists of directory user objects that have not been imported into Cisco Unity. For example, when you choose to import a subscriber from the Cisco Unity Administrator, the list of directory objects it generates comes from the IDC.

The IDC returns properties on the non-imported users, which is how the Cisco Unity Administrator and the Cisco Unity Import utility fill in things like first name, last name, phone number, and so on. If you enable flag 18, you get traces that show the names and values of the retrieved attributes.

Enable this flag for troubleshooting import problems. For example, if the Cisco Unity Administrator is not displaying the first name of a person in the import list, then enable this flag to see if the import directory component is returning the value to the calling application correctly.


Diagnostic Traces for the Active Directory Monitors

You use the Unity Diagnostic Tool to set micro traces for the Active Directory monitor. The diagnostics for the DC monitor are in the DSAD group. The diagnostics for the GC monitor are in the DSGlobalCatalog group. The flags that can be enabled are the same for both monitors.

Flags To Enable

If the creation, modification, and/or deletion of subscriber accounts, distribution lists, and/or location objects in the Cisco Unity Administrator fails, then enable flags 00 and 10. If the diagnostics show an error when accessing Active Directory, then also enable flag 12 to get more details.

If changes made in Active Directory are not reflected in Cisco Unity, then enable flags 10, 11, and 17. If the error is related to inconsistency in distribution list membership, then also enable flag 16.

If the directory monitor service logs an error to the Windows event log saying that it has thrown an exception, then enable flags 00, 01, and 10.

The table below provides descriptions of the diagnostic flags.

Table 1-3 Diagnostic Flags for the Active Directory Monitors 

Diagnostic Flag
Description

00—High level, method entry and exit, and parameter values

Traces Cisco Unity Administrator calls to create, modify, delete, and find subscribers, distribution lists, and locations. Also traces calls to get and set system configuration parameters.

01—Low level, method entry and exit, and parameter values

Traces internal methods calls. Note that enabling this flag will produce very large diagnostic files.

02—Memory

Traces memory allocation and deallocation. There is seldom a need to enable this flag.

10—General

Traces main events and all errors associated with them. This flag should always be enabled when a diagnostic file is needed.

11—Changes queued

Traces the change or deletion of every object that has been detected and sent to Cisco Unity.

12—ADSI operations

The monitor uses ADSI (Active Directory Services Interface) to access Active Directory. When this flag is enabled, all ADSI operations are traced. Note that this produces a very large amount of data.

13—Initialization

Traces all the initialization activity for the directory monitor service.

14—Shutdown

Traces all the shutdown activity for the directory monitor service.

15—Configuration

Traces all configuration activity: reading and writing from the registry, default settings at initialization time, and access to internal configuration at run time.

16—Database access

For performance reasons, the monitor keeps some information in a SQL database: the names of all distribution lists and their members, and a list of all Cisco Unity objects and the domain that they are in. Enable this flag when investigating errors in these areas.

17—Synchronization start and end

Records the time when a synchronization cycle starts and ends, and also the start and end time for the synchronization of each single domain (if enabled in the DSAD group).

18—Import directory connector

The import directory connector (IDC), is used by the Cisco Unity Administrator and the Cisco Unity Import utility to get lists of directory user objects that have not been imported into Cisco Unity. For example, when you choose to import a subscriber from the Cisco Unity Administrator, the list of directory objects it generates comes from the IDC.

The IDC returns properties on the non-imported users, which is how the Cisco Unity Administrator and the Cisco Unity Import utility fill in things like first name, last name, phone number, and so on. If you enable flag 18, you get traces that show the names and values of the retrieved attributes.

Enable this flag for troubleshooting import problems. For example, if the Cisco Unity Administrator is not displaying the first name of a person in the import list, then enable this flag to see if the import directory component is returning the value to the calling application correctly.