-
Troubleshooting Guide for Cisco CallManager, Release 3.3(3)
-
Index
-
Preface
-
Troubleshooting Overview
-
Troubleshooting Tools
-
Installation, Backup, and Restore Issues
-
Cisco CallManager System Issues
-
Directory Issues
-
Device Issues
-
Dial Plans and Routing Issues
-
Cisco CallManager Services Issues
-
Voice Messaging Issues
-
Opening a Case With TAC
-
Case Study: Troubleshooting Intracluster Phone Calls
-
Case Study: Troubleshooting Cisco IP Phone-to-Cisco IOS Gateway Calls
-
Case Study: Troubleshooting Intercluster Phone Calls
-
 Feedback
Table Of Contents
Cisco CallManager Troubleshooting Tools
Cisco CallManager Administration Serviceability Tool
Simple Network Management Protocol Support
Where to Find More Information
Troubleshooting Tools
This chapter addresses the tools and utilities that you use to configure, monitor, and troubleshoot Cisco CallManager 3.3 and provides general guidelines for collecting information to avoid repetitive testing and recollection of identical data.
Note
To access some of the URL sites listed this document, you must be a registered user and you must be logged in.
This chapter contains the following topics:
•
•
Sniffer Traces
Typically, you collect sniffer traces by connecting a laptop or other sniffer-equipped device on a Catalyst port that is configured to span the VLAN or port(s) (CatOS, Cat6K-IOS, XL-IOS) that contains the trouble information. If no free port is available, connect the sniffer-equipped device on a hub that is inserted between the switch and the device.
Tip
Have available the IP/MAC addresses of all equipment that is involved, such as IP phones, gateways, Cisco CallManagers, and so on.
Debugs
The output from debug privileged EXEC commands provides diagnostic information concerning a variety of internetworking events relating to protocol status and network activity in general.
Set up your terminal emulator software (such as HyperTerminal), so it can capture the debug output to a file. In HyperTerminal, click Transfer; then, click Capture Text, and choose the appropriate options.
Before running any IOS voice gateway debugs, make sure that service timestamps debug datetime msec is globally configured on the gateway.
Note
Preferably, collect debugs during non-working hours. If debugs must be collected in a live environment, configure no logging console and logging buffered. To collect the debugs, use show log.
Some debugs can be lengthy, so collect them directly on the console port (default logging console) or on the buffer (logging buffer). Collecting debugs over a Telnet session may have an impact on the device performance, and the result could be incomplete debugs, which requires that you recollect them.
To stop a debug, use the no debug all or undebug all commands. Verify that the debugs have been turned off by using the command show debug.
Cisco CallManager Troubleshooting Tools
Cisco CallManager supports the troubleshooting tools listed in Table 2-1.
Table 2-1 Troubleshooting Tools
Cisco CallManager Administration Serviceability Tool
Monitors real-time behavior of the components in a Cisco CallManager cluster. AST monitors device status, system performance, and device discovery.
See Cisco CallManager Administration Serviceability Tool and refer to the Cisco CallManager Serviceability Administration Guide for detailed information.
Alarms
Provides information about a Cisco CallManager service to a destination that you configure. Also provides definitions of alarms and the recovery procedure.
See Alarms and refer to the Cisco CallManager Serviceability Administration Guide for detailed information.
Trace
Configures, collects, and analyzes information in log files for Cisco CallManager services.
See Traces and refer to the Cisco CallManager Administration Guide and the Cisco CallManager Serviceability Administration Guide for detailed information.
Real-Time Monitoring
Monitors real-time behavior of the components in a Cisco CallManager cluster.
See Real-Time Monitoring and refer to the Cisco CallManager Serviceability Administration Guide for detailed information.
Service Activation
Views activation status of Cisco CallManager services. You can also activate and deactivate services.
See Service Activation and refer to the Cisco CallManager Serviceability Administration Guide for detailed information.
Control Center
Views status and starts and stops Cisco CallManager services for a particular server or all servers in a cluster.
See Alarms and refer to the Cisco CallManager Administration Guide Release and the Cisco CallManager Serviceability Administration Guide for detailed information.
Microsoft Performance Monitor (Perfmon)
Collects and displays system and device statistics for a local or remote Cisco CallManager installation.
See Microsoft Performance Monitor and refer to the Cisco CallManager Serviceability Administration Guide and microsoft.com for detailed information.
Microsoft Event Viewer
Enables you to identify problems at the system level, such as a gateway.
See Microsoft Event Viewer and refer to microsoft.com for detailed information.
Show Command
Displays the contents of the Cisco CallManager configuration database, configuration file, and memory statistics.
See Show Command and refer to the Cisco CallManager Serviceability Administration Guide for detailed information.
Cisco Secure Telnet
Provides transparent firewall access to Cisco CallManagers servers on the customer site.
See Cisco Secure Telnet and refer to the Cisco CallManager Serviceability Administration Guide for detailed information.
Simple Network Management Protocol (SNMP)
Enables administrators to remotely manage network performance, find and solve network problems, and plan for network growth.
See Simple Network Management Protocol Support and refer to the Cisco CallManager Serviceability Administration Guide.
CiscoWorks2000
Manages the remote Cisco CallManager network
See CiscoWorks2000 and refer to the Cisco CallManager Serviceability Administration Guide and the CiscoWorks2000 documentation for detailed information.
Other tools, such as the Dick Tracy utility
The Dick Tracy utility provides additional information that is not available using the Show command.
See Other Tools and refer to http://www-tac/Teams/AVVID/sj/Ttools/ttools.htm for detailed information.
Cisco CallManager Administration Serviceability Tool
The Cisco CallManager Administration Serviceability Tool (AST), a web-based tool available with the Cisco CallManager Serviceability program, monitors real-time behavior of the components in a Cisco CallManager cluster. The AST uses HTTP and TCP to monitor device status, system performance, and device discovery.
Refer to the Cisco CallManager Serviceability Administration Guide for more information on the AST.
Alarms
Alarms, a web-based tool available with the Cisco CallManager Serviceability program, provides two functions:
•
•
Alarms contain information such as explanation and recommended action. Alarm information includes application name, machine name, and cluster name to help you perform troubleshooting for problems that are not on your local Cisco CallManager.
Refer to the Cisco CallManager Serviceability Administration Guide for configuration procedures to view definitions and alarm information.
Traces
The Trace and Alarm tools work together as follows:
•
•
•
•
For IP telephony issues, Cisco CallManager traces prove very important in the troubleshooting process. A TAC engineer may ask you to capture traces to troubleshoot the problem.
This section contains information for the following trace items:
For detailed information, refer to the Cisco CallManager Serviceability Administration Guide and the Cisco CallManager Serviceability System Guide.
Trace Configuration
You can configure the following Cisco CallManager services for Trace Configuration and to specify the parameters that you want to trace.
•
•
•
•
•
•
•
•
•
•
•
Use the Trace Configuration tool to specify the parameters that you want to trace for troubleshooting Cisco CallManager problems. The Trace Configuration window provides two types of settings: trace filter and trace output.
Specify the following trace parameters:
•
•
•
•
•
If the service is a call-processing application such as Cisco CallManager or Cisco CTIManager, you can configure a trace on devices such as phones and gateways; for example, you can narrow the trace to all enabled phones with a directory number beginning with 555.
Note
Trace Collection
Use the Trace Collection tool to collect trace information for any Cisco CallManager service, the time and date of the trace for that service, and the trace type (SDI or SDL) for that service. Trace Collection takes the information that you chose and writes it into a single file. You can display the collected results or download them to a file, which you use to troubleshoot the system.
Use the following procedure to collect Cisco CallManager traces and SDL traces.
Procedure
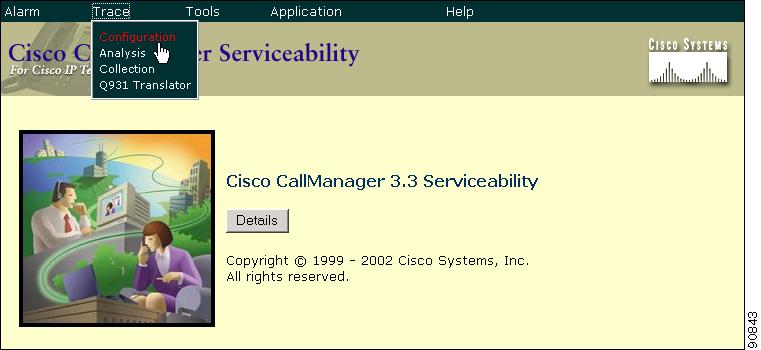
Step 1
The Cisco CallManager Serviceability window displays.
Step 2
Figure 2-1 Cisco CallManager Serviceability Window
Step 3
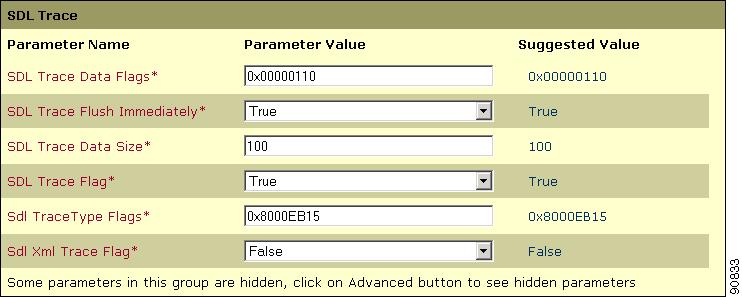
Step 4
Figure 2-2 SDL Trace Type Flags Parameter Value
Step 5
Step 6
Figure 2-3 Trace Filter Settings
Step 7
After configuring trace parameters and running the trace, you can choose trace information to collect for analysis. You can base the collection of information on SDL or SDI trace, type of Cisco CallManager service, and time and date of trace. Trace Collection focuses on traces for a specific period.
For detailed information, refer to the Cisco CallManager Serviceability Administration Guide and the Cisco CallManager Serviceability System Guide.
Trace Analysis
The Trace Analysis tool, a post-processing tool that displays XML files, provides greater trace detail to help narrow system problems.
Cisco CallManager traces are located at
C:\program files\cisco\traces\ccm
SDL traces are located at
C:\program files\cisco\traces\sdl\ccm
Using the Trace Analysis tool, you can specify an SDI or SDL trace, a device name, or an IP address for the following Cisco CallManager services:
•
•
•
The system traces the signal distribution layer of the call and logs state transitions into a log file.
Q931 Translator
Use Q931 Translator to translate ISDN/Q931 messages in the SDI trace files to IOS message format. Q931 Translator supports the following formats:
•
•
You can save the translated trace files to any destination on the network.
Using the message translator tool, Cisco Support Engineers translate your incoming debugging information into familiar Cisco IOS-equivalent messages.
The message translator works by filtering incoming data from Cisco CallManager SDI log files, then parsing and translating them into Cisco IOS-equivalent messages. Message translator supports XML and text files.
Real-Time Monitoring
Cisco CallManager Serviceability provides a web-based tool, Real-Time Monitoring Tool (RTMT), that monitors real-time behavior of the components in a Cisco CallManager cluster. RTMT uses HTTP and TCP to monitor device status, system performance, device discovery, and CTI applications. It also connects directly to devices by using HTTP for troubleshooting system problems.
Performance monitoring provides the following services:
•
•
•
•
•
For detailed information, refer to the Cisco CallManager Serviceability Administration Guide and the Cisco CallManager Serviceability System Guide.
Service Activation
Cisco CallManager Serviceability provides a web-based Service Activation tool that is used to activate or deactivate multiple services and to choose default services to activate.
Activate or deactivate services in the Service Activate web pages by checking the check boxes beside the service names and clicking the Update button.
The Service Activation tool activates services in automatic mode and checks for service dependencies. When you click the Set Default button, the Service Activation tool chooses those services that are required to run Cisco CallManager. For example, if you choose one service, all the other services that depend on that service to run Cisco CallManager, if any, also automatically get chosen.
Caution
Note
For detailed information, refer to the Cisco CallManager Serviceability Administration Guide and the Cisco CallManager Serviceability System Guide.
Control Center
Control Center views status and starts and stops Cisco CallManager services for a particular server or all servers in a cluster. An icon indicates the status of the service. Control Center supports the following Cisco CallManager services:
•
•
•
•
•
•
•
•
•
•
•
•
•
Microsoft Performance Monitor
Microsoft Performance Monitor application monitors and logs resource counters from the Cisco CallManager nodes in the network and displays the system activities and status information in real time.
Tip
Procedure
Step 1
Start > Programs > Administration Tools > Performance.Step 2
Step 3
Step 4
Step 5
Step 6
Step 7
•
•
•
•
•
•
•
•
•
•
•
•
•
•
•
•
•
•
•
•
•
•
•
•
•
•
•
•
•
•
•
•
•
•
•
•
•
•
•
•
•
•
•
•
•
Step 8
Step 9
Step 10
Step 11
Step 12
Step 13
This allows you to load the same data again, if necessary.
Note
Performance Monitor can simultaneously collect data from multiple installed systems and store the information in a single log file. You can export the log file into a Tab Separated Value (TSV) file or a Comma Separated Value (CSV) file. View the TSV file or CSV file in a spreadsheet application.
Note
Cisco CallManager directly updates Microsoft Performance Monitor counters. The call perfmon counters as call-processing-related counters contain simple, useful counts such as number of registered phones, number of active calls, and number of available conference bridge resources.
The following list identifies the Cisco CallManager performance counters:
•
•
•
•
•
•
•
•
•
•
•
Customize Performance Monitor to view the Cisco CallManager-related parameters that you want to monitor by choosing the object, counter, and the instance.
Refer to microsoft.com for more information on Performance Monitor.
Microsoft Event Viewer
Microsoft Event Viewer tool can help you identify problems at the system level, such as events regarding a specific gateway.
Access Event Viewer by choosing
Start > Programs > Administration Tools > Event Viewer.The Event Viewer displays the following types of logs:
•
•
•
The Event Viewer displays the following event types:
•
•
•
Common Cisco CallManager Event Logs are located at the following URL: http://www.cisco.com/en/US/partner/products/sw/voicesw/ps556/products_tech_note09186a0080111ac2.shtml.
Cisco Secure Telnet
Cisco Secure Telnet allows Cisco Service Engineers (CSE) transparent firewall access to the Cisco CallManager node on your site. Using strong encryption, Cisco Secure Telnet enables a special Telnet client from Cisco Systems to connect to a Telnet daemon behind your firewall. This secure connection allows remote monitoring and troubleshooting of your Cisco CallManager nodes, without requiring firewall modifications.
Note
Command Line Tools
Command Line Tools prove useful in troubleshooting. The following list gives the available command line tools:
•
•
•
•
•
Show Command
Use the Show command line tool to display the contents of the system memory statistics and the Windows diagnostic information. You can run the show command from a DOS shell or from a Telnet session if Telnet server software is enabled. You can display the output data on the console or save it as a text file.
Note
Alternatively, you can run show.exe from a Telnet session if Telnet server software is enabled.
The following syntax applies for the show command:
show [-f <filename>] [-c <column width>] [-w <console width>] [-v] [command]
Table 2-2 lists options that the show command supports.
Use the following parameters with the show command:
•
•
•
•
•
•
•
•
Note
•
Note
Example:
show -f output.txt -v -w480 dbshow techshow db t ProcessNodeRefer to the Cisco CallManager Serviceability Administration Guide for more information on the show command.
Simple Network Management Protocol Support
Network management systems (NMS) use SNMP, an industry-standard interface, to exchange management information between network devices. A part of the TCP/IP protocol suite, SNMP enables administrators to remotely manage network performance, find and solve network problems, and plan for network growth.
An SNMP-managed network comprises three key components: managed devices, agents, and network management systems.
•
•
•
–
–
–
For detailed information, refer to the Cisco CallManager Serviceability Administration Guide and the Cisco CallManager Serviceability System Guide.
CiscoWorks2000
CiscoWorks2000 serves as the network management system of choice for all Cisco devices including Cisco CallManager. Because CiscoWorks2000 is not bundled with Cisco CallManager, you must purchase it separately. Use the following tools with CiscoWorks2000 for remote serviceability:
•
•
•
•
Refer to the Cisco CallManager Serviceability Administration Guide and the CiscoWorks2000 documentation for more information on CiscoWorks2000 at the following URL:
http://www.cisco.com/univercd/cc/td/doc/product/rtrmgmt/cw2000/index.htm
Other Tools
Access other available tools, such as the Dick Tracy utility, at the following URL:
http://www-tac/Teams/AVVID/sj/Ttools/ttools.htm
Troubleshooting Tips
The following tips may help you when troubleshooting the Cisco CallManager.
Tip
The release notes provide descriptions and workaround solutions for known problems.
Tip
Each Cisco CallManager log traces files locally. If a phone or gateway is registered to a particular Cisco CallManager, then the call processing gets done on that Cisco CallManager if the call is initiated there. You will need to capture traces on that Cisco CallManager to debug a problem.
A common mistake involves having devices registered on a subscriber server, but capturing traces on the publisher server. These trace files will be near empty (and most definitely will not have the call in them).
Another common problem involves having Device 1 registered to CM1 and Device 2 registered to CM2. If Device 1 calls Device 2, the call trace occurs in CM1 and if Device 2 calls Device 1 the trace occurs in CM2. If you are troubleshooting a two-way calling issue, you need both traces from both Cisco CallManagers to obtain all the information needed to troubleshoot.
Tip
Multiple calls may have been made, so knowing the approximate time of the call helps TAC quickly locate the trouble.
You can obtain phone statistics on a Cisco IP Phone 79xx by pressing the i button twice during an active call.
When you are running a test to reproduce the issue and produce information, know the following data that is crucial to understanding the issue:
•
•
•
Note
If you are reproducing a problem, make sure to choose the file for the timeframe by looking at the modification date and the timestamps in the file. The best way to collect the right trace is to reproduce a problem and then quickly locate the most recent file and copy it from the Cisco CallManager server.
Tip
Files will be overwritten after some time. The only way to know which file is being logged to is to choose View >Refresh on the menu bar and look at the dates and times on the files.
Tip
Use the following procedure to verify that the Cisco CallManager service is active on a server.
Procedure
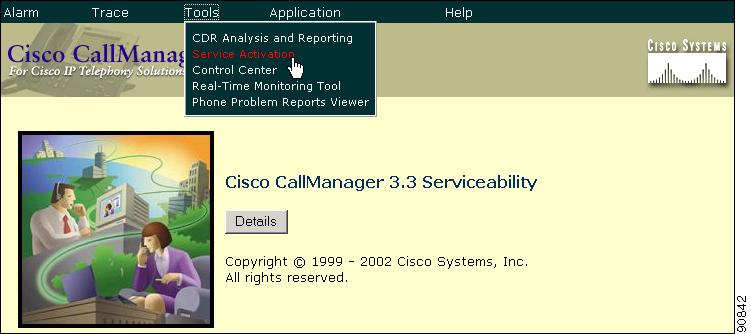
Step 1
The Cisco CallManager Serviceability window displays.
Step 2
Figure 2-4 Cisco CallManager Serviceability Window Tools Menu
Step 3
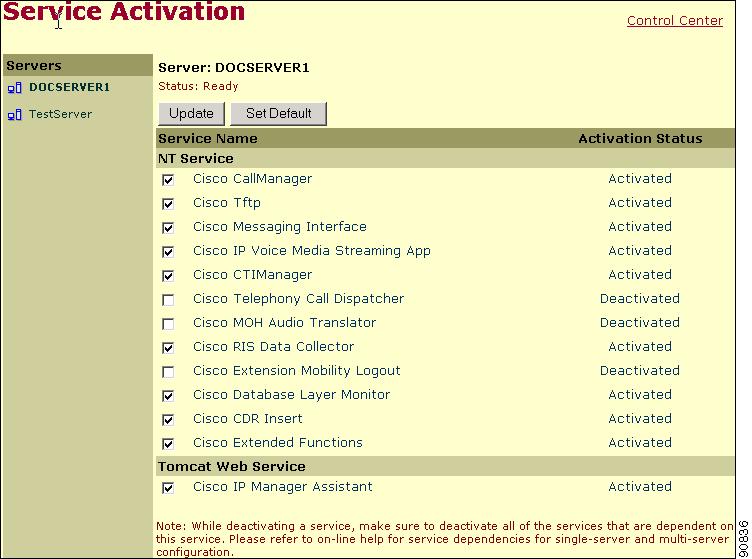
The server that you chose displays next to the Current Server title, and a box with configured services displays.
Activation Status column displays either Activated or Deactivated in the Cisco CallManager line as shown in Figure 2-5.
Figure 2-5 Service Activation Window
If Activated, the Cisco CallManager is active on the chosen server.
If Deactivated, continue with the following steps.
Step 4
Step 5
The Activation Status column displays Activated in the Cisco CallManager line.
Cisco CallManager is now active for the chosen server.
Perform the following procedure if the Cisco CallManager has been in service and you want to verify if it is currently active.
Procedure
Step 1
The Cisco CallManager Serviceability window displays.
Step 2
Step 3
The server that you chose displays next to the Current Server title, and a box with configured services displays.
Activation Status column displays Activated in the CallManager line.
Cisco CallManager is active for the chosen server.
Tip
Use either of the following procedures to start or stop the Internet Information Server (IIS).
Procedure
Step 1
A window displays listing the services.
To Stop Services
Step 2
Step 3
Step 4
To start Services
Step 5
Step 6
Step 7
The IIS starts.
Procedure
Step 1
A window displays listing the services.
To Stop Services
Step 2
Step 3
The IIS stops.
To start Services
Step 4
Step 5
Step 6
The IIS starts.
Procedure
Step 1
A window displays listing IIS Administration Service.
Step 2
The IIS stops.
Step 3
Right-click IIS Admin Service and choose Start.
The IIS starts.
Where to Find More Information
Additional Cisco Documentation
•
•
•
•
•
http://www.cisco.com/univercd/cc/td/doc/product/rtrmgmt/cw2000/index.htm