-
Cisco CallManager Serviceability Administration Guide, Release 4.0(1)
-
Preface
-
Introduction
-
Alarm Configuration
-
Alarm Definitions
-
Alarm Information
-
Trace Configuration
-
Trace Collection Configuration
-
Trace Analysis Configuration
-
Q.931 Translator
-
TroubleShooting Trace Setting Configuration
-
Service Activation
-
Control Center
-
Real-Time Monitoring Configuration
-
QRT Viewer
-
Serviceability Reports Archive Configuration
-
CDR Analysis and Reporting
-
CAR System Configuration
-
CAR Report Configuration
-
CAR User Reports Configuration
-
CAR System Reports Configuration
-
CAR Device Reports Configuration
-
CDR Search Configuration
-
CDR Export CDR/CMR Records Configuration
-
Microsoft Performance
-
Bulk Trace Analysis
-
Overview of CiscoWorks2000
-
Path Analysis Configuration
-
System Log Management Configuration
-
Cisco Discovery Protocol Support
-
Cisco Secure Telnet Configuration
-
Show Command Line Interface
-
Simple Network Management Protocol Configuration
-
Understanding CAR Reports
-
Index
-
 Feedback
Table Of Contents
Trace Collection Configuration
Loading the Trace Collection Tool
Collecting Traces by Using Trace Collection Tool
Trace Collection Configuration
This chapter provides the following procedural information on using the Serviceability Trace Collection Tool:
•
Loading the Trace Collection Tool
•
Cisco CallManager Serviceability provides a web-based trace tool to assist the system administrator and support personnel in troubleshooting Cisco CallManager problems. Trace provides three main functions:
•
•
•
The Trace and Alarm tools work together. You configure trace and alarm settings for Cisco CallManager services. A Cisco TAC engineer receives the results. You can direct alarms to the Microsoft Windows 2000 Event Viewer, CiscoWorks2000 Syslog, system diagnostic interface (SDI) or signal distribution layer (SDL) trace log files, or to all destinations. You can base traces for Cisco CallManager services on debug levels, specific trace fields, and Cisco CallManager devices such as phones or gateways. You can perform a trace on the alarms that are sent to the SDI or SDL trace log files.
Use the Trace Collection tool to collect trace information for any Cisco CallManager service and the time and date of the trace for that service. Trace Collection collects and zips the chosen files.
Note
After configuring trace parameters and running the trace, you can choose trace information to collect for analysis. You can base the collection of information on type of Cisco CallManager service, and time and date of trace. Trace Collection focuses on traces for a specific period.
See the "Loading the Trace Collection Tool" section for information about loading and launching the Trace Collection Tool. See the "Collecting Traces by Using Trace Collection Tool" section for information about how to collect traces by using the Cisco Trace Collection Tool.
Loading the Trace Collection Tool
The following procedure describes how to load the Trace Collection Tool.
Note
Procedure
Step 1
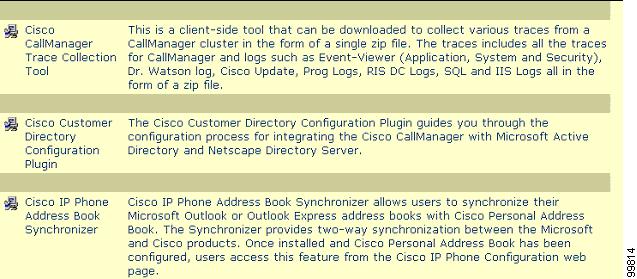
The Install Plugins window displays.
Scroll down and click the Cisco CallManager Trace Collection Tool icon. See Figure 6-1.
Figure 6-1 Install Plugins Trace Collection Tool Icon
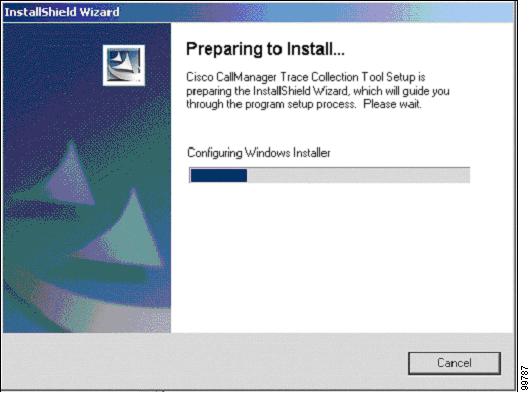
The InstallShield Wizard window displays as shown in Figure 6-2.
Figure 6-2 InstallShield Window
Step 2
Step 3
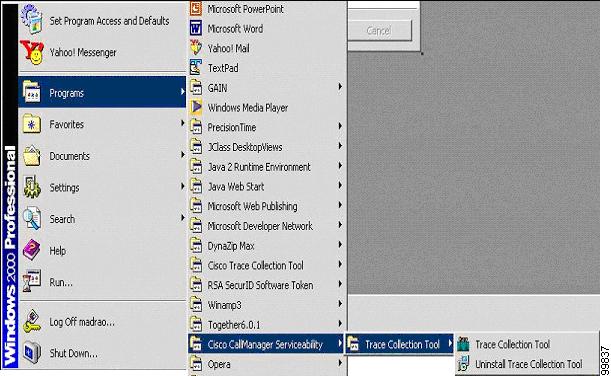
Figure 6-3 Start Menu
Note
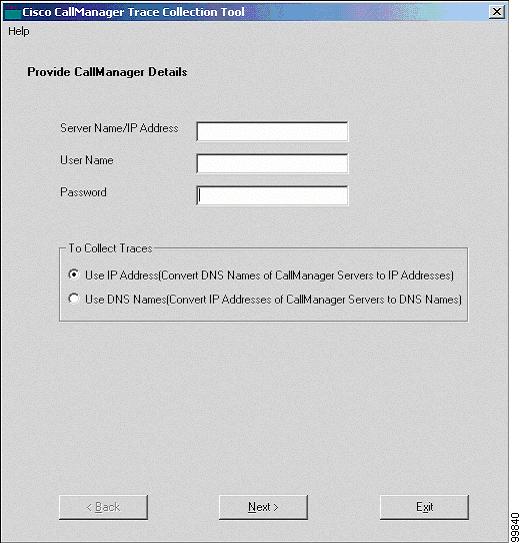
The Cisco CallManager Trace Collection Tool authentication window displays. See Figure 6-4.
Figure 6-4 Cisco CallManager Trace Collection Tool Authentication Window
Related Topic
•
•
Collecting Traces by Using Trace Collection Tool
The following procedure describes how to collect traces using the Trace Collection Tool.
The Trace Collection Tool comprises the following tabs:
•
•
•
The Select CallManager Services tab provides a grid of services for the Cisco CallManager nodes in the cluster. You can choose all or some of the services for which traces must be collected by checking the appropriate check boxes.
Note
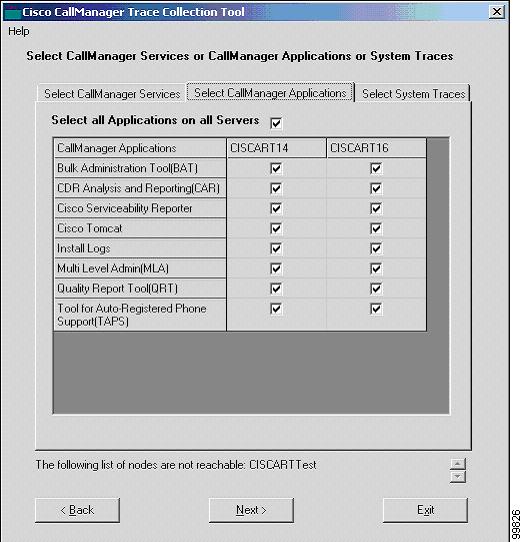
The Select CallManager Applications tab provides the list of Cisco CallManager applications that you can collect. You can choose all or some of the applications in this tab.
The Cisco CallManager nodes that are unavailable display at the bottom of the window. See Figure 6-5.
Figure 6-5 Select CallManager Applications Tab
Note
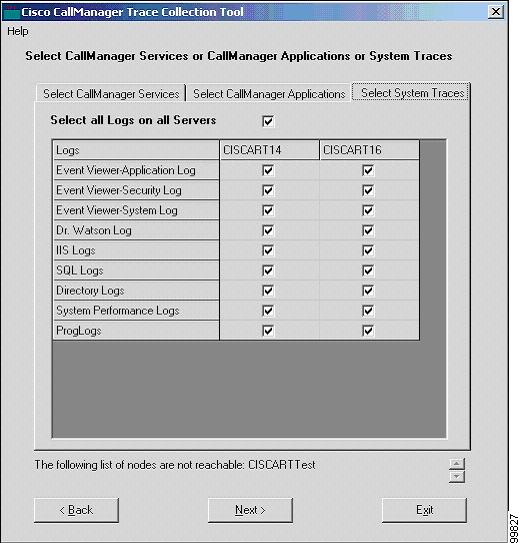
The Select System Traces tab provides the list of system logs that you can collect. You can choose some or all of the logs. The Cisco CallManager nodes that are not available display at the bottom of the window. See Figure 6-6.
Figure 6-6 Select System Traces Tab
Procedure
Step 1
Note
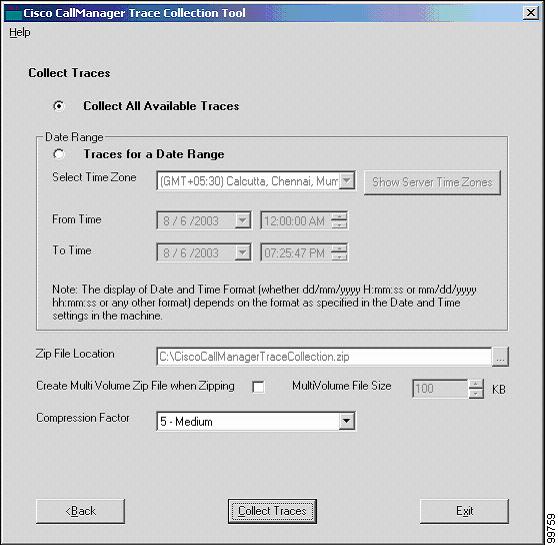
The Trace Collection Tool displays the window shown in Figure 6-7.
Figure 6-7 Collect Traces Window
Step 2
Step 3
Note
Step 4
A popup window displays the details like server name, time zone of each of the servers, and whether Daylight Savings is applicable.
Note
Step 5
Note
You can collect the output zip file as a single zip file, or you can opt for the files to be split into multiple files.
Step 6
Note
Step 7
Note
Step 8
A message displays and states that you are about to collect and zip files of a particular size. If you think that the file size is too high, you can cancel the operation.
Note
Step 9
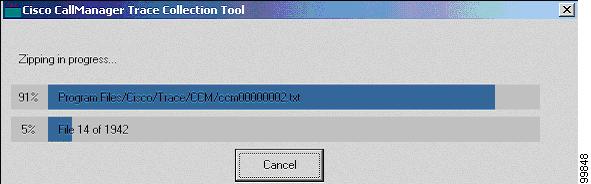
A window displays that shows the progress of the zipping process as shown in Figure 6-8.
Figure 6-8 Zipping Progress Window
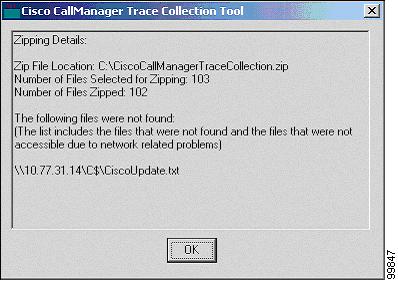
When the zipping process completes, a window displays that provides the zipping details. See Figure 6-9.
Figure 6-9 Zipping Details Window
The list of files not found includes the files that are not found in the given path and/or files that exist on a machine that is not present in the network.
Note
Related Topics
•
•