-
Cisco CallManager Serviceability Administration Guide, Release 4.0(1)
-
Preface
-
Introduction
-
Alarm Configuration
-
Alarm Definitions
-
Alarm Information
-
Trace Configuration
-
Trace Collection Configuration
-
Trace Analysis Configuration
-
Q.931 Translator
-
TroubleShooting Trace Setting Configuration
-
Service Activation
-
Control Center
-
Real-Time Monitoring Configuration
-
QRT Viewer
-
Serviceability Reports Archive Configuration
-
CDR Analysis and Reporting
-
CAR System Configuration
-
CAR Report Configuration
-
CAR User Reports Configuration
-
CAR System Reports Configuration
-
CAR Device Reports Configuration
-
CDR Search Configuration
-
CDR Export CDR/CMR Records Configuration
-
Microsoft Performance
-
Bulk Trace Analysis
-
Overview of CiscoWorks2000
-
Path Analysis Configuration
-
System Log Management Configuration
-
Cisco Discovery Protocol Support
-
Cisco Secure Telnet Configuration
-
Show Command Line Interface
-
Simple Network Management Protocol Configuration
-
Understanding CAR Reports
-
Index
-
 Feedback
Table Of Contents
Specifying Criteria for an SDI Trace Analysis
Specifying Criteria for an SDL Trace Analysis
Trace Analysis Configuration
This chapter provides procedural information on the Cisco CallManager Serviceability Trace Analysis tool.
This chapter contains the following topics:
•
Specifying Criteria for an SDI Trace Analysis
•
Cisco CallManager Serviceability provides a web-based trace tool to assist the system administrator and support personnel in troubleshooting Cisco CallManager problems. Trace provides three main functions:
•
•
•
The Trace and Alarm tools work together. You configure trace and alarm settings for Cisco CallManager services. A Cisco TAC engineer receives the results. You can direct alarms to the Microsoft Windows 2000 Event Viewer, CiscoWorks2000 Syslog, system diagnostic interface (SDI) or signal distribution layer (SDL) trace log files, or to all destinations. You can base traces for Cisco CallManager services on debug levels, specific trace fields, and Cisco CallManager devices such as phones or gateways. You can perform a trace on the alarms that are sent to the SDI or SDL trace log files.
The Trace Analysis tool, a post-processing tool that displays XML files, provides greater trace detail to help narrow system problems. Using the Trace Analysis tool, you can specify an SDI or SDL trace, a device name, or an IP address for a Cisco CallManager service.
Note
Cisco CallManager system administrators and Cisco engineers use Trace Analysis to debug system problems. After the trace is configured and collected, you request a list of SDI or SDL log files. From the list, you can choose a specific log file and request information from that log file such as host address, IP address, trace type, and device name.
An SDL Trace log file contains call-processing information from services such as Cisco CallManager, Cisco CTIManager, and Cisco TFTP. The system traces the signal distribution layer of the call and logs state transitions into a log file.
An SDI Trace log file contains information for all Cisco CallManager services. The system traces system diagnostic interface information from the services and logs run-time events and traces to a log file.
The easy-to-read SDI and SDL log files display in XML format. The format for contents of log files looks like a table with headings, rows, and columns of information. See Figure 7-2.
Specifying Criteria for an SDI Trace Analysis
An SDI trace analysis provides you with specific trace information from an SDI log file. After you choose the SDI log file from which you would like detailed information, you choose the search criteria and the fields that you want displayed.
Narrow the SDI Trace Analysis by choosing the search criteria and the display fields.
Search Criteria
The following list provides search criteria:
•
•
•
•
Display Fields
You can choose the following fields to display:
•
•
•
•
•
•
•
•
•
This section describes how to obtain the trace results from an SDI Trace file.
Procedure
Caution
Step 1
The Cisco CallManager Serviceability window appears.
Step 2
Step 3
Step 4
Step 5
Step 6
Step 7
Step 8
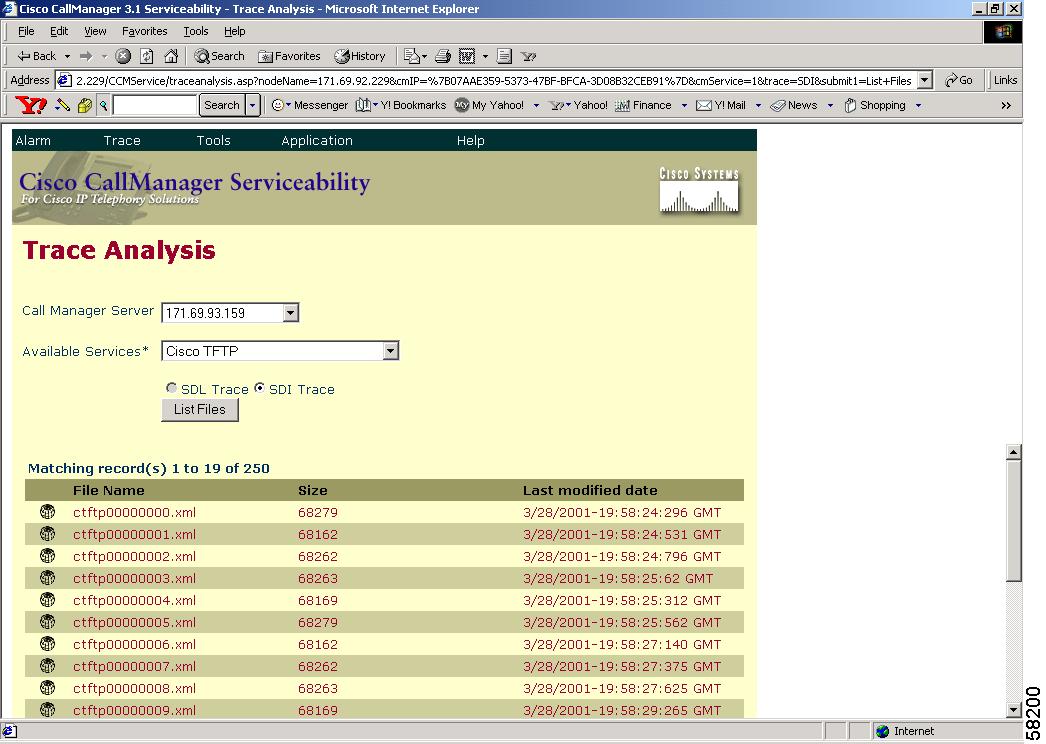
A window displays with a list of all files for the server and services that you chose. The filename, size, and last modified date of each file displays. See Figure 7-1.
Note
Step 9
The SDI Trace Analysis window displays. Use this window to choose specific trace information to view and analyze.
Note
Step 10
Step 11
Step 12
Step 13
Step 14
Step 15
Step 16
Step 17
Step 18
Step 19
The trace analysis search results display.
Related Topics
•
Specifying Criteria for an SDL Trace Analysis
An SDL trace analysis provides you with specific trace information from an SDL log file. After you choose the SDL log file from which you would like detailed information, you choose the search criteria and the fields that you want displayed.
Narrow the SDL Trace Analysis by choosing the search criteria and the display fields.
Search Criteria
The following list provides the search criteria:
•
•
•
•
Display Fields
You can choose the following fields to display:
•
•
•
•
•
•
•
•
•
•
•
•
•
This section describes how to obtain the trace results from an SDL Trace file.
Procedure
Caution
Step 1
The Cisco CallManager Serviceability window appears.
Step 2
Step 3
Step 4
Step 5
Step 6
Step 7
Step 8
A window displays with a list of all files for the server and services that you chose. The filename, size, and last modified date of each file displays. See Figure 7-1.
Figure 7-1 Trace Analysis Results
Note
Step 9
The SDL Trace Analysis window displays. Use this window to choose specific trace information to view and analyze.
Note
Step 10
Step 11
Step 12
Step 13
Step 14
Step 15
Step 16
Step 17
Step 18
Step 19
Step 20
Step 21
The trace analysis search results display. See Figure 7-2.
Figure 7-2 Trace Records in XML Format
Related Topics
•