-
Cisco CallManager Serviceability Administration Guide, Release 3.1(1)
-
Index
-
Preface
-
Overview
-
Alarms
-
Trace
-
Control Center
-
Admin Serviceability Tool
-
Cisco Secure Telnet
-
The Show Command Line Interface
-
Monitor Performance Counters
-
Message Translator
-
Manage With CiscoWorks2000
-
The Path Analysis Interface
-
System Log Management
-
SNMP Instrumentation
-
Cisco Discovery Protocol Support
-
Cisco CallManager Perfmon Counters, AST, and CCM_SNMP_MIB
-
 Feedback
Table Of Contents
Monitor Cisco CallManager System Performance
Use Performance with Cisco CallManager
Generate Performance Statistics
Report Cisco CallManager Performance Statistics
Monitor Performance Counters
This chapter provides general and procedural information for using the Microsoft Performance application with Cisco CallManager.
This chapter contains the following topics:
•
Monitor Cisco CallManager System Performance
•
Related Topics
•
•
Overview
Cisco CallManager supports three real-time information monitoring applications:
•
•
•
The following sections provide a brief description of the applications and how Cisco CallManager uses them.
Microsoft Performance
Cisco CallManager directly updates Microsoft Performance counters (called perfmon counters), which are call-processing-related counters. The counters contain simple, useful counts such as number of registered phones, number of active calls, and number of available conference bridge resources.
The following list identifies the 11 Cisco CallManager perfmon objects (objects contain the counters) (see Figure 8-1):
•
•
•
•
•
•
•
•
•
•
•
The Cisco CallManager object contains most of the perfmon counters, and these counters have only one instance. The instance-based counters belonging to the other objects can have zero or more instances. For example, if there are two phones registered to Cisco CallManager, two instances of each counter belonging to the Cisco Phones object exist.
The counters within each object contain descriptions. See Use Performance with Cisco CallManager. The Microsoft Performance counter descriptions match the Admin Serviceability Tool counter descriptions.
Admin Serviceability Tool
The Cisco CallManager Admin Serviceability Tool provides monitoring of Cisco CallManager performance objects and devices. The device information includes device registration status, IP address, description, and model type. AST provides cluster-wide information stored in six tables. The tables include phone, gateway devices, media, H323 devices, CTI, and voice mail.
AST also displays perfmon counter information kept by each Cisco CallManager node in the cluster. AST perfmon counters directly monitor the perfmon counters (the same as Microsoft Performance).
The counters within each object contain descriptions. See Use Performance with Cisco CallManager. The Microsoft Performance counter descriptions match the AST counter descriptions.
For more information about the Admin Serviceability Tool, see "Admin Serviceability Tool."
SNMP MIBs
The Cisco CallManager SNMP extension agent resides in each Cisco CallManager node and exposes the CCM_SNMP_MIB that provides detailed information about devices known to the node. The CCM_SNMP_MIB provides device information such as device registration status, IP address, description, and model type for the node (not the cluster).
The following list identifies the CCM_SNMP_MIB device tables:
•
•
•
•
•
•
•
•
CCM_SNMP_MIB supports four counters as follows:
•
•
•
•
For more information about SNMP, see Chapter 13, "SNMP Instrumentation."
Counter Similarities
The perfmon counters for phones and gateways have related or overlapping information that is also used by AST device monitoring and CCM_SNMP_MIB. See Appendix A, "Cisco CallManager Perfmon Counters, AST, and CCM_SNMP_MIB" for related information.
Phone Counters
CCM_SNMP_MIB defines four counters (see SNMP MIBs); one counter matches the perfmon counter: ccmActivePhones matches RegisteredHardwarePhones.
If AST searches for all registered phones for a particular node, the number of matching phones found will be the same as the perfmon RegisteredHardwarePhones and CCM_SNMP_MIB ccmActive Phones counters.
Gateway Counters
The CCM_SNMP_MIB counter and ccmActiveGateway are related to the RegisteredAnalogAccess and RegisteredMGCPGateway perfmon counters, but are not the same; for example, the VG200 with two FXS ports and one T1 port. Because each port individually registers and communicates with Cisco CallManager, Cisco CallManager treats each port as a separate device and generates device alarms for each separately. Cisco CallManager considers the VG200 to be a single gateway and, at the same time, three separate devices (2 FXS ports and 1 T1 port).
Device alarm provides the basis for CCM_SNMP_MIB, and basis counting for that. The ccmActiveGateway counts the number of registered devices; RegisteredMGCPGateway perfmon counter counts number of registered gateways. Cisco CallManager considers a gateway registered if any of its subdevices is registered to Cisco CallManager. In the previous example, Cisco CallManager considers the VG200 with two FXS port and one T1 port registered when only the T1 port is registered to Cisco CallManager, and the count remains one. When the two FXS ports are also registered, the count remains one because all the interface/ports are on the same VG200 gateway.
Monitor Cisco CallManager System Performance
Use Windows 2000 Performance to collect and display system and device statistics for any local or remote Cisco CallManager installation. This administrative tool allows you to gain a full understanding of a system without studying the operation of each of its components.It reports both general and specific information in real time.
After adding the Cisco CallManager parameters, you can define the terms under which Cisco CallManager will display statistics generated by the system.
For more information about Performance, refer to the Microsoft Windows 2000 documentation.
The Admin Serviceability Tool provides the same functionality as Microsoft Performance. See "Admin Serviceability Tool."
Performance Data Structure
Cisco CallManager uses the Performance framework to display performance monitoring statistics. Performance categorizes collections of data as object-oriented code, and the Cisco CallManager installation process expands this collection by adding a set of object counters that describe Cisco CallManager functions. See Figure 8-1.
The Performance interface makes the Cisco CallManager counters available for display. The Windows 2000 documentation gives additional information on objects and counters available from the operating system or from other applications.
Figure 8-1 Cisco Call Manager Object Counters
Use Performance with Cisco CallManager
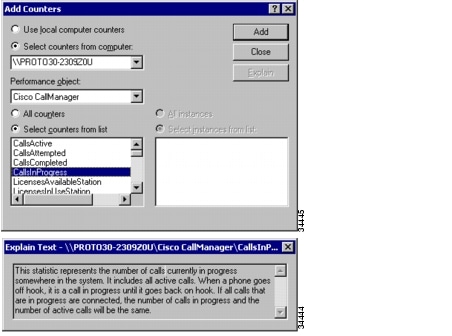
You can use Performance to monitor various conditions on a Cisco CallManager system. For example, you can find the number of calls in progress on a particular Cisco CallManager node at any time or the number of calls attempted on a Cisco CallManager system.
Setting up Performance can yield statistics that are customized to reflect your Cisco CallManager system. For example, you may use the information Performance returns to manage traffic on the system by monitoring the number of calls in progress at any particular time. (See Figure 8-3.)
Perform the following procedures to start the Performance tool and add Cisco CallManager object counters.
Step 1
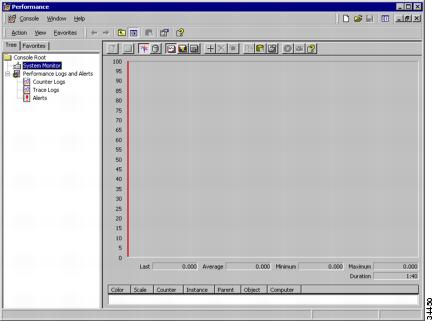
The Performance window displays (Figure 8-2).
Figure 8-2 Windows 2000 Performance Monitoring Tool
Step 2
Figure 8-3 Set Up Performance Monitoring
Step 3
Step 4
Step 5
Step 6
Generate Performance Statistics
The statistical data that is retrieved through Performance provides the information you need for analysis and interpretation of any local or remote Cisco CallManager system. You may choose specific counters to return data describing changing activity levels in your system, or you may choose to react as events occur.
Performance visually formats the statistical data to facilitate your quick comprehension of the state of the system. Using the visual formats provided, you can display Cisco CallManager data in graphical, histogram, or report form. See Report Cisco CallManager Performance Statistics.
Report Cisco CallManager Performance Statistics
Perform the following procedure to report Cisco CallManager performance statistics.
Step 1
The Performance graphical interface (Figure 8-2) displays.
Step 2
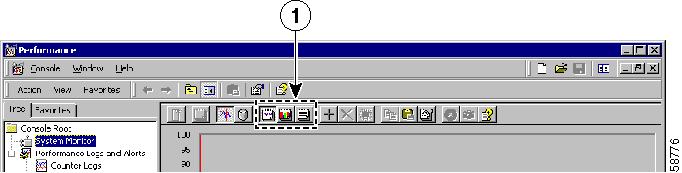
Step 3
Figure 8-4 View Report Icons
Extend Your Data Display
Each report form offers a different visual rendition of the statistical data. You can repeat the process to choose the most effective display.
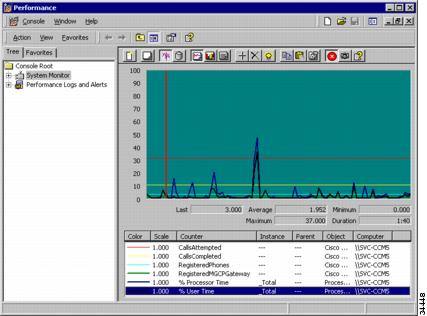
You can add counters from other objects to see how dynamic data affects your Cisco CallManager data. For purposes of illustration, Figure 8-5 shows active operating system conditions with inactive Cisco CallManager data. When your Cisco CallManager data is added, you can interpret that information in the context of any number of system counters.
By combining standard counters with the Cisco CallManager criteria, you get a clear picture of your systems, so that you can manage them more efficiently.
Figure 8-5 Line Graph of Static Call Data