-
Cisco CallManager Serviceability Administration Guide, Release 3.1(1)
-
Index
-
Preface
-
Overview
-
Alarms
-
Trace
-
Control Center
-
Admin Serviceability Tool
-
Cisco Secure Telnet
-
The Show Command Line Interface
-
Monitor Performance Counters
-
Message Translator
-
Manage With CiscoWorks2000
-
The Path Analysis Interface
-
System Log Management
-
SNMP Instrumentation
-
Cisco Discovery Protocol Support
-
Cisco CallManager Perfmon Counters, AST, and CCM_SNMP_MIB
-
 Feedback
Table Of Contents
Alarms
This chapter provides general and procedural information on Serviceability Alarms.
This chapter contains the following topics:
Alarms Overview
Cisco CallManager Serviceability Alarms provides a web-based interface that has two main functions: configure alarms and events and provide alarm message definitions. Both functions assist the system administrator and support personnel in troubleshooting Cisco CallManager problems.
You use Alarms to provide runtime status and state of the system and to take corrective action for problem resolution; for example, to determine if phones are registered and working. Alarms contain information such as explanation and recommended action. Alarm information includes application name, machine name, and cluster name to help you perform troubleshooting for problems that are not on your local Cisco CallManager.
You configure the Alarm interface to send alarm information to multiple destinations, and each destination can have its own alarm event level (from debug to emergency).
You can forward alarms to a Serviceability Trace file. An administrator configures Alarms and Trace parameters and provides the information to a Cisco TAC engineer. You can direct Alarms to the Win2000 Event Log, Syslog, an SDI trace log file, an SDL trace log file (for Cisco CallManager and CTIManager only), or to all destinations. Use Trace to collect and analyze the alarms.
When a service issues an alarm, the alarm interface sends the alarm to the selected monitors (for example, SDI trace). The monitor forwards the alarm or writes it to its final destination (such as a log file).
Note
To log alarms in the SDI trace log file, check two check boxes in Trace configuration and one check box in Alarm configuration: the Trace on check box in Trace configuration, the Enable trace file log check box in Trace configuration, and the SDI alarm destination check box in Alarm configuration.
Alarm definitions describe alarm messages: what they mean and how to recover from them.
You search the Alarm definitions database for alarm information. When you click on any service-specific alarm, a popup window displays with a description of the alarm information and a recommended action.
The following sections provide procedures for alarm configuration and alarm definition searches.
Alarm Configuration
You configure alarm information that will be used for Trace and troubleshooting. You can configure alarms for Cisco CallManager servers that are in a cluster and services for each server, such as Cisco CallManager, Cisco TFTP, and Cisco CTIManager (see Configuration Procedure).
Alarm Monitors
The alarm interface supports up to four alarm destinations, or monitors. The following monitors receive alarms:
•
•
•
•
See Table 2-1 for a description of the alarm monitors.
Alarm Filters
Filtering of alarm information occurs based on the alarm event level that was configured for an individual service and the monitor destination. Filtering accomplishes two tasks: helps the administrator narrow the types of alarms that Cisco CallManager collects and prevents the event log, Syslog, and trace files from becoming overloaded. See Table 2-2 for a description of alarm levels.
Configuration Procedure
Perform this procedure to configure an alarm for any service.
Step 1
The Cisco CallManager Serviceability window displays.
Step 2
Step 3
The server you chose displays, and a box with available services for alarms displays.
Step 4
The service you chose displays after the Current Service title, along with the current server you chose. A list of alarm monitors with the event levels displays in the Alarm Configuration window.
Note
Step 5
Step 6
A list with eight event levels displays.
Step 7
Step 8
Note
View Alarm Information
You view alarm information to determine whether there are Cisco CallManager problems. View alarm information that is sent to the Event Log using the Event Viewer program. You can view alarm information sent to the SDI or SDL trace log file in text or XML format. Use Trace to view the SDI or SDL log files in XML format or use a text editor to view the SDI or SDL log files in text format. (Trace supports text format as well.) Use CiscoWorks2000 report viewer to view Syslog messages.
Microsoft Windows 2000 documentation provides detailed information about Event Viewer and Microsoft text editors.
Perform the following procedure to view alarm information sent to the Win2000 Event Log.
Step 1
The Event Viewer window displays.
Step 2
The application log containing Cisco CallManager alarms displays.
Step 3
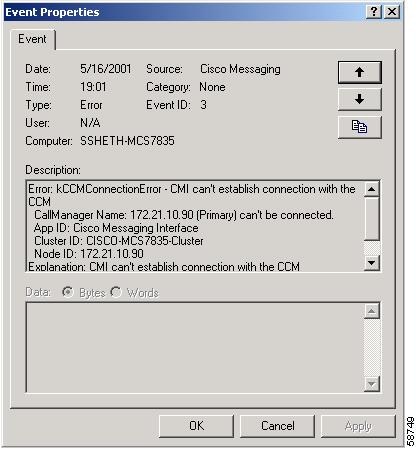
The Event Properties window displays (see Alarm Definition Example).
Step 4
Alarm Definitions
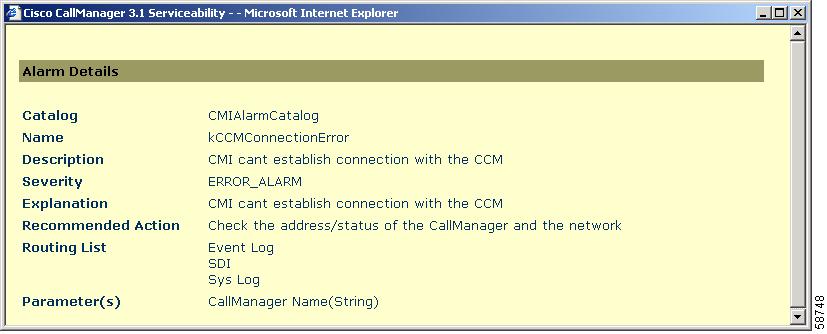
Cisco CallManager stores alarm definitions and recommended actions in a standard query language (SQL) server database. The system administrator can search the database for definitions of all the alarms. The definitions include the alarm name, description, explanation, recommended action, severity, parameters, and monitors. This information aids the administrator when troubleshooting problems that Cisco CallManager encounters.
Perform this procedure to search and view definitions.
Step 1
The Cisco CallManager Serviceability window displays.
Step 2
Step 3
Step 4
The definitions list for the alarm catalog you chose displays.
Step 5
Note
The Alarm Details popup window displays.
Step 6
Step 7
Alarm Definition Example
Figure 2-1 illustrates an alarm sent to the Windows 2000 Event Viewer and how that information correlates to Alarm Definitions (Figure 2-2).
Figure 2-1 Event Properties Window
Figure 2-2 Alarm Definitions Window