- Preface
- Chapter 1: Introduction to Cisco CDA Visual Quality Experience
- Chapter 2: Getting Started with the VQE Startup Configuration Utility
- Chapter 3: Using the VQE Channel Provisioning Tool
- Chapter 4: Using the VQE-S Application Monitoring Tool
- Chapter 5: Using the VCDS Application Monitoring Tool
- Chapter 6: Troubleshooting VQE Software Components
- Chapter 7: Configuring VQE Server and VQE Tools
- Appendix A: VQE, System, and Network Parameters
- Appendix B: SNMP MIBs
- Appendix C: VQE System Messages
- Appendix D: Manual Initial System Configuration
- Appendix E: Configuring DHCP and DNS Servers for VCDS
- Appendix F: Using the vcds_send_file Utility
- Appendix G: Changing the Boot Sequence to Start from the CD/DVD
- Appendix H: VQE Server Performance and Scaling Limits
- Appendix I: VCPT Configuration Files
Using the VCDS AMT
This chapter describes how to use Cisco VQE Client Configuration Delivery Server (VCDS) Application Monitoring Tool (AMT). The VCDS is a software component installed on each VQE Tools server, the Cisco CDE110 that also hosts VCPT. The VCDS AMT is a web browser-based tool for displaying configuration, status, and statistics on the VCDS process and the VQE Tools server. The tasks that you can perform with the VCDS AMT are listed in Table 5-1.
|
|
|
|---|---|
Log in to VCDS AMT |
|
Monitor the health of the VCDS process and VQE Tools Server |
Monitoring the Health of the VCDS Process and VQE Tools Server |
View configuration details and statistics for the VCDS |
|
Change VCDS logging levels |
|
Change VCDS debugging levels |

Note ![]() VCDS AMT supports configuration capabilities for logging levels and debugging options. However, the configured values do not persist when VCDS is restarted.
VCDS AMT supports configuration capabilities for logging levels and debugging options. However, the configured values do not persist when VCDS is restarted.
Logging into and Navigating in VCDS AMT
Before logging into VCDS AMT, you need a valid Linux username and password on the Cisco CDE110 hosting the VCDS AMT. The username does not have to belong to any special group. Creation of the username is the responsibility of the Cisco CDE110 system administrator.
The VCDS AMT supports two web browsers: Microsoft Internet Explorer version 6.0 or later, and Mozilla Firefox version 2.0 or later. The minimum screen resolution required for the VCDS AMT is 1024 x 768 pixels.
The VCDS AMT uses secure HTTPS. Access by multiple simultaneous browsers is supported.
To login to VCDS AMT, follow these steps:
Step 1 ![]() Point your web browser to the Cisco CDE110 that hosts VCDS AMT using an IP address or fully qualified domain name:
Point your web browser to the Cisco CDE110 that hosts VCDS AMT using an IP address or fully qualified domain name:
https://ip_address/vcds-amt
or
https://fully_qualified_domain_name/vcds-amt
The VCDS AMT login dialog box is displayed.
Step 2 ![]() Enter a Linux username and password.
Enter a Linux username and password.
Step 3 ![]() Click OK.
Click OK.
If the username and password are valid, the VCDS AMT Status window is displayed.
Figure 5-1 shows the VCDS AMT navigation controls and buttons.
Figure 5-1 VCDS AMT Navigation
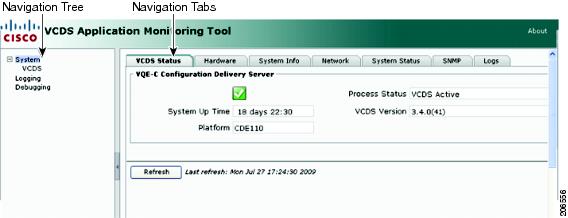
VCDS AMT (Figure 5-1) provides these controls and buttons for navigating and displaying VCDS data:
•![]() Navigation tree—Use the collapsible and expandable tree to display the VCDS AMT items that can be viewed or configured. The navigation tree can be hidden by clicking the < arrow in its right border.
Navigation tree—Use the collapsible and expandable tree to display the VCDS AMT items that can be viewed or configured. The navigation tree can be hidden by clicking the < arrow in its right border.
–![]() The parent node (System) in the tree provides summary data.
The parent node (System) in the tree provides summary data.
–![]() Each child node in the tree (such as VCDS) provides data on the specific child node.
Each child node in the tree (such as VCDS) provides data on the specific child node.
•![]() Navigation Tabs—Click the tabs to display VCDS data for viewing. The VCDS node has two tabs: a Configuration tab and a Statistics tab.
Navigation Tabs—Click the tabs to display VCDS data for viewing. The VCDS node has two tabs: a Configuration tab and a Statistics tab.
•![]() Refresh —Click to update the displayed data. The VCDS AMT statistical data are not automatically updated when the VCDS real-time counters are incremented. The Last refresh date-and-time information to the right of the Refresh button indicates when the last update of displayed data occurred.
Refresh —Click to update the displayed data. The VCDS AMT statistical data are not automatically updated when the VCDS real-time counters are incremented. The Last refresh date-and-time information to the right of the Refresh button indicates when the last update of displayed data occurred.
Monitoring the Health of the VCDS Process and VQE Tools Server
When you click the System node in the navigation tree and the VCDS Status tab, the VCDS AMT displays VCDS and VQE Tools Server status information (Figure 5-2).
Figure 5-2 VCDS Status Information
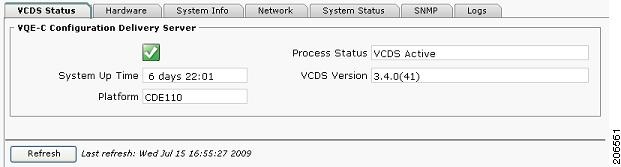
On the VCDS Status tab, a green icon with a checkmark indicates the VQE Tools server system is running and healthy. A red icon with an X indicates one or more problems with the VQE Tools server. A yellow icon with an exclamation mark (!) indicates that one or more of the following files are invalid:
•![]() Channel configuration file
Channel configuration file
•![]() Client database file
Client database file
•![]() Group attribute file
Group attribute file
From the VCDS Status tab, you can view the following status information:
•![]() System Up Time—Time that the Cisco CDE110 hosting VQE Tools has been running.
System Up Time—Time that the Cisco CDE110 hosting VQE Tools has been running.
•![]() Platform—Cisco CDE110 hardware platform that is hosting VQE Tools. Platform can be one of the following:
Platform—Cisco CDE110 hardware platform that is hosting VQE Tools. Platform can be one of the following:
–![]() Cisco CDE110 (models CDE110-1-036TXA-K9 and CDE110-1-036TXD-K9)
Cisco CDE110 (models CDE110-1-036TXA-K9 and CDE110-1-036TXD-K9)
–![]() Cisco CDE111 (models CDE111-2-146TXA-K9 and CDE111-2-146TXD-K9)
Cisco CDE111 (models CDE111-2-146TXA-K9 and CDE111-2-146TXD-K9)
–![]() UNKNOWN if the hardware platform cannot be determined
UNKNOWN if the hardware platform cannot be determined
•![]() Process Status—One of the following status messages:
Process Status—One of the following status messages:
–![]() VCDS Active—VCDS is running.
VCDS Active—VCDS is running.
–![]() VCDS Stopped—VCDS is not running
VCDS Stopped—VCDS is not running
–![]() VCDS Inactive—A configuration file is not correct.
VCDS Inactive—A configuration file is not correct.
•![]() VCDS Version—Current version of the VCDS software.
VCDS Version—Current version of the VCDS software.
In addition to the VCDS Status tab, you can get information on the VCDS and the VQE Tools server on the five other tabs. Table 5-2 lists the information that is available from each tab accessible from the System node.
Viewing VCDS Configuration and Statistics
When you click the VCDS node in the navigation tree and click the Configuration tab, the VCDS AMT displays information relating to the VCDS configuration, to VQE Client (VQE-C) channel configuration, to the client database file, and to the group attribute file (Figure 5-3). For more information on the client database and the group attribute files, see "VQE-C System Configuration Provisioning Server Role" section.
Note ![]() In the VCDS AMT, the group attribute file is referred to as the VQE-C network configuration file and the client database file is referred to as the VQE-C group map file.
In the VCDS AMT, the group attribute file is referred to as the VQE-C network configuration file and the client database file is referred to as the VQE-C group map file.
Viewing VCDS Configuration
When you click the Configuration tab, VCDS AMT displays the VCDS Configuration window (Figure 5-3).
Figure 5-3 VCDS Configuration Window
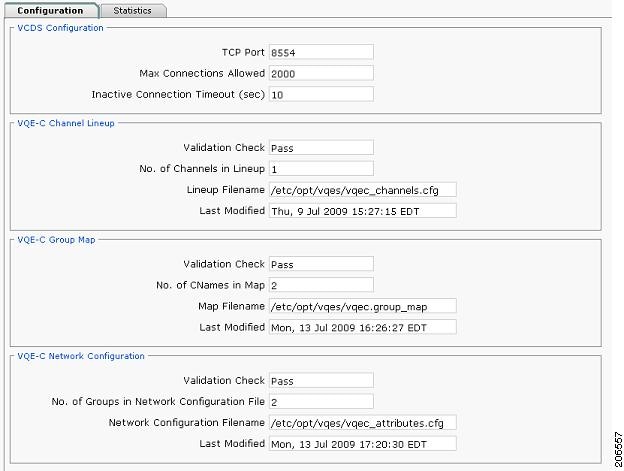
The Configuration window has the information listed in Table 5-3.
Viewing VCDS Statistics
When you click the Statistics tab, the VCDS AMT displays the VCDS Statistics window (Figure 5-4).
Figure 5-4 VCDS Statistics Window
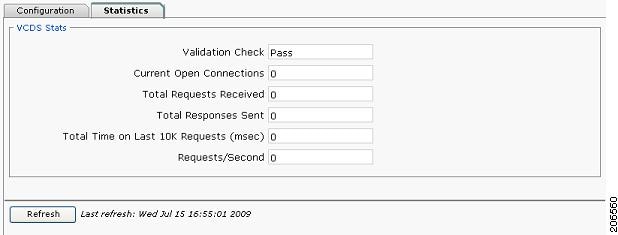
The VCDS Statistics window has the information listed in Table 5-4.
Change VCDS Logging
When you click Logging in the navigation tree, VCDS AMT displays the logging priority levels (Figure 5-5) for VCDS. The priority levels allow you to control the logging level for system messages for the VCDS process. All VCDS system messages are written to the file /var/log/vqe/vqe.log. In addition, you can send system messages to remote servers for centralized logging. For information on configuring remote syslog servers, see the "Remote Syslog Hosts" section.
Figure 5-5 Logging Priority Levels
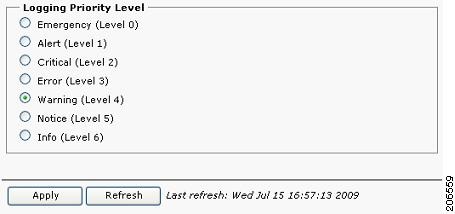
To change a VCDS logging priority level, click the button next to the level you want and click Apply.
In VCDS AMT, the logging priority levels are listed from least verbose to most verbose. The Emergency level generates the smallest number of messages, and the Info level generates the greatest number of messages. The default value is Warning.
When you select a logging level, log messages are generated for the levels below that level. For example, when the level is set to Error, messages are generated for Emergency, Alert, Critical, and Error.
The selected logging priority level does not persist when the VCDS service is stopped. When VCDS restarts, the logging priority level goes back to the default (Warning).
Change VCDS Debugging
When you click Debugging in the navigation tree, the debugging options for the VCDS are displayed. Figure 5-6 shows the debug options. The options allow you to control the types of debugging messages that are written to the syslog file. Debug messages are written to the file /var/log/vqe/vqe.log.
Figure 5-6 Debug Components
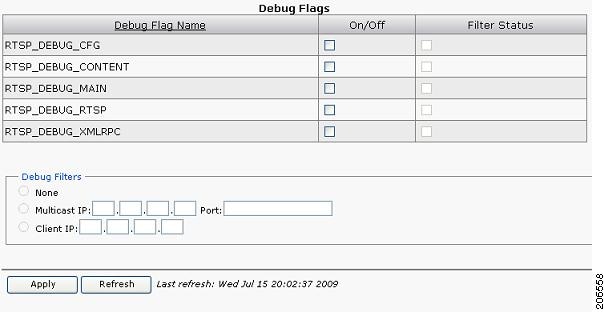
To change VQE-S debugging, follow these steps:
Step 1 ![]() In the VCDS AMT navigation tree, click Debugging.
In the VCDS AMT navigation tree, click Debugging.
The debug flags for VCDS are displayed.
Step 2 ![]() To enable a debugging flag, click the check box in the On/Off column, or to disable an enabled flag click the check box to uncheck it.
To enable a debugging flag, click the check box in the On/Off column, or to disable an enabled flag click the check box to uncheck it.
Step 3 ![]() Click Apply.
Click Apply.
The selected debugging options are enabled.
Note ![]() The selected debugging options do not persist when the VCDS service is stopped. When the VCDS restarts, debugging goes back to the default—no options are enabled. Debug filters are always disabled.
The selected debugging options do not persist when the VCDS service is stopped. When the VCDS restarts, debugging goes back to the default—no options are enabled. Debug filters are always disabled.
 Feedback