Feedback
Table Of Contents
Monitoring and Troubleshooting
Understanding Monitoring and Troubleshooting
Monitoring and Troubleshooting Database
Configuring Devices for Monitoring
Cisco ISE Dashboard Monitoring
Monitoring Network Process Status
Viewing, Editing, and Resolving Alarms
Viewing and Filtering Alarm Schedules
Creating, Editing, and Deleting Alarm Schedules
Creating, Assigning, Disabling, and Deleting Alarm Rules
Authenticated But No Accounting Start
Monitoring Live Authentications
Viewing and Editing Failure Reasons
Troubleshooting Network Access
Using Diagnostic Troubleshooting Tools
Troubleshooting RADIUS Authentications
Executing a Network Device Command
Evaluating a Network Device Configuration
Obtaining Additional Troubleshooting Information
Backing Up and Restoring the Monitoring Database
Scheduling Full and Incremental Backups
Restoring the Monitoring Database
Configuring System Alarm Settings
Configuring Alarm Syslog Targets
Monitoring and Troubleshooting
The Monitor tab on the Cisco Identity Services Engine (ISE) home page, also known as the dashboard, provides integrated monitoring, reporting, alerting, and troubleshooting, all from one centralized location.
This chapter explains monitoring and troubleshooting functions and tasks, and covers the following topics:
•
Understanding Monitoring and Troubleshooting
•
•
•
Note
Understanding Monitoring and Troubleshooting
Monitoring and troubleshooting is a comprehensive identity solution for all Cisco ISE run-time services, using the following components:
•
•
•
The Cisco ISE dashboard provides visibility into configured policies, authentication and authorization activities, profiled endpoints, postured sessions, and guest activities. Likewise, monitoring and troubleshooting capabilities include the following:
•
•
•
The data that is gathered by monitoring functionality is accessible from the central administration console, known as the Cisco ISE dashboard. When you log into the administration console, the real-time data, as shown in Figure 22-1.
The dashboard shows the activity on the Network Privilege Framework (NPF), and provides drill-down capabilities for information on the various components. For information on the dashlets and metric meters that comprise the dashboard, see Cisco ISE Dashboard Monitoring.
The NPF is composed of the following three tiers:
NPF authentication and authorization generates a flow of events. The events from the different sources are then collected by Cisco ISE monitoring and troubleshooting tools and summarized. You can view the authentication and authorization results on the dashboard, or choose to run any number of reports. For more information, see Chapter 23, "Reporting."
The NPF authentication and authorization event flow uses the following process:
Step 1
Step 2
Step 3
Step 4
Step 5
User Roles and Permissions
Monitoring and troubleshooting capabilities are associated with default user roles. The tasks you are allowed to perform are directly related to your assigned user role. For more information on the user roles and their assigned permissions, see Understanding the Impact of Roles and Admin Groups, page 2-12.
Monitoring and Troubleshooting Database
The Cisco ISE monitoring service collects and stores data in a specialized Monitoring database. The rate and amount of data utilized to monitor network functions may require a node dedicated solely to monitoring. If your Cisco ISE network collects logging data at a high rate from Policy Service ISE nodes or network devices, a Cisco ISE node dedicated to monitoring is recommended.
To manage the information stored in the Monitoring database, administrators are required to perform full and incremental backups of the database. This includes purging unwanted data, and then restoring the database. For more information, see Monitoring Administration.
Configuring Devices for Monitoring
The Monitoring ISE node receives and uses data from devices on the network to populate the dashboard display. To enable communication between the Monitoring ISE node and the network devices, switches and network access devices (NADs) must be configured properly.
For information on how to configure these devices, see the following:
•
•
Cisco ISE Dashboard Monitoring
The Cisco ISE dashboard (Home) is the landing page that appears after you log into the Cisco ISE administration console. The dashboard is a centralized management console consisting of metric meters along the top of the window, with dashlets below. This section describes the features functions that comprise the dashboard, as they are represented in the following the graphical user interface elements:
Dashboard real-time data provides an at-a-glance status of the devices and users that are accessing your network, as well as a system health overview.
Note
Figure 22-1 The Cisco ISE Dashboard
The Alarms icon at the bottom right of the Cisco ISE window provides instant access to alarm summaries. Mouse over the Alarms icon to display a pop-up page with a list of recent alarms. You can run filters on the list to view only the alarms of a specific nature. Or, you can drill down for detailed information on individual alarms.
Default alarms include ISE AAA health, ISE process status, ISE system health, and ISE system diagnostics.
For more information:
For information on how to interpret and use the data that is shown on the Cisco ISE dashboard, see the following sections:
•
•
Dashlets
Dashlets are individual panels on the dashboard, dashlets summarize important statistics about the devices and users accessing the network. They also provide information about the overall health and security of the network. Each dashlet contains an independent function, and can display the statistical data that is related to its function in various ways. This section explains the purpose and functions of the standard dashlets.
Note
Hovering a cursor over the elements of a dashlet brings up a tooltip with detailed information. Tooltip values for a sparkline reflect the specified time interval.
For example, a sparkline with the 24 hour time interval 14 March 3:00 AM, means the sparkline value is calculated based on logs from 3:00 AM to 4:00 AM on that date. Likewise, a sparkline for the 60 minute interval 14 March 3:01:00 AM, means the sparkline value is calculated based on logs from 3:01:00 to 3:02:00 on that date.
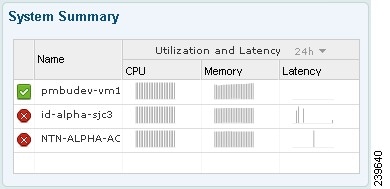
System Summary
The System Summary dashlet focuses on the health of the distributed identity services system deployment. This dashlet provides data for all the nodes on your network, providing an at-a-glance view of node performance, such as CPU, memory, and latency utilization. Sparklines represent a percentage of CPU usage over a specified time increment. For more information, see Sparklines, page 2-7.
The color of the system status icon indicates the health of your system:
•
•
•
•
When you hover the cursor over the health icon, a quick view dialog appears showing detailed information on system health.
Figure 22-2 System Summary Dashlet
Identity Stores
The Identity Stores dashlet for policy information points (PIP) focuses on the Microsoft Active Directory infrastructure, providing data on the number of authentications for users and devices, as well as the health of the servers. Internal user attributes and the credential information that was most used to authenticate users and hosts for a given time range is also shown.
Figure 22-3 Identity Stores Dashlet
Authentications
The Authentications dashlet shows passed and failed network authentications, providing data on the user or type of device, location, and the identity group to which the user or device belongs. The sparklines along the top of the dashlet represent distribution over the last 24 hours and the last 60 minutes.
When you hover your cursor over a stack bar or sparkline, a tooltip provides detailed information. Figure 22-4 shows data for all authentication attempts that are made on the network, both passed and failed.
Figure 22-4 Authentications Dashlet
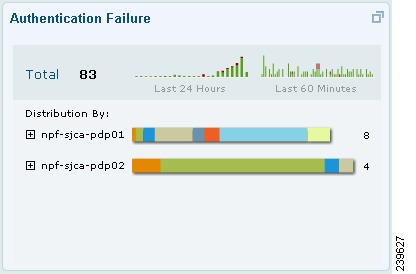
Authentication Failure
The Authentication Failure dashlet focuses on authentication failures, providing information on the nature of the failures. Total counts are shown across the top, while below is a breakdown of statistics by individual node and individual errors.
When you hover your cursor over a stack bar or sparkline, a tooltip provides detailed information. Sparklines use color to convey passed or failed authentication status at a glance. Green represents passed authentications, and red represents failed authentications.
You can quickly assess the nature of failures that occur on your network with the following information:
•
•
•
•
•
•
Figure 22-5 Authentication Failure Dashlet
Profiled Endpoints
The Profiled Endpoint dashlet focuses on the endpoints on the network that have matched profiles, providing profile data for each endpoint. For example, the statistics allow you to determine the type of device, its location, and its IP address. The sparklines along the top of the dashlet represent endpoint activity over the last 24 hours and last 60 minutes.
You can expand the following data categories for more information:
•
•
•
Note
For information on Profiled Endpoints dashlet, see the "Profiled Endpoints Dashlet" section on page 17-6.
Figure 22-6 Profiled Endpoints Dashlet
Posture Compliance
The Posture Compliance dashlet focuses on the health of the network, providing information on the users who are accessing the network and whether they meet posture compliance. Data is shown on the devices that are currently connected to the network. The stack bars show noncompliance statistics that are arranged according to operating system and other criteria. Sparklines represent the percentage of compliant versus noncompliant posture attempts.
•
Note
•
•
•
For information on Posture Compliance dashlet, see the "Posture Compliance Dashlet" section on page 19-8.
Figure 22-7 Posture Compliance Dashlet
Metric Meters
Metric meters are graphs that appear along the top section of the dashboard. Their data is refreshed every minute to provide real-time at-a-glance information.
Note
Active Endpoints
The Active Endpoints metric meter shows data representing the endpoints connected to the network. The change indicator shows the difference in the number of active endpoints between refreshes.
Figure 22-8 Active Endpoints Metric Meter
Active Guests
The Active Guests metric meter shows data representing the current active guests on the network. The change indicator shows the difference in count between the current refresh and the last refresh.
Figure 22-9 Active Guests Metric Meter
Posture Compliance
The Posture Compliance metric meter shows the (average) percentage of hosts that are connected to the system that were compliant with posture rules over the last 24 hours. The black line superimposed on the color-coded bar changes dynamically to show compliancy. The color-coded bar beneath remains static: red, yellow, green, showing a progression from lowest to highest compliancy. The vertical white line on the left (at the 80 percent point) is a visual marker that helps make at-a-glance assessment of the data easier to interpret.
Figure 22-10 Posture Compliance Metric Meter
Mean Time to Remediate
The Mean Time to Remediate metric meter shows the average time that it takes for hosts that are connected to the network to move from a noncompliant state to a compliant state.
Figure 22-11 Mean Time to Remediate Metric Meter
Profiled Endpoints
The Profile Endpoints metric meter shows data representing the total number endpoints that have been profiled on the network for the last 24 hours, including those that are unknown.
Figure 22-12 Profiled Endpoints Metric Meter
Monitoring the Network
This section discusses the ways in which you can monitor your Cisco ISE network, and covers the following topics:
•
•
Monitoring Network Process Status
You can view process status for the network from the Cisco ISE dashboard using the System Summary dashlet. For example, when processes like the application server or database fail, an alarm is generated and you can view the results using the System Summary dashlet.
To view process status, complete the following steps:
Step 1
Step 2
•
•
•
For more information:
See Appendix A, "User Interface Reference."
Troubleshooting Topics
•
Managing Alarms
This section introduces Cisco ISE alarms, schedules, and rules which you can configure to effectively monitor your network. You can view them and specify alarms to notify you when critical system conditions occur. Notifications automatically appear in the Monitor > Alarms > Inbox, but you can also receive notification of events through email and syslog messages.
This section covers the following topics:
•
•
•
•
Understanding Alarms
This section covers the basics of alarms and notifications, and covers alarm categories, schedules and rules (or thresholds), alarm notifications, alarm syslog targets, license enforcement alarms, and RADIUS authentication alerts.
There are two basic categories of alarms: alarm rules and system alarms. See Available Alarm Rules, for descriptions of the standard Cisco ISE alarm rules that you can customize for your network.
Default alarms include ISE AAA health, ISE process status, ISE system health, and ISE system diagnostics.
Alarm Rules
Alarm rules notify you of specified events in log data that is collected from ISE nodes. For example, you can configure alarm rules to notify you about system health, process status, and authentication activity or inactivity.
You define conditions, or rules, on data sets, the time period for applying the alarm rule, the severity of the alarm, and how the notifications should be sent. When alarm rule conditions are met, an alarm is triggered. There are many alarm rule categories that allow you to monitor various types of system behavior.
System Alarms
System alarms notify you of critical conditions that are encountered on the network. They also provide informational status of system activities, such as data purge events. You cannot create or delete system alarms, because they are predefined. However, you can configure how you want to be notified when they occur, or disable them entirely. When you enable system alarms, they are sent to the alarms inbox.
System alarms do not have an associated schedule and are sent immediately after an event occurs. You can only enable or disable system alarms as an entire group, not on an individual basis. For a list of the various types of system alarms and instructions on how to set them, see Configuring System Alarm Settings.
Schedules and Alarm Rules
A schedule consists of one or more continuous or noncontinuous periods you define when you create a alarm rule. For example, you can create a schedule that is active from 8:00 a.m. (0800) to 5:00 p.m. (1700) Monday through Friday. When you assign this schedule to an alarm rule, the rule is evaluated and the alarm is generated only during the specified active period.
Alarm rules are evaluated periodically, with the cycle frequency depending on the number of enabled rules. For example, if there are 1-20 enabled alarm rules, the evaluation cycle might occur every two (2) minutes. For 21-50 enabled rules, the evaluation cycle might occur every three (3) minutes, and 51-100 enabled rules every five (5) minutes.
Note
When an evaluation cycle begins, each enabled alarm rule is evaluated. If the schedule allows the rule to be executed, the conditions are also evaluated. An alarm is triggered when the conditions of a specified rule are met.
Alarm Notifications
Alarm notifications are generated based on alarm rule conditions, and are evaluated over a specified time period, or schedule. An alarm notification is sent whenever a rule condition is reached or a system alarm is generated.
Alarm notifications are contained in the following locations:
•
The alarm inbox can contain up to 5000 alarms, the most recent alarms appearing at the top. Alarms that have been acknowledged or closed are removed from the list.
•
•
•
For more information, see Specifying Email Settings and Configuring System Alarm Settings.
Alarm Syslog Targets
Alarm syslog targets are the destinations to which syslog messages are sent. Alarm notifications are sent in the form of syslog messages. You must have a configured syslog server on your network to receive syslog messages. For more information, see Configuring Alarm Syslog Targets.
License Enforcement Alarms
License enforcement alarms count concurrent endpoints or users and verify that number against the total amount that is allowed for a particular license. When the count exceeds the amount that is allowed by a license, a syslog is sent indicating that the license count has been exceeded.
Viewing, Editing, and Resolving Alarms
You can view alarms that met configured alarm rules in the alarms inbox or in the Global Toolbar slide-up window.
The alarm inbox displays a list of recent alarms, which you can select from to view the alarm details. After viewing information for an alarm, you can edit its status, assign the alarm to an administrator, and add notes to track the event.
The Global Toolbar shows the current number of alarms, and the slide-up window displays a read-only list of alarms.
Note
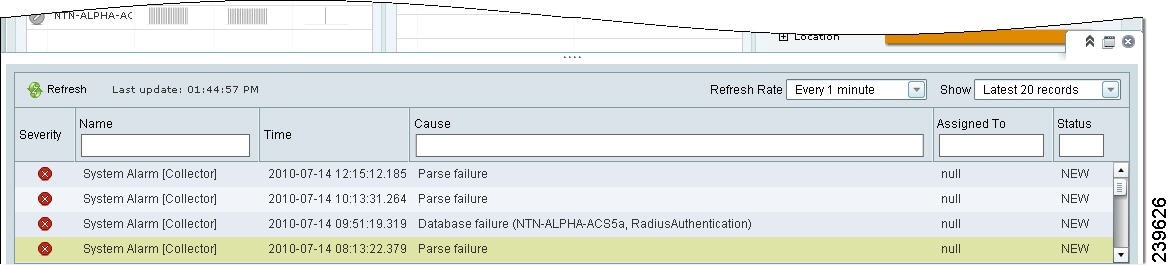
Viewing Alarm Summaries
You can view a list of recent alarms from the alarm summary window that you access from the global toolbar. The global toolbar is always available at the bottom of the Cisco ISE window.
To view a list of alarms, complete the following steps:
Step 1
Step 2
Step 3
Step 4
Figure 22-13 Alarm Summary Window
Using the Alarm Box to View, Edit, and Resolve Alarms
The following task shows you how to use the alarm inbox to view and edit alarms.
To view and edit an alarm in the alarm inbox, complete the following steps:
Step 1
Step 2
Step 3
a.
b.
c.
You are returned to the alarms inbox.
Step 4
•
•
Viewing and Filtering Alarm Schedules
You can view a list of all available alarm schedules, and then narrow the results by filtering for specified criteria.
Note
To view and filter alarm schedules, complete the following steps:
Step 1
Step 2
Step 3
Creating, Editing, and Deleting Alarm Schedules
You can create alarm schedules to specify when alarm rules are run, and then edit and delete schedules as necessary. Alarm schedules can run at different times of the day throughout a seven-day (week) period. The default alarm schedule is nonstop, monitoring events 24 hours a day, 7 days a week.
Note
Creating an Alarm Schedule
The following task shows you how to create and save alarm schedules.
To create an alarm schedule, complete the following steps:
Step 1
Step 2
Step 3
Step 4
•
Click Clear All or Undo All to clear the schedule and start again.
•
Use Clear All or Undo All to clear the schedule and start again.
Step 5
If you submitted the schedule, it appears in the list of schedules.
Editing or Deleting an Alarm Schedule
The following task shows you how to edit and delete an alarm schedule.
To edit or delete an alarm schedule, complete the following steps:
Step 1
Step 2
•
•
–
–
–
Step 3
Creating, Assigning, Disabling, and Deleting Alarm Rules
You define alarm rule conditions (also known as rules) on data sets, the time period for (applying) the alarm rule, the severity of the alarm, and how the notifications should be sent. Due to the time element, an alarm rule must be linked to an alarm schedule.
This section shows you how to create an alarm rule and assign it to a schedule. It then shows you how to delete an alarm rule.
Prerequisite
You should have created an alarm schedule, as described in Creating, Editing, and Deleting Alarm Schedules.
Creating and Assigning an Alarm Rule
One of the requirements for creating an alarm rule is that you assign it to a schedule. The following task shows you how to create an alarm rule, and then assign it to a schedule.
The following default alarm rules are shown in the user interface:
•
•
•
•
You can create these alarm rules using the following procedure:
•
•
•
•
•
•
•
•
Note
To create an alarm rule and assign it to a schedule, complete the following steps:
Step 1
•
•
Step 2
Step 3
a.
b.
c.
Step 4
Step 5
For more information:
See Available Alarm Rules, for descriptions of the standard Cisco ISE alarm rules that you can customize for your network.
Disabling or Deleting an Alarm Rule
You can disable an alarm rule, which turns it off without removing it. Or you can delete the alarm rule entirely.
To disable or delete an alarm rule, complete the following steps:
Step 1
Step 2
Step 3
To turn back on a disabled alarm rule, select the check box next to the rule and click Enable.
Step 4
For more information:
See Available Alarm Rules, for descriptions of the standard Cisco ISE alarm rules that you can customize for your network.
Available Alarm Rules
Cisco ISE provides the following standard categories for alarm rules. You can use the following alarm rules in their default form, or customize them to meet your needs:
•
Passed Authentication
When Passed Authentication rules are evaluated, passed authentications (such as RADIUS) that occurred during a specified time interval (up to the previous 24 hours) are examined. These authentication records are grouped by a common attribute, such as instance, user, identity group, and so on. The number of records within each of these groups is computed. If the count for any of these groups exceeds the specified rule, an alarm is triggered.
For example, a rule that is configured for passed authentications greater than 1000 in the past 20 minutes for an instance is evaluated. The following table shows the three instances that passed authentications. An alarm was triggered, because at least one instance passed more than 1000 authentications in the past 20 minutes.
New York Cisco ISE
1543
Chicago Cisco ISE
879
Los Angeles Cisco ISE
2096
Note
For more information:
See Passed Authentications, page A-5 of Appendix A, "User Interface Reference."
Failed Authentication
When the Failed Authentication rule is evaluated, failed authentications (such as RADIUS) that occurred during a specified time interval (up to the previous 24 hours) are examined. These authentication records are grouped by a common attribute, such as Cisco ISE instance, user, identity group, and so on. The number of records within each of these groups is computed. If the count that is computed for any of these groups exceeds the specified rule, an alarm is triggered.
For example, the rule reflected in the table is configured with failed authentications greater than 10 in 2 hours for Device IP. If failed authentications have occurred for four IP addresses in the past two hours, such as shown in the following table, an alarm is triggered. At least one Device IP has greater than 10 failed authentications in the past 2 hours.
Note
You can specify one or more filters to limit the failed authentications that are considered for rule evaluation. Each filter is associated with a particular attribute in the authentication records, and only those records whose filter value matches the value that you specify are counted. If you specify multiple filters, only the records that match all the filter conditions are counted.
For more information:
See Failed Authentications, page A-7 of Appendix A, "User Interface Reference."
Authentication Inactivity
When the Authentication Inactivity rule is evaluated, it examines authentications (such as RADIUS) that occurred during a specified time interval, up to the previous 31 days. If no authentications have occurred, an alarm is triggered. You can specify filters to generate an alarm if no authentications are seen for a particular instance or device IP address during the time interval.
If the specified time interval for authentication inactivity is less than the time taken to complete an aggregation job, then the alarm is suppressed.
Note
For more information:
See Authentication Inactivity, page A-9 of Appendix A, "User Interface Reference."
ISE Configuration Changes
The ISE Configuration Changes alarm is generated when configuration changes, such as adding, updating, or deleting a user or policy, and the like, are made to the server. Cisco ISE then examines the configuration changes made during the interval between the previous and current alarm evaluation cycles. If one or more changes were made, an alarm is triggered. For example, a new user is added, an existing user is updated, and another user is deleted, causing the alarm to be triggered. Installing new software can also trigger a configuration change alarm.
You can specify one or more filters to limit which configuration changes are considered for rule evaluation. Each filter is associated with a particular attribute in the records, and only those records that match the filter condition are counted. If you specify multiple filter values, only the records that match all the filter conditions are counted.
For more information:
See ISE Configuration Changes, page A-9 of Appendix A, "User Interface Reference."
ISE System Diagnostics
When the ISE System Diagnostics rule is evaluated, the system diagnostic records that were generated during the specified interval are examined. If one or more diagnostics were generated at or above the specified security level, an alarm is triggered.
Note
You can specify one or more filters to limit which system diagnostic records are considered for rule evaluation. Each filter is associated with a particular attribute in the records and only those records that match the filter condition are counted. If you specify multiple filter values, only the records that match all the filter conditions are counted.
For more information:
See ISE System Diagnostics, page A-10 of Appendix A, "User Interface Reference."
ISE Process Status
When the ISE Process Status rule is evaluated and one or more failures are detected, an alarm is triggered. You can limit the check to particular processes, a particular Cisco ISE instance, or both.
For example, when processes like the application server or database fail, an alarm is generated and you can view the results using the System Summary dashlet.
Note
For more information:
See ISE Process Status, page A-10 of Appendix A, "User Interface Reference."
ISE Health System
When the ISE Health System rule is evaluated, system health parameters are examined as a result of values exceeding the rule for a specified time interval (up to the previous 60 minutes). These health parameters include percentage of CPU utilization, percentage of memory consumption, and so on. If any parameters exceed the rule, an alarm is triggered. By default, the rule applies to all Cisco ISE instances. However, you can choose to limit the check to just a single Cisco ISE instance.
Note
For more information:
See ISE System Health, page A-11 of Appendix A, "User Interface Reference."
ISE AAA Health
When the ISE AAA Health rule is evaluated, ISE health parameters that exceeded the rule for the specified time interval (up to the previous 60 minutes) are examined. Cisco ISE monitors the following parameters:
•
•
If any of the parameters exceed the rule, an alarm is triggered. By default, the rule applies to all monitored Cisco ISE instances. However, you can choose to limit the check to just a single Cisco ISE instance.
Note
For more information:
See ISE AAA Health, page A-11 of Appendix A, "User Interface Reference."
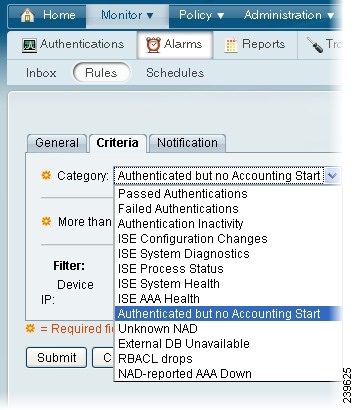
Authenticated But No Accounting Start
When the Authenticated But No Accounting Start rule is evaluated, it determines whether a specified number of authenticated sessions have occurred in the past 15 minutes, where an accounting start event has not been received for a device IP.
These events are grouped by device IP address. If the occurrences for a device IP exceeds the specified of the rule, an alarm is triggered. You can set a filter to limit the evaluation to a single device IP.
Note
For more information:
See Authenticated But No Accounting Start, page A-12 of Appendix A, "User Interface Reference."
Unknown NAD
When the Unknown NAD rule is evaluated, the RADIUS failed authentications that occurred during the specified time interval (up to the previous 24 hours) are examined. The failed authentications with the failure reason "unknown NAD" are identified. The unknown NAD authentication records are grouped by a common attribute, such as Cisco ISE instance, user, and so on. A count of the records within each of the groups is computed, and if the records for any group exceed the specified rule, an alarm is triggered.
Take the following rule for example: Unknown NAD count greater than 5 in the past 1 hour for a Device IP
In our example, after one hour, the failed authentications with an "unknown NAD" failure reason occur for two different device IP addresses. An alarm is triggered as a result, because at least one device IP address has a count greater than 5. The following table shows the data for this example.
You can specify one or more filters to limit failed authentications that are considered for rule evaluation. Each filter is associated with an attribute in the records, and only those records that match the filter condition are counted. If you specify multiple filter values, only the records that match all the filter conditions are counted.
Note
For more information:
See Unknown NAD, page A-12 of Appendix A, "User Interface Reference."
External DB Unavailable
When the External DB Unavailable rule is evaluated, RADIUS failed authentications that occur during a specified time interval (up to the previous 24 hours) are examined. The failed authentications with the "external DB unavailable" failure reason are then determined. Authentication records with this failure reason are grouped by a common attribute, such as Cisco ISE instance, user, and so on. A count of the records within each of these groups is computed. If the count of records for any group exceeds the rule, an alarm is triggered.
Take the following rule for example: External DB Unavailable count greater than 5 in the past 1 hour for a Device IP
In our example, after one hour, the failed authentications with an "external DB unavailable" failure reason occur for two different device IP addresses. An alarm is triggered, because at least one device IP address has a count greater than 5. The following table shows the data for this example.
You can specify one or more filters to limit the failed authentications considered for rule evaluation. Each filter is associated with an attribute in the records, and only those records that match the filter condition are counted. If you specify multiple filter values, only the records that match all the filter conditions are counted.
Note
For more information:
See External DB Unavailable, page A-13 of Appendix A, "User Interface Reference."
RBACL Drops
When the RBACL Drops rule is evaluated, Security Group Access RBACL drops that occurred during a set time interval (up to the previous 24 hours) are examined. The RBACL drop records are grouped by a particular common attribute, such as NAD, SGT, and so on. The number of records for group is computed. If the count for any group exceeds the rule, an alarm is triggered.
Take the following rule for example: RBACL drops greater than 10 in the past 4 hours by an SGT
In our example, RBACL drops occur for two different source group tags in a four-hour period. An alarm is triggered, because at least one SGT has a count greater than 10. The following table shows the data for this example.
You can specify one or more filters to limit the RBACL drop records that are considered for rule evaluation. Each filter is associated with a particular attribute in the RBACL drop records, and only those records that match the filter condition are counted. If you specify multiple filter values, only the records that match all the filter conditions are counted.
Note
For more information:
See RBACL Drops, page A-13 of Appendix A, "User Interface Reference."
NAD-Reported AA Down
For the NAD-Reported AAA rule, NAD-reported AAA down events occurring during a specified interval (up to the previous 24 hours) are examined. The AAA down records are then grouped by a particular common attribute, such as device IP address or device group, and a count of records within each group is made. If the count for any group exceeds the specified rule, an alarm is triggered.
Take, for example, the following rule configuration: AAA down count greater than 10 in the past 4 hours by a Device IP
In our example, in the past 4 hours, NAD-reported AAA down events occurred for 3 different device IP addresses, triggering an alarm because at least one device IP address has a count greater than 10. The following table shows the data for this example.
You can specify one or more filters to limit the AAA down records, that are considered for rule evaluation. Each filter is associated with a particular attribute in the AAA down records and only those records that match the filter condition are counted. If you specify multiple filter values, only the records that match all the filter conditions are counted.
Note
For more information:
See NAD-Reported AAA Downtime, page A-14 of Appendix A, "User Interface Reference."
Monitoring Live Authentications
You can monitor recent RADIUS authentications as they happen from the Live Authentications page. The page displays the top 10 RADIUS authentications in the last 24 hours. This section explains the functions of the Live Authentications page.
The Live Authentications page provides a tabular account of recent RADIUS authentications, in the order in which they happen.
Note
Figure 22-14 Live Authentications Page
The Live Authentication data categories that are shown by default include the following:
•
•
•
•
•
•
•
•
•
•
•
•
•
Optionally, you can choose to show the following categories:
•
•
•
•
•
You can choose to view all of the columns, or to display only selected data columns. After selecting the columns that you want to appear, you can save your selections.
To access and modify the Live Authentications display, complete the following steps:
Step 1
Step 2
Step 3
Step 4
Step 5
•
•
•
•
•
•
•
•
•
Step 6
•
Note
•
•
•
Step 7
Troubleshooting Topics
•
•
•
Monitoring Guest Activity
A guest is a type of user that has limited permissions, such as restricted network access and time duration. For example, a guest might not have access to the company's internal network, and the account expires after eight hours.
You can monitor guests that are currently on the network through the authentications that are generated by these accounts. One way to do this would be to set alarm rules for all users of type guest, and then monitor the live authentications.
To monitor guest activity, complete the following steps:
Step 1
Step 2
Step 3
Troubleshooting Topics
•
•
•
Monitoring Data Collections
Monitoring functionality collects log and configuration data from nodes on your Cisco ISE network, stores the data in the Monitoring database, and processes it to generate reports and alarms. You can view the details of the logs that are collected from any of the servers in your deployment.
To monitor data collections for system performance and health, complete the following steps:
Step 1
Step 2
Step 3
Step 4
Step 5
For more information:
See the Alarms, page A-2 of Appendix A, "User Interface Reference."
Troubleshooting Topics
•
•
•
Troubleshooting the Network
This section covers the following topics:
•
•
•
•
Viewing and Editing Failure Reasons
The Failure Reason Editor allows you to view and edit the description of a failure reason, as well as providing instructions on how to resolve the problem.
To view and edit failure reasons, complete the following steps:
Step 1
Step 2
Step 3
•
•
Step 4
a.
b.
c.
d.
For more information:
See Troubleshoot, page A-41 of Appendix A, "User Interface Reference."
Troubleshooting Network Access
You can troubleshoot network access for a specific user, device, or search criteria based on attributes that are related to the authentication requests. You do this by running an Authentication Failure Code Lookup report.
Note
To troubleshoot network access based on authentication requests, complete the following steps:
Step 1
Step 2
Step 3
Step 4
•
•
•
•
Step 5
For more information:
See Troubleshooting RADIUS Authentications.
Performing Connectivity Tests
Failed authentications can be caused by connection problems. Troubleshooting tools functionality allows you to perform connectivity tests to check for connectivity issues. You can enter the hostname or the IP address of the network device with which you are trying to connect and execute the following commands from the web interface: ping, traceroute, and nslookup. The output is displayed in the dashboard window.
To perform connectivity tests, complete the following steps:
Step 1
Step 2
Step 3
Step 4
•
•
•
For more information:
See Policy, page A-55 of Appendix A, "User Interface Reference."
Using Diagnostic Troubleshooting Tools
Diagnostic Tools help you to diagnose and troubleshoot problems on an Cisco ISE network. Detailed instructions on how to resolve the problem is also provided. You can use these tools to evaluate the configuration of any network device on your network, including Security Group Access devices, and troubleshoot passed and failed authentications.
This section covers the following diagnostic procedures:
•
•
•
•
Troubleshooting RADIUS Authentications
Use the RADIUS Authentication diagnostic tool to troubleshoot RADIUS authentications issues.
To search and select a RADIUS authentication for troubleshooting, complete the following steps:
Step 1
Step 2
Step 3
•
•
•
•
•
•
–
–
–
•
Note
•
•
Step 4
The Search Result table is populated with the results of your search. The following fields appear in the table: Time, Status, Username, MAC Address, Audit Session ID, Network Device IP, Failure Reason, and Allowed Protocol.
Step 5
The Expert Troubleshooter begins to troubleshoot your RADIUS authentication. You are prompted for additional input, if required.
Step 6
The Progress Details page appears, providing a summary. You may be prompted for additional input, if required. If additional input is required, click User Input Required and enter the necessary information.
Step 7
The Progress Details page refreshes periodically, displaying tasks that are performed as troubleshooting progresses.
Step 8
Step 9
For more information:
See RADIUS Authentication Troubleshooting—Progress Details, page A-43 of Appendix A, "User Interface Reference."
Troubleshooting Topics
•
•
•
Executing a Network Device Command
The Execute Network Device Command diagnostic tool allows you to run the show command on any network device from the centralized Cisco ISE dashboard. The results are exactly what you would see on a console, and can be used to identify problems in the configuration of the device.
To run the show command on any network device, complete the following steps:
Step 1
Step 2
Step 3
•
•
Step 4
Step 5
Step 6
For more information:
See Progress Details, page A-46 of Appendix A, "User Interface Reference."
Evaluating a Network Device Configuration
You can use this diagnostic tool to evaluate the configuration of a network device and identify any configuration problems. The Expert Troubleshooter compares the configuration of the device with the standard configuration.
To evaluate the configuration of a network device, complete the following steps:
Step 1
Step 2
Step 3
Step 4
•
•
•
•
–
–
–
Step 5
Step 6
A new window appears, prompting you to select the interfaces for the configuration analysis.
Step 7
Step 8
For more information:
See Progress Details, page A-46 of Appendix A, "User Interface Reference."
Troubleshooting Posture Data
The Posture Troubleshooting tool helps you find the cause of a posture check failure to identify the following:
•
•
•
You determine this information by filtering requests based on parameters, such as username, MAC address, posture status, and so on.
To troubleshoot posture incidents, complete the following steps:
Step 1
Step 2
Step 3
•
•
•
–
–
–
–
•
•
Note
•
Step 4
The search results appear in the window, displaying time, status, username, MAC address, and failure reason for each event.
Step 5
For more information:
See Egress SGACL Policy, page A-49 of Appendix A, "User Interface Reference."
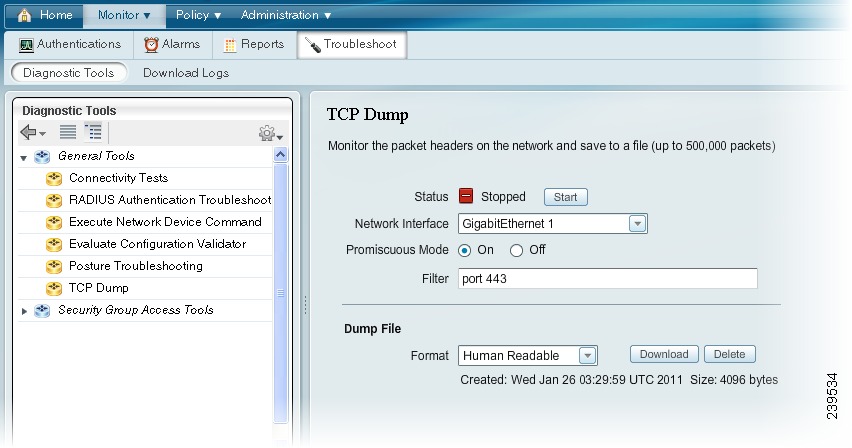
Troubleshooting with TCP Dump
The tcpdump utility monitors the contents of packets on a network interface that match a given boolean expression. You can use the tcpdump utility to troubleshoot problems on your network. Cisco ISE troubleshooting diagnostic tools provide an intuitive user interface for this utility.
This section shows you how to use the TCP Dump feature directly from the Cisco ISE dashboard, and covers the following topics:
•
Warning
Monitoring and Saving Packets
This procedure shows you how to configure TCP Dump options and then collect data from the network traffic to help you troubleshooting a network issue.
To monitor packets on the network, complete the following steps:
Step 1
Step 2
Step 3
This is the interface upon which the network traffic is monitored, or sniffed.
Step 4
Promiscuous mode is the default packet sniffing mode. It is recommended that you leave it set to On. In this mode the network interface is passing all traffic to the system's CPU.
Step 5
Standard tcpdump filter expressions are supported, such as the following:
host 10.0.2.1 and port 1812
Step 6
Note
The date, time, format, and size of the file are shown at the bottom of the pane.
Step 7
Next Step
Troubleshooting Topics
•
Saving a Dump File
This procedure shows you how to save a dump file that you can use for troubleshooting purposes.
Prerequisite
You should have successfully completed Monitoring and Saving Packets.
To download a previous dump file, complete the following steps:
Step 1
Step 2
Step 3
Step 4
Step 5
Figure 22-15 TCP Dump
Note
Comparing SGACL Policies
For devices that are enabled with the Security Group Access solution, an SGACL is assigned for every source and destination SGT pair based on the egress policy matrix that is configured in Cisco ISE. The egress policy diagnostic tool uses the following process for its comparison:
1.
2.
3.
4.
To compare SGACL policies using the Egress (SGACL) Policy tool, complete the following steps:
Step 1
Step 2
Step 3
Step 4
Step 5
Step 6
Step 7
For more information:
See Egress SGACL Policy, page A-49 of Appendix A, "User Interface Reference."
Comparing SXP-IP Mappings
Security Group Access devices communicate with their peers and learn their SGT values. The Security Exchange Protocol (SXP)-IP Mappings diagnostic tool connects to the device whose IP address you provide and lists the IP addresses of the peer devices and SGT values. You must select one or more of the device peers. This tool connects to each of the peers that you select, and it obtains their SGT values to verify that these values are the same as the values that it learned earlier.
To compare SXP-IP mappings between a device and its peers, complete the following steps:
Step 1
Step 2
Step 3
Step 4
The Expert Troubleshooter retrieves Security Group Access SXP connections from the network device and again prompts you to select the peer SXP devices.
Step 5
Step 6
Step 7
Step 8
For more information:
See SXP-IP Mappings, page A-51 of Appendix A, "User Interface Reference."
Comparing IP-SGT Pairs
For devices that are enabled with the Security Group Access solution, each user is assigned an SGT value through RADIUS authentication. The IP User SGT diagnostic tool connects to the network device (whose IP address you provide) and performs the following tasks:
1.
2.
3.
To compare IP-SGT values on a device with the most assigned SGT, complete the following steps:
Step 1
Step 2
Step 3
•
•
•
•
Step 4
Step 5
Step 6
For more information:
See IP User SGT, page A-53 of Appendix A, "User Interface Reference."
Comparing SGT Devices
For devices that are enabled with the Security Group Access solution, each network device is assigned an SGT value through RADIUS authentication. The Device SGT diagnostic tool connects to the network device (whose IP address you provide) and performs the following tasks:
1.
2.
3.
To compare the device SGT with the recently assigned SGT value, complete the following steps:
Step 1
Step 2
Step 3
•
•
–
–
–
–
•
•
Step 4
Step 5
The Results Summary page appears with the diagnosis, resolution, and troubleshooting summary.
For more information:
See Device SGT, page A-54 of Appendix A, "User Interface Reference."
Obtaining Additional Troubleshooting Information
Cisco ISE allows you to download support and troubleshooting information from the administrative user interface. You can use the support bundle to prepare diagnostic information for the Cisco Technical Assistance Center (TAC) to troubleshoot problems with Cisco ISE.
Note
This section contains the following topics:
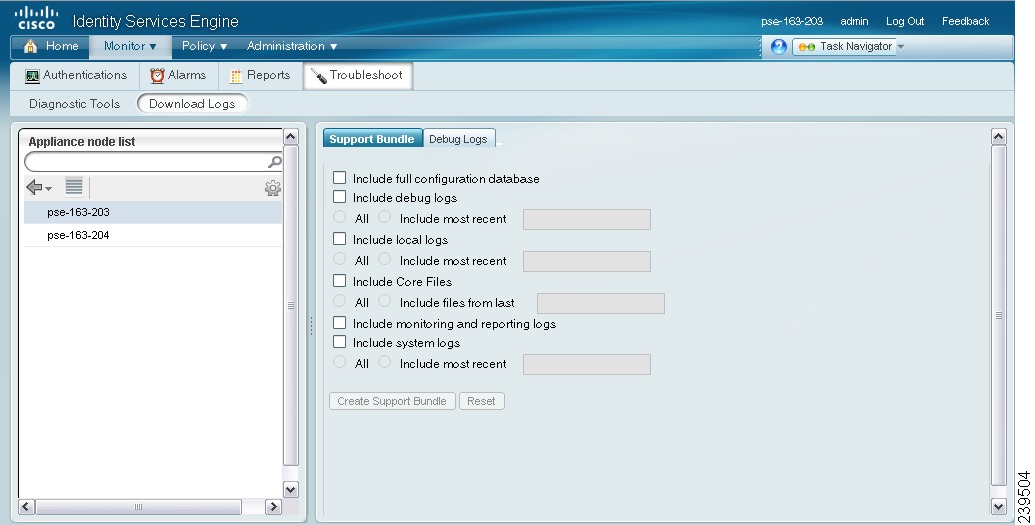
Downloading Support Bundles
You can download the support bundle to your local computer as a simple tar.gz file. The support bundle will be named with the date and time stamps in the format ise-support-bundle-mm-dd-yyyy-hh-mm.tar.gz. The browser prompts you to save the support bundle to an appropriate location.
These logs are categorized as follows:
•
•
•
•
•
•
You can download these logs from the Cisco ISE CLI by using the backup-logs command. For more information, see the Cisco Identity Services Engine CLI Reference Guide, Release 1.0.
Note
If you choose to download these logs from the administrative user interface, you have the option to:
•
•
The debug logs provide troubleshooting information for specific ISE components. See "Downloading Debug Logs" section for more information.
The monitoring logs provide information about the monitoring, reporting, and troubleshooting features.
Note
Prerequisite:
Every Cisco ISE administrator account is assigned one or more administrative roles. To perform the operations that are described in the following procedure, you must have Super Admin or System Admin privileges. See Cisco ISE Admin Group Roles and Responsibilities for more information on the various administrative roles and the privileges that are associated with each of them.
To download support bundles, complete the following steps:
Step 1
Step 2
The Support Bundle page appears with a screen similar to that shown in Figure 22-16 appears. Your support bundle is populated with the parameters you choose here.
Figure 22-16 Download Parameters Page
Step 3
You must check the Include debug logs check box for the debug logs to be part of the support bundle. To enable debug logs, see Chapter 13, "Logging". If you do not enable the debug logs, all the informational messages (INFO) will be included in the support bundle.
If you include All the logs, your support bundle will be excessively large and the download will take a lot of time. To optimize the download process, you can choose to download only the most recent n number of files.
Step 4
The support bundle is a .zip file that is downloaded to the client system that is running your application browser. You must extract the contents of the .zip file and untar the tar.gz file to view the logs.
Next Step:
See "Downloading Debug Logs" procedure for information on how to obtain debug logs for specific components.
Downloading Debug Logs
Debug logs provide troubleshooting information for various Cisco ISE components. While reporting problems, you might be asked to enable these debug logs on ISE and send these logs for diagnosis and resolution of your problems.
Obtaining debug logs is a two-step process:
1.
Table 22-2 provides a list of components and the corresponding debug logs that it generates.
2.
Prerequisite:
Every Cisco ISE administrator account is assigned one or more administrative roles. To perform the operations that are described in the following procedure, you must have one of the following roles assigned: Super Admin or System Admin. See Cisco ISE Admin Group Roles and Responsibilities for more information on the various administrative roles and the privileges that are associated with each of them.
To download debug logs, complete the following steps:
Step 1
Step 2
The Support Bundle and Debug Logs page appears.
Step 3
A list of debug log types and debug logs is displayed. This list is based on your debug log configuration. See "Understanding Debug Log Configuration" section on page 13-8 for more information.
Step 4
You can repeat this process to download other log files, as needed.
The following are additional debug logs that you can download from the Debug Logs page:
•
•
•
•
•
•
Monitoring Administration
The rate and amount of data that is utilized by Monitoring functions requires a separate database on a dedicated node that is used for these purposes.
Like Policy Service, Monitoring has a dedicated database that requires administrators to perform maintenance tasks, such as the topics covered in this section:
•
•
•
Backing Up and Restoring the Monitoring Database
Monitoring functionality handles large volumes of data. Over time, the performance and efficiency of the node depends on how well you manage that data. To increase efficiency, it is recommended that you back up the data and transfer it to a remote repository on a regular basis. You can automate this task by scheduling automatic backups.
Note
Due to the size of the Monitoring database, the backup process can take a while to complete. To save time, you can perform incremental backups, after first completing an initial full database backup. A recommended step, purging unwanted data during the backup process permanently deletes data from the database, and can be configured as an automatic process.
Warning
This section shows you how to effectively manage the Monitoring database and optimize disk space through the following tasks:
•
•
Note
Configuring Data Purging
The purging process allows you to manage the size of the Monitoring database by configuring the following options:
•
When a purge operation triggers, if the actual used database disk space is greater than the configured threshold, the purge operation removes all data from the Monitoring database tables prior to the data retention window (as specified in the Maximum Stored data period field described below).
•
Note
•
Conditions and Rules for Monitoring database Purging
•
Purging is always based on the database consumed disk space percentage. Only when the used database space is equal to or exceeds the user specified allowed percentage (by default 80%, which is user configurable), does the purging process begin purging the tables. Otherwise, the purging process is skipped.
•
•
A purge process runs, creating a status history report that you can view by going to Monitor > Reports > System > Data Management > Monitoring Node > Purging History. An information (INFO) alarm is generated when the purge completes.
Note
•
A purge process runs, creating a status history report that you can view by going to Monitor > Reports > System > Data Management > Monitoring Node > Purging History. An information (INFO) alarm is generated when the purge completes.
•
For example, if the primary node uses two repositories for backup and purging, you must specify the same repositories for the secondary node. For more information, see Configuring Repositories, page 14-3 and Backing Up and Restoring the Monitoring Database.
•
•
For this reason, it is recommended that you sync the dedicated Monitor ISE node with the Administration ISE node, after the Monitor ISE node restore is complete.
•
Purging Unwanted Data
Purging is based on the percentage of consumed disk space for the database. When the consumed disk space for the database is equal to or exceeds the threshold (default 80 percent), the purging process starts. Purging always checks the Monitoring database disk space limit before proceeding.
The maximum stored data period is based on 30-day months, not calendar months. For example, if the server date is April 16, 2011 and the maximum stored data period is set to 1 month, a purge triggered on April 16, 2011 retains data from March 17, 2011 through April 15, 2011.
The purging process triggers once a day at 4:00 AM (a non-configurable default). If disk space usage is met or over the specified limit, the purge executes and runs in the background. If the limit has not been reached, purging is skipped.
Warning
Prerequisite
Configure a data repository where data is backed up prior to purging. You can configure a data repository for a Monitoring ISE node using the repository command in the system command line interface (CLI). For more information on CLI commands, see the Cisco Identity Services Engine CLI Reference Guide, Release 1.0.
To configure data purging, complete the following steps:
Step 1
Step 2
Step 3
a.
b.
c.
Note
Step 4
Step 5
Next Steps
Proceed with one of the of the following tasks:
•
Scheduling Full and Incremental Backups
You can schedule full-backups to run automatically at a specified day and time. You need to perform a full database backup before you begin scheduling incremental backups. Incremental backups backup only the data that has changed since the last backup, allowing you to save time and disk space.
Prerequisite
Before you begin either procedure you should have successfully set purging options, as described in Configuring Data Purging.
Scheduling Full Backups
By default, scheduled monthly backups occur on last day of month, scheduled weekly backups occur last day of week, and scheduled daily backups occur at the time specified.
To configure a full database backup, complete the following steps:
Step 1
Step 2
Step 3
Step 4
a.
For information on how to specify a repository, see Configuring Repositories, page 14-3.
b.
c.
Step 5
Step 6
Step 7
•
•
–
–
•
Next Step
•
Scheduling Incremental Backups
Incremental backups save time and disk space, and allow you to configure the frequency and time backups occur. Incremental backups store data updates in a separate location, so it is important that you perform an initial full backup before starting incremental backups.
Note
Prerequisites
You should have successfully run a full backup of the Monitoring database, before you attempt to perform an incremental backup. For more information, see Scheduling Full Backups or Performing On-Demand Backups.
To schedule incremental backups, complete the following steps:
Step 1
Step 2
Step 3
Step 4
a.
For information on how to specify a repository, see Configuring Repositories, page 14-3.
b.
c.
Scheduled monthly backups occur on last day of month; scheduled weekly backups occur last day of week; and scheduled daily backups occur at the time specified.
Step 5
Step 6
Next Steps
Restore data from an incremental backup, start with the initial full backup and continue through the latest incremental backup. For more information on restoring data, see Restoring the Monitoring Database.
Performing On-Demand Backups
You can perform an immediate full backup of the Monitoring database at any time, as long as no other backup is already in progress. If another backup process is running, you must wait for it to complete before you can start an on-demand backup.
Note
Prerequisite
You should have configured data purging, as described in Purging Unwanted Data.
To generate a full backup immediately, complete the following steps:
Step 1
Step 2
Step 3
If no repository is specified, the data will be purged and no backup occurs. For information on how to specify a repository, see Configuring Repositories, page 14-3.
Step 4
Step 5
Next Step
•
Restoring the Monitoring Database
You can restore data from an incremental or full backup using the Data Restore feature. If you choose to restore incremental backup data, the full data backup is restored first, followed by all subsequent incremental backups in sequential order.
The process for restoring the Monitoring database is different depending on the type of deployment. The following sections explain how to restore the Monitoring database in a standalone deployment and distributed deployments.
Standalone Deployment Restore
In a standalone deployment where Administration and Monitoring personas are both running on the Cisco ISE node, restoring a Monitoring database backup also restores the Administration database. For more information, see Restoring a Monitor backup in a Standalone Environment.
Distributed Deployment Restore
There are two possible scenarios for restoring a Monitoring backup:
•
•
For more information, see Restoring a Monitor Backup in a Distributed Environment.
Warning
Restoring a Monitor backup in a Standalone Environment
Use the following procedure to restore the Monitoring database to a standalone node.
Prerequisites
You should have successfully performed the following procedures:
•
To restore incremental and full backup data, complete the following steps:
Step 1
Step 2
Step 3
If an incremental backup file is selected, all previous incremental backups are shown, along with the initial full backup.
Step 4
Restoring a Monitor Backup in a Distributed Environment
Use the procedures outlined in this section to restore a Monitor backup in a distributed environment.
Prerequisites
You should have successfully performed the following procedures:
•
To restore a Monitor backup to a Cisco ISE node with Administration and Monitor personas:
Step 1
This ensures that the configuration of the Cisco ISE node you are going to promote is up to date
Step 2
Step 3
Note
Step 4
Step 5
Step 6
Step 7
To restore a Monitor backup to a Cisco ISE node with only a Monitor persona:
Step 1
Note
Step 2
Note
Step 3
Step 4
Step 5
Viewing Log Collections
Monitoring functions collects log and configuration data, stores the data, and then processes the collected data to generate reports and alarms. You can view the details of the logs that are collected from any of the servers in your deployment. For more information, see Chapter 13, "Logging."
Specifying Email Settings
For use with monitoring log messages, you can specify the email server email address and the name that is displayed for this address. For more information, see Configuring Email Settings, page 8-3.
Note
Configuring System Alarm Settings
System alarms notify you of critical conditions that are encountered. System alarms are standard and cannot be created or deleted. You can enable and disable system alarms, and you can configure how you receive notification. You can choose to send alarm notifications through email and as syslog messages.
For instructions on how to set system alarms, see Configuring System Alarm Settings, page 8-4.
Note
For more information:
See System Alarm Settings, page A-61 of Appendix A, "User Interface Reference."
Configuring Alarm Syslog Targets
If you configure monitoring functions to send system alarm notifications as syslog messages, you need a syslog target to receive the notification. Alarm syslog targets are the destinations where alarm syslog messages are sent.
You must also have a system that is configured as a syslog server to be able to receive syslog messages. You can create, edit, and delete alarm syslog targets. For more information, see Configuring Alarm Syslog Targets, page 8-5.
Warning
For more information:
See Alarm Syslog Targets, page A-60 of Appendix A, "User Interface Reference."