

You can find support for Cisco Security products through the Cisco support hub, which provides product-specific resources, documentation, downloads, and expert assistance.
Security that only Cisco can deliver
Platform approach
AI-native fabric unifying identity, network, cloud, and endpoint protection.
Converged networking and security
Security everywhere your network reaches. Policy, inspection, and enforcement at every connection.
Data fabric and advanced management
Unified data for earlier detection and faster response, powered by AI-driven context.

What’s new in Cisco Security
Protect the world from agents
Deploy a distributed, optimized enforcement with unified management across data center, cloud, campus, and IoT environments.
Protect agents from the world
Safeguard the agentic workforce against malicious attacks and data leakage.
Protect your enterprise with agentic security
Detect and respond at machine speed to stay ahead of advanced adversaries.
What you can do with Cisco Security
Zero Trust Access from Cisco
Unleash the power of network and security convergence for zero trust that goes wherever business takes you.
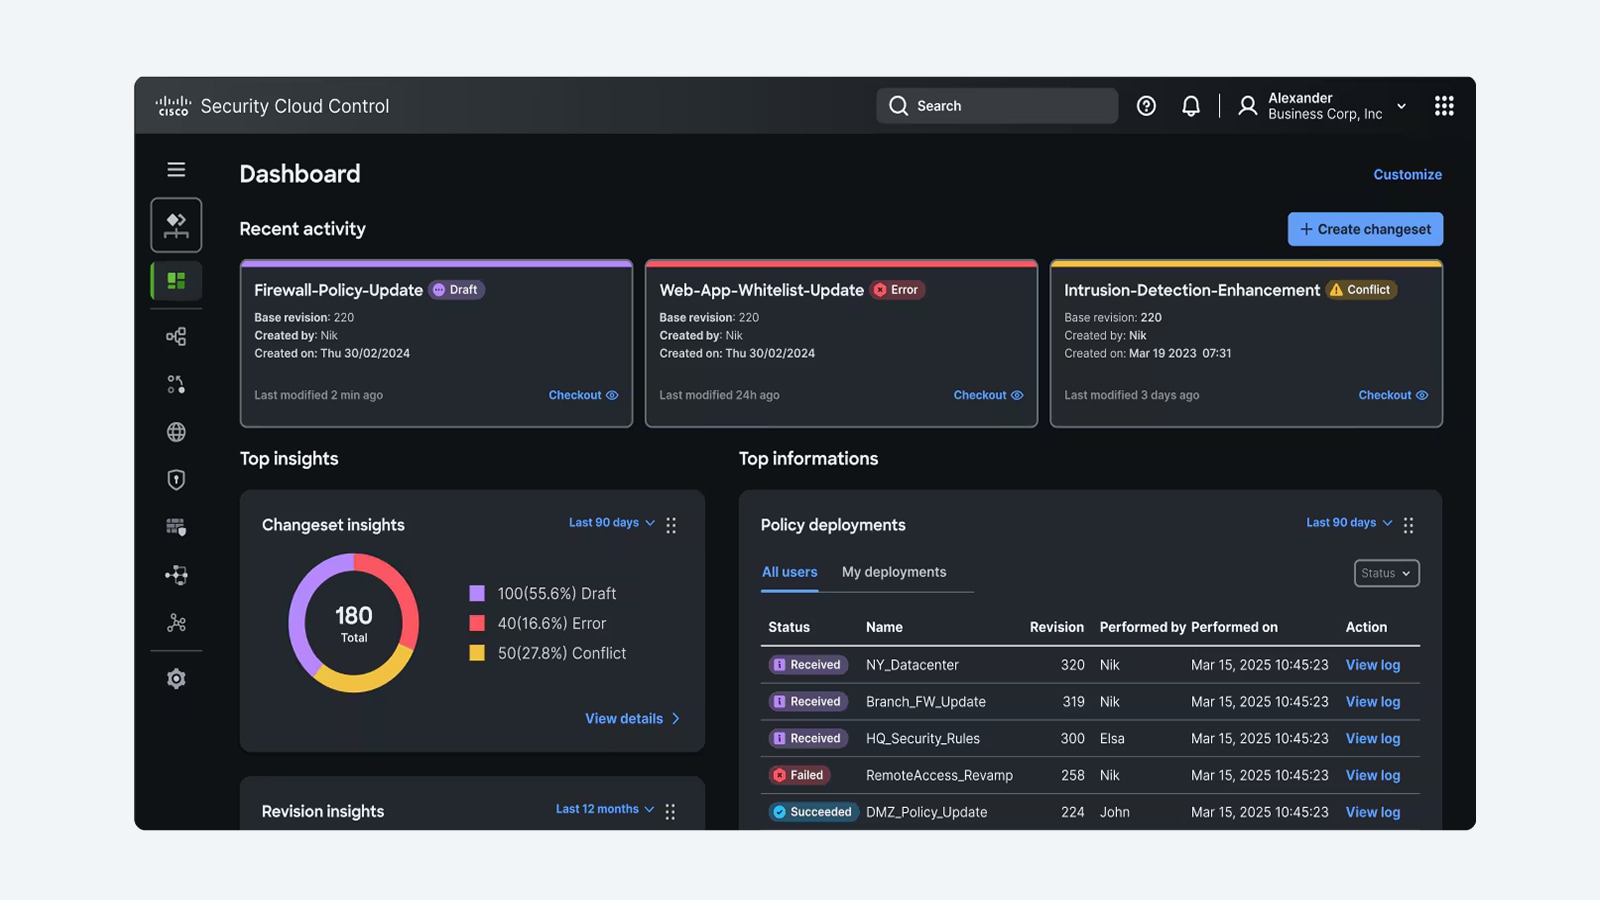
Hybrid Mesh Firewall
Apply distributed, optimized enforcement with unified management across your hybrid enterprise.
Agentic SOC
Unify the data fabric, analytics, tooling and AI—to automate the mundane, clarify the complex, and proactively mitigate risk.
Zero trust for agentic AI
Integrate identity, access, and behavioral controls to govern your agentic AI workforce and reduce risk.

Cloud protection
Secure modern cloud and AI apps at runtime: segmentation that keeps up with change, vulnerability shielding to close the patching gap, and protection for AI workloads where they actually run.
Cisco Secure Firewall
Find malicious flows in encrypted traffic and intelligently decrypt without sacrificing performance with Cisco Encrypted Visibility Engine (EVE). Stop zero days leveraging Snort ML and Talos Threat Intelligence.
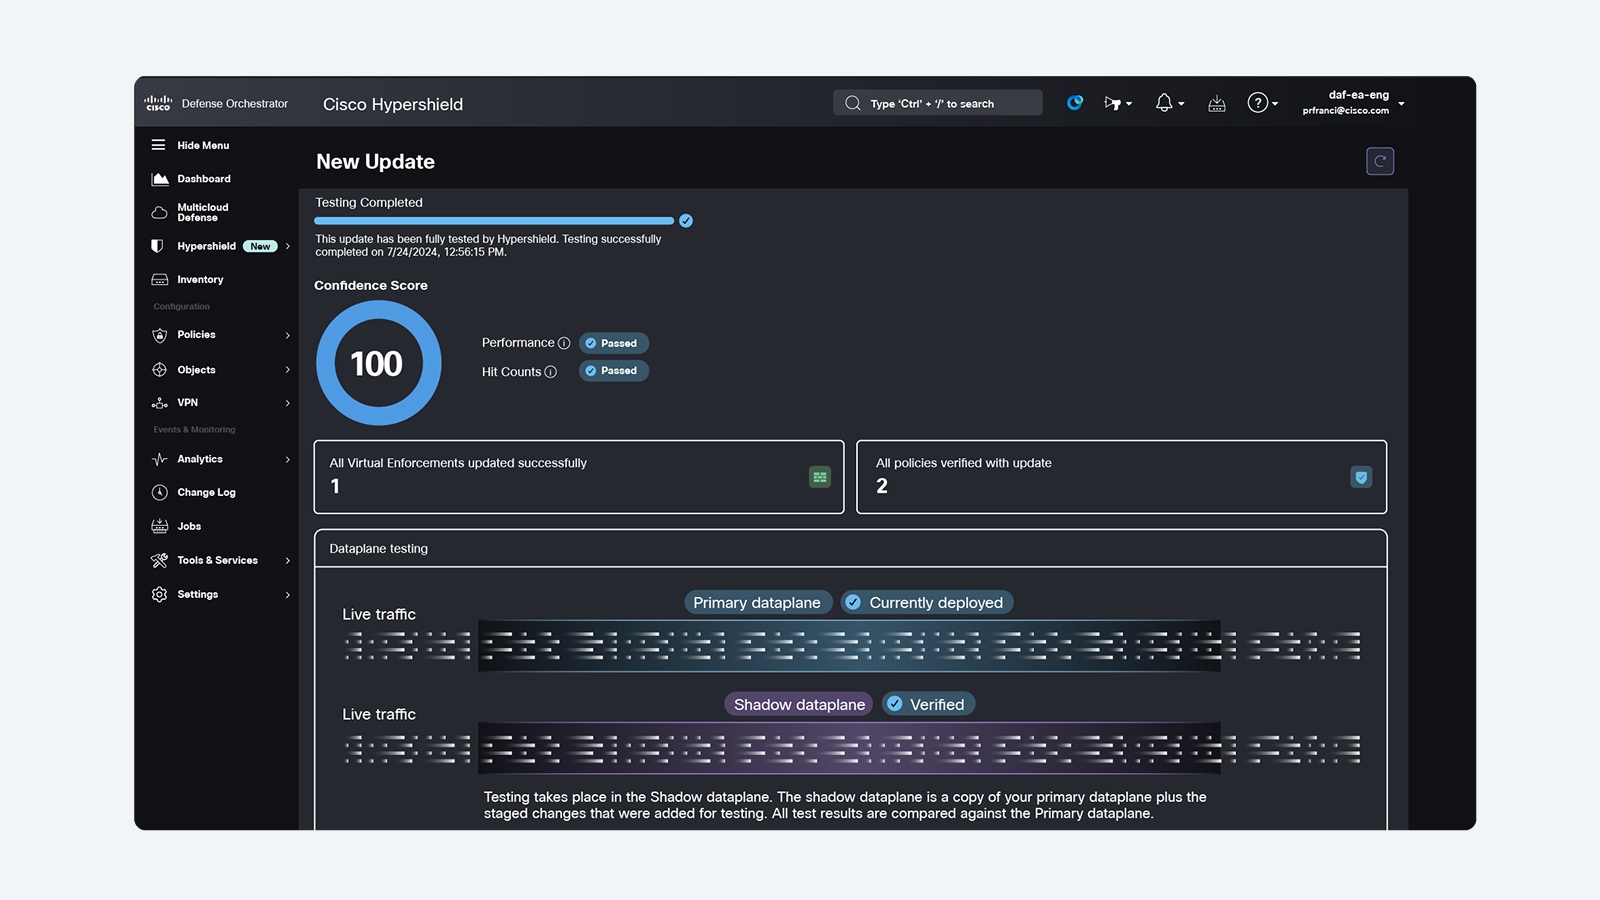
Cisco Hypershield
Close exploit gaps, segment everywhere, and self-qualify updates and changes with security architecture designed to defend modern, AI-scale data centers.
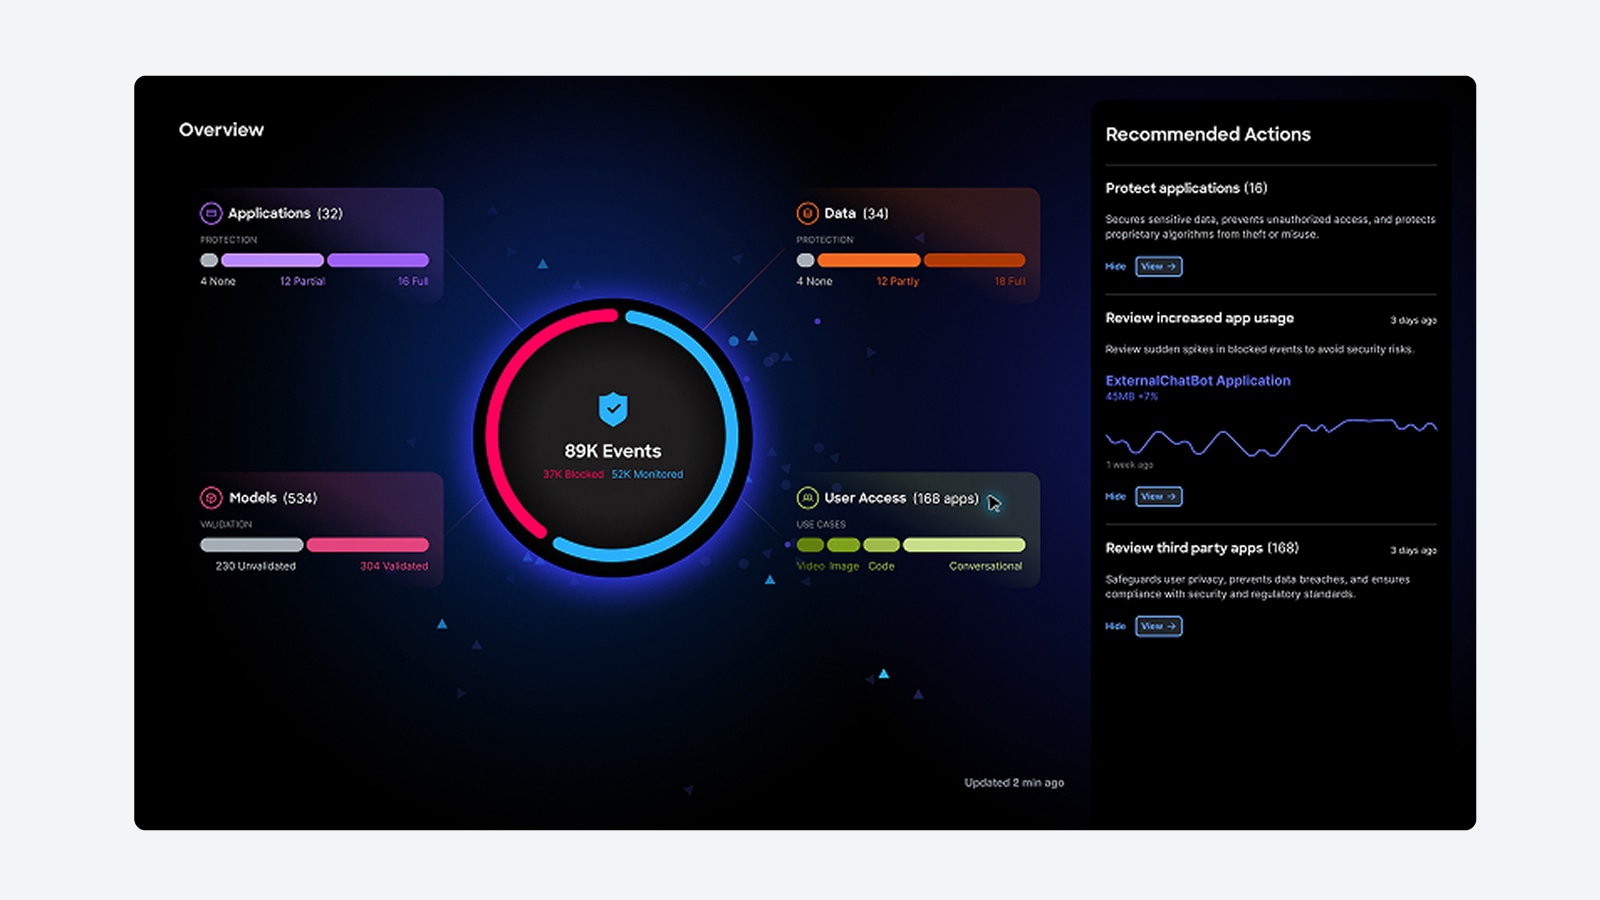
Cisco AI Defense
Safeguard the development and usage of AI applications so your enterprise can advance its AI initiatives with confidence.
Workforce protection
Secure access for humans, things, and agents with one consistent policy model, and extend controls to new patterns like workforce AI usage and agent-to-tool actions without bolting on separate gateways.
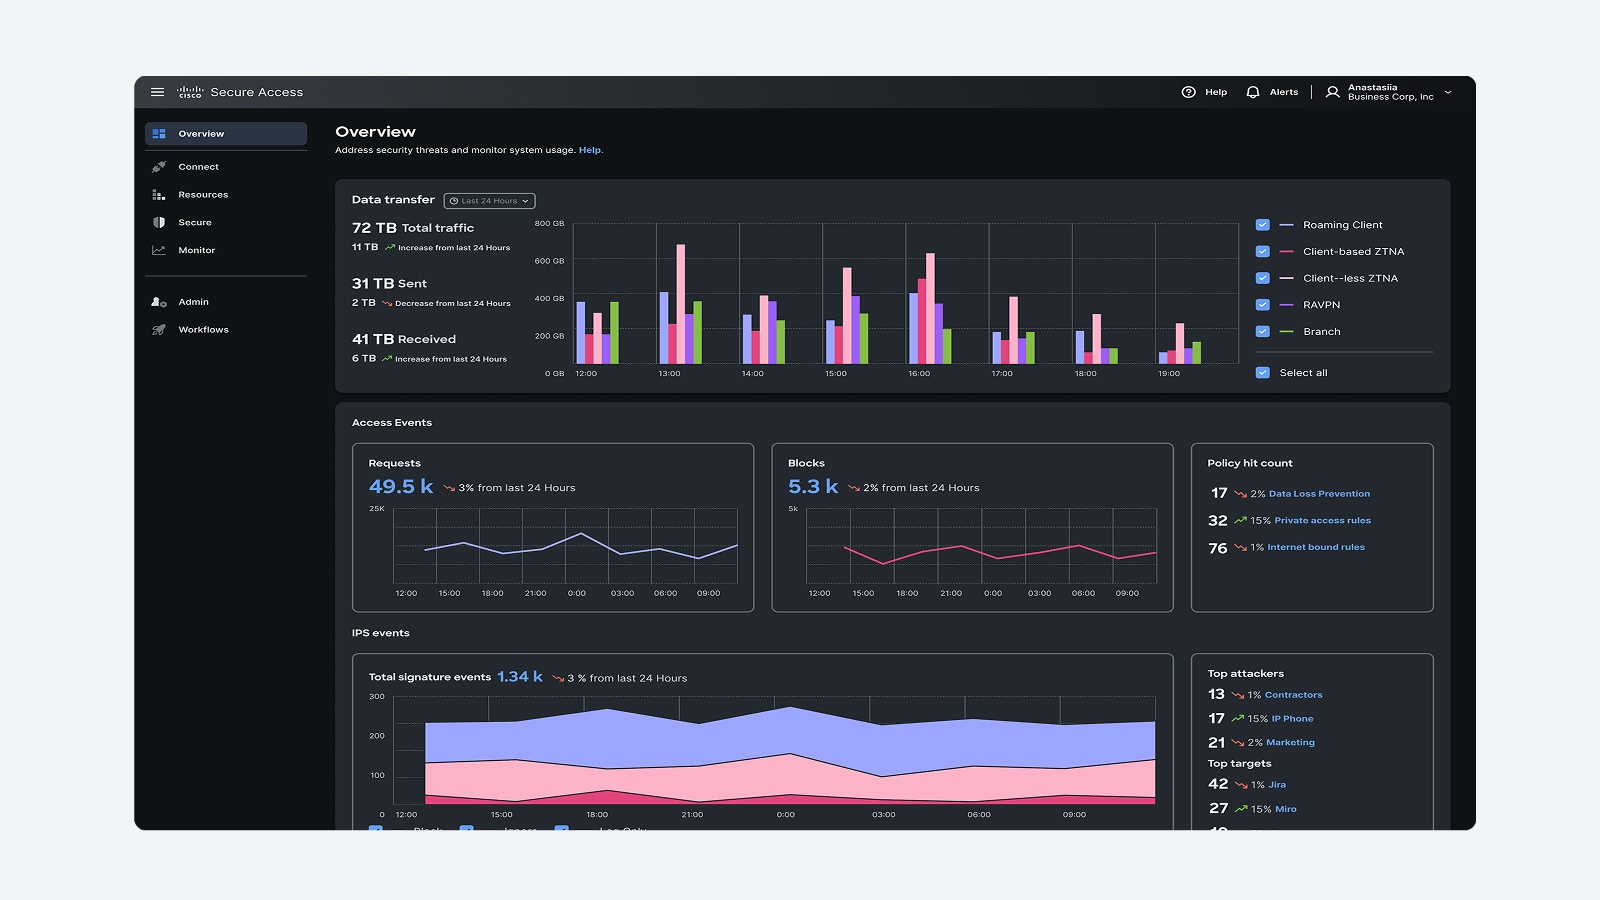
Cisco Secure Access
Accelerate zero trust adoption with cloud-native security service edge (SSE), including digital experience monitoring, built on a modern, highly performant architecture.
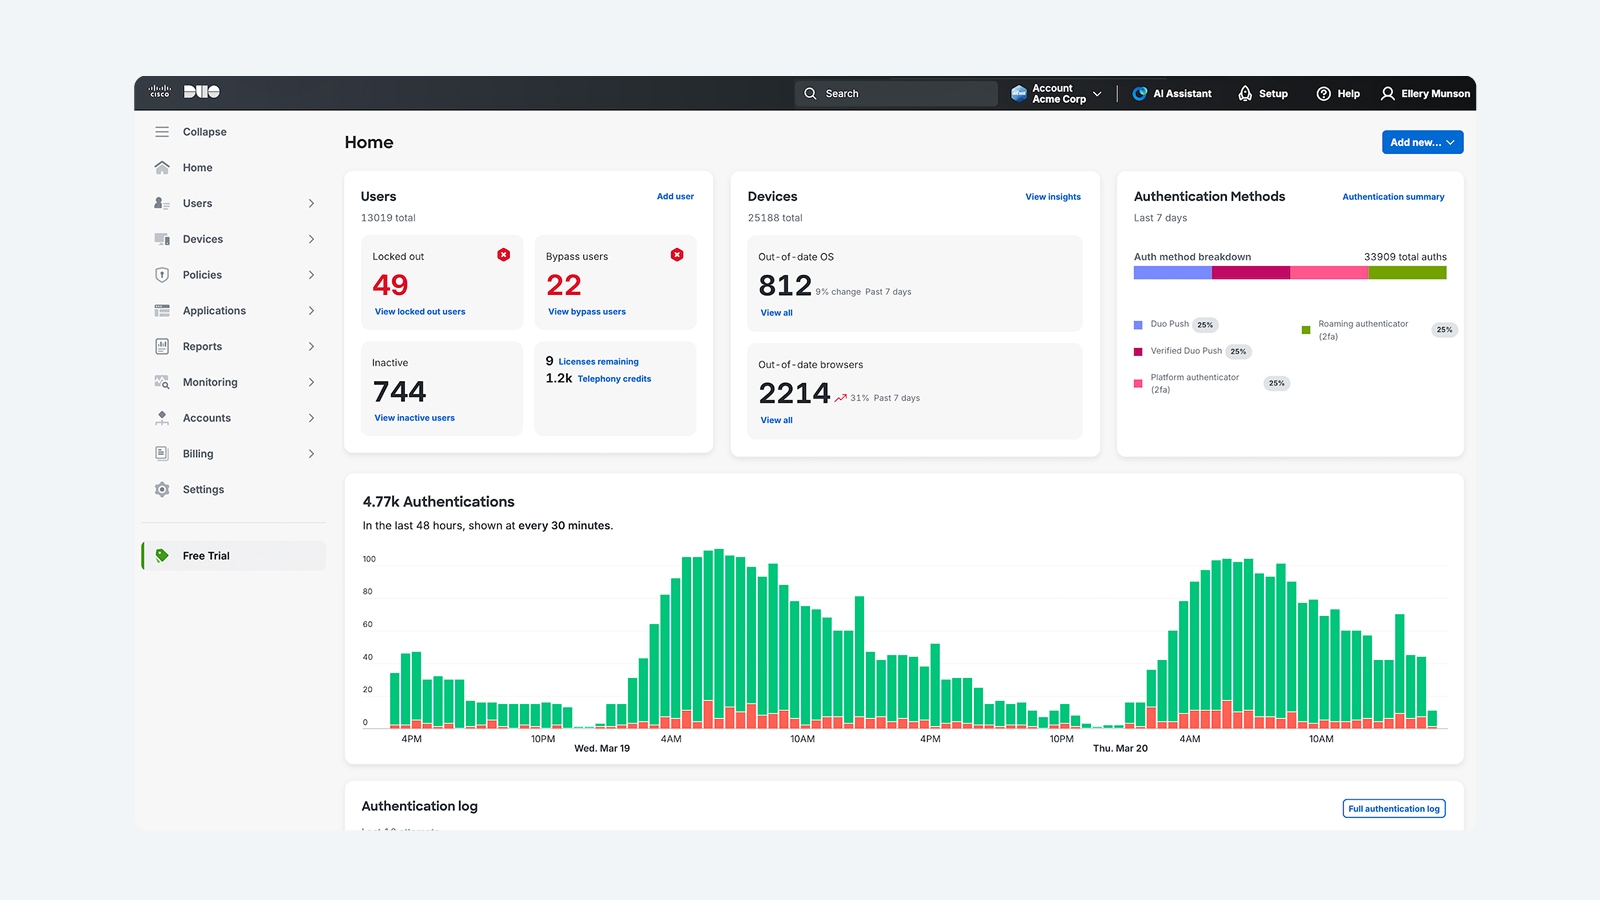
Cisco Duo
Strong identity security for your workforce helps you see across your entire identity ecosystem, bridging the gap between trust and access.
Cisco Secure Access Service Edge (SASE)
Unify networking and security with single-vendor SASE, helping to ensure resilient and secure access for your global workforce.
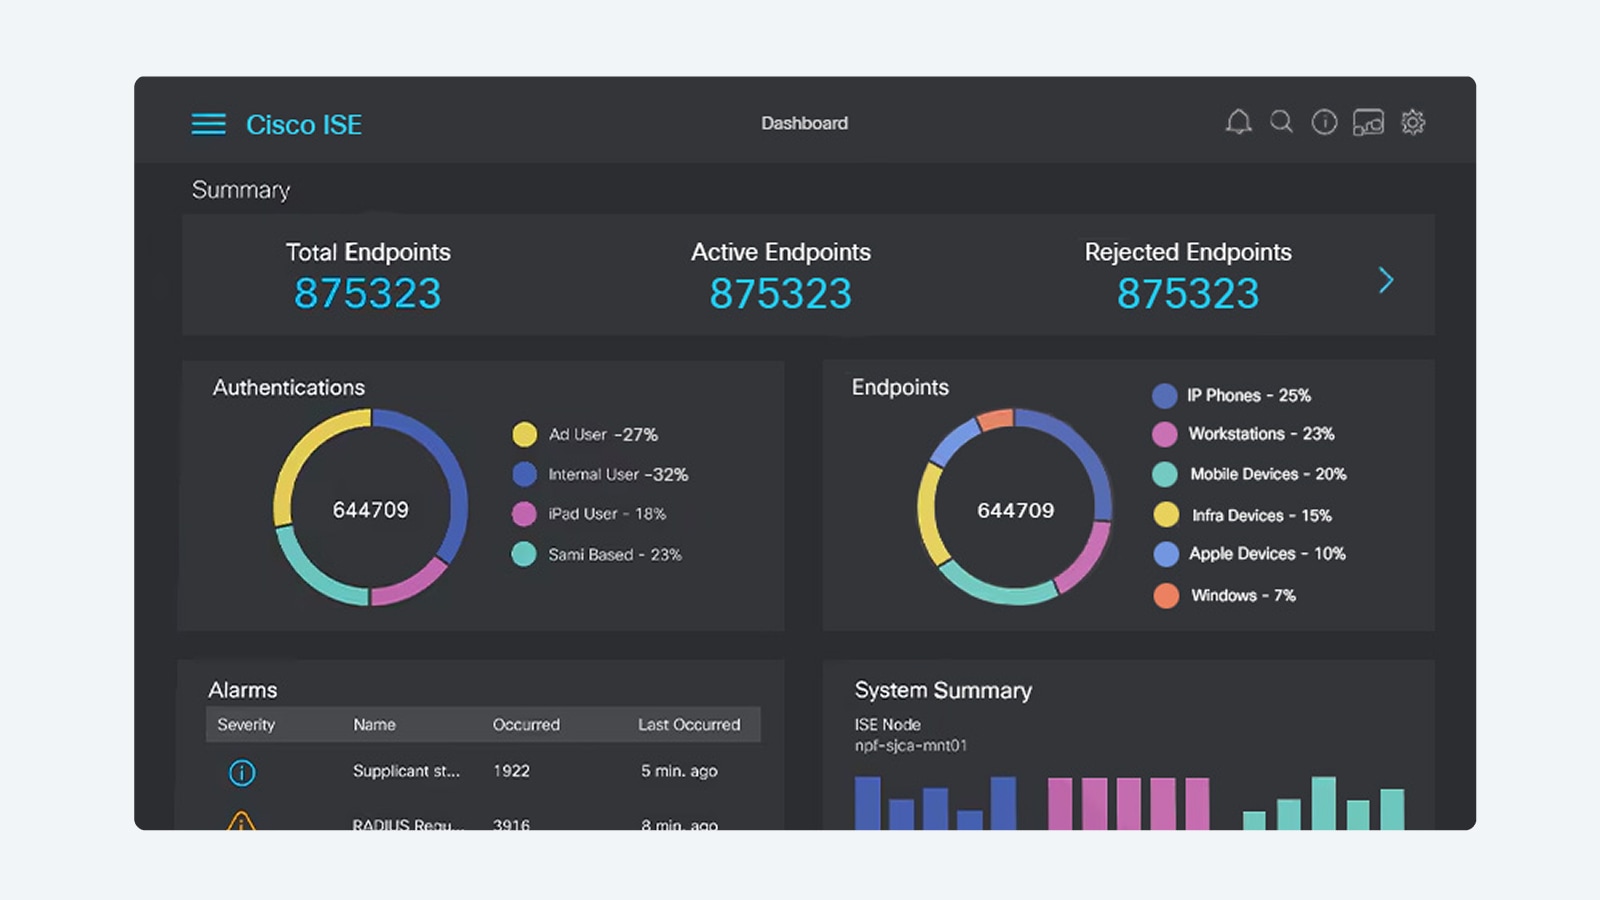
Cisco Identity Services Engine (ISE)
Employ intel from across your stack to enforce policy, manage endpoints, and deliver trusted access. Multicloud NAC with zero trust makes it possible.
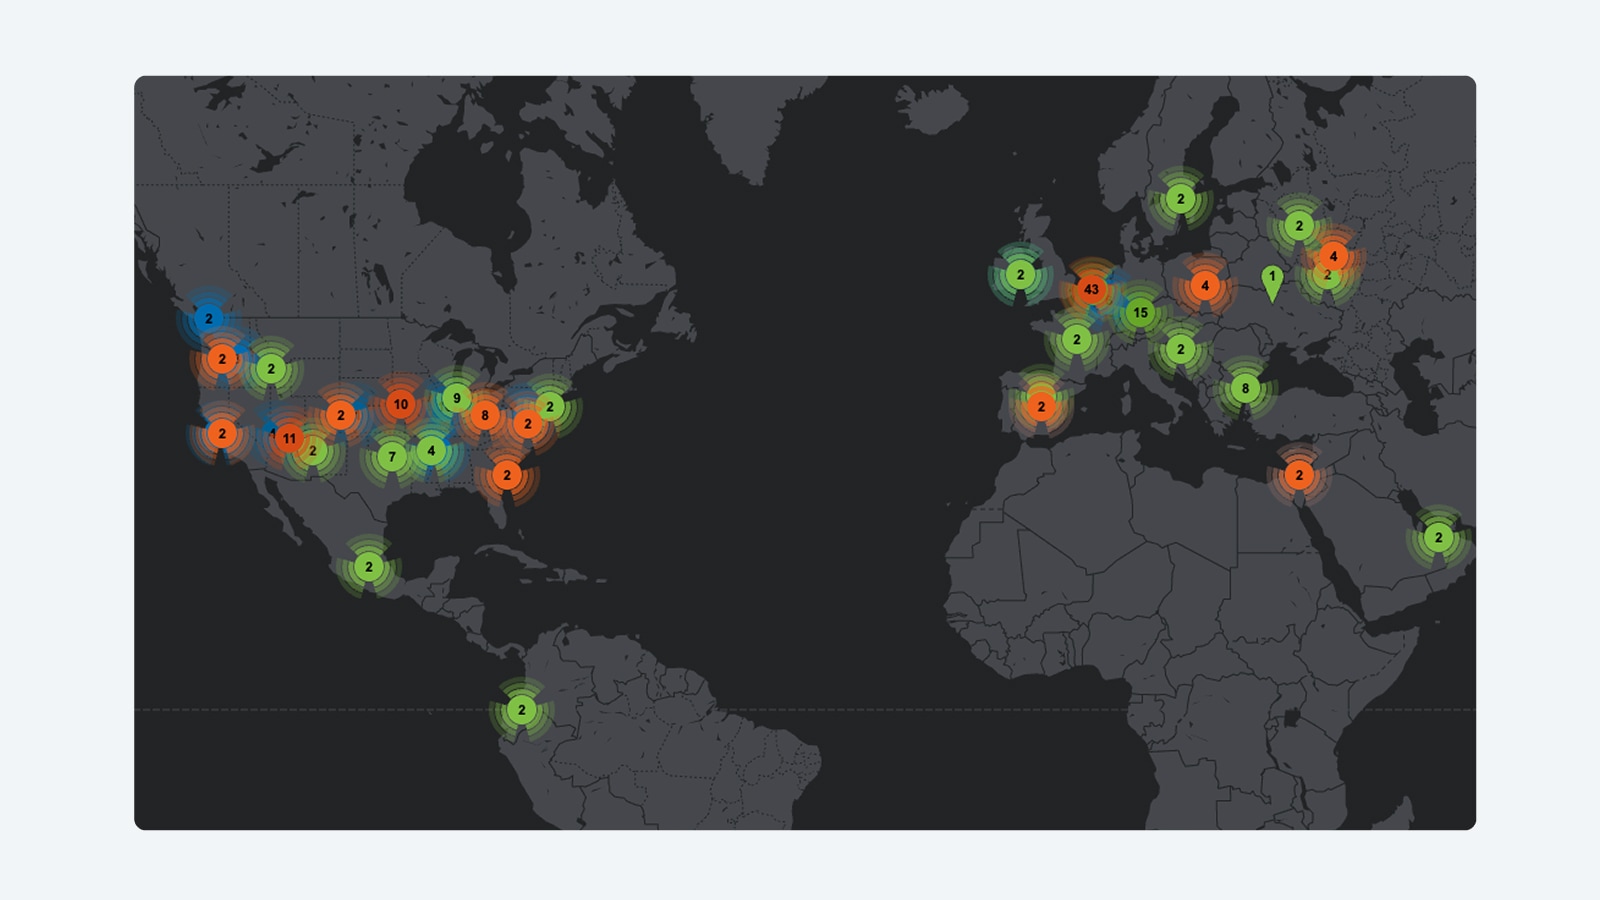
Threat intelligence and response
Detect, investigate, and respond faster with unified intelligence and operations—giving your team continuous visibility across users, systems, and AI agents in a single platform.
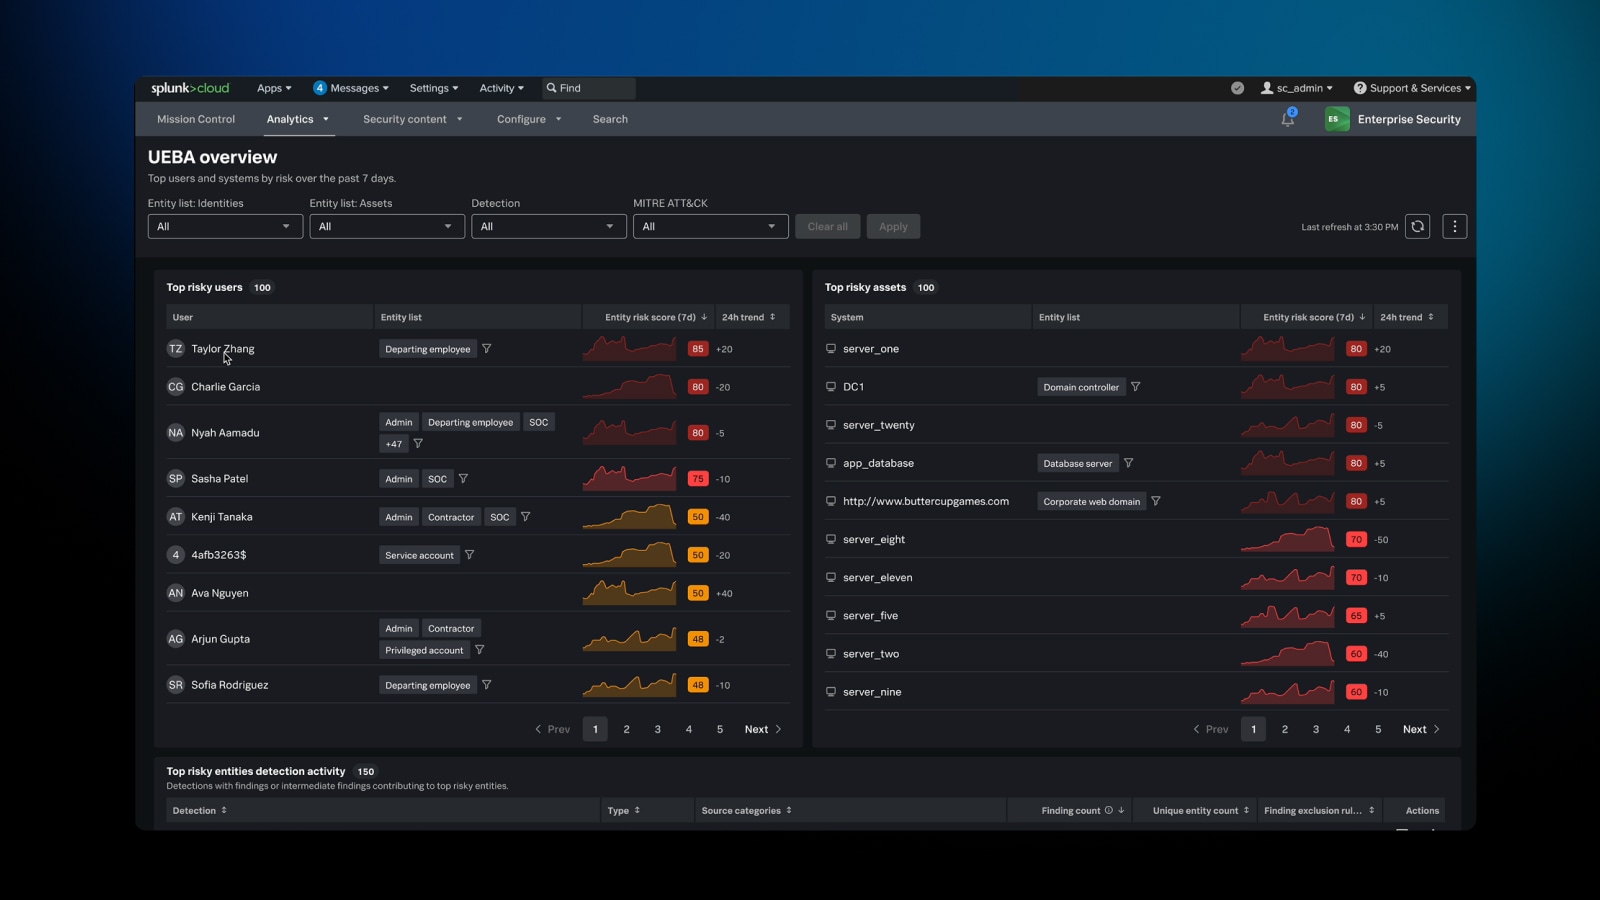
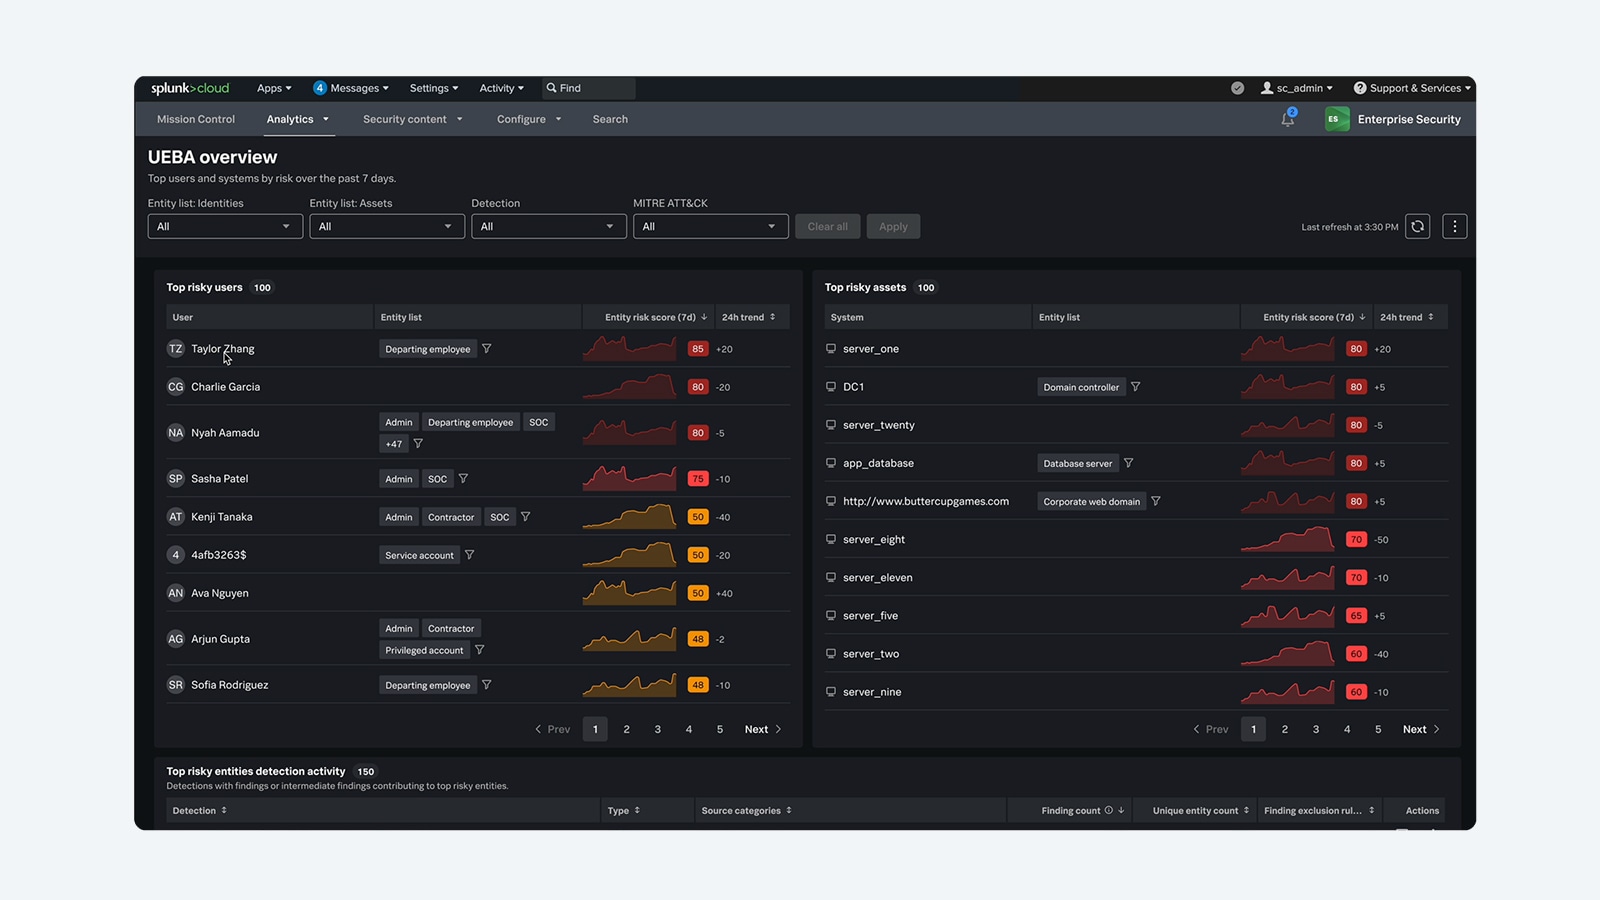
Splunk Enterprise Security
Detect and respond at machine speed to stay ahead of advanced adversaries.
Cisco Talos
World-class threat intelligence and insights.
Resources
Trials and offers
Build a future-ready security platform with Cisco trials and offers.
Webinars
Register for upcoming webinars and demos or explore our catalog of on-demand Cisco Security webinars.
Third-party validation
Explore our collection of third-party testing, analyst reports, and peer reviews and insights that highlight Cisco products as market leaders.
Resources
See a full list of security resources, reports, trainings, and certifications.
FAQs
The Cisco Community is a hub where you can connect with peers and Cisco specialists to ask for help, share experiences, and build your professional network. The hub includes an area devoted to Security products.
Cisco Services provide expert guidance to help you plan, design, implement, operate, and optimize your IT environment as well as AI-powered and expert-backed support to enable proactive and predictive IT operations.
Cisco offers learning options for a wide range of levels and learning styles. Cisco Networking Academy provides beginner-friendly content and offers online and in-person options. Cisco U. provides product, certification, and skills- training options online for all levels, from associate to expert. The Cisco Learning Partners program provides online and in-person instructor-led training for enterprises and individuals.
Cisco offers key cybersecurity certifications, including the entry-level Cisco Certified Support Technician (CCST Cybersecurity), the associate-level Cisco Certified Network Associate (CCNA Cybersecurity), and the professional-level Cisco Certified Network Professional Cybersecurity (CCNP Cybersecurity). These certifications validate skills in security fundamentals, threat detection, incident response, and security automation. For more details and training resources, visit the Cisco Cybersecurity certifications.
The Cisco Security portfolio is a comprehensive suite of integrated security solutions designed to protect businesses across every layer of their environment—from the network and cloud to endpoints and applications. Through a unified, AI-driven platform, Cisco combines industry-leading technologies, including Splunk, to deliver pervasive security with unified policy and visibility, advanced threat detection, and automated response capabilities. This helps organizations of all sizes stay secure and resilient while simplifying security management and improving operational efficiency.
Cisco Security helps organizations meet stringent regulatory requirements with advanced audit trails, user activity monitoring, and data storage options. With unified visibility across the entire environment, security teams can quickly demonstrate compliance, strong governance, and accountability to executives, boards, and regulators.
Explore the Cisco end-of-sale and end-of-life products page for the full list of products we no longer sell. You can also seek feedback from the Cisco community about end-of-life topics and options for what to do next.