Table Of Contents
Using the Traffic Capture Toolset
Opening the Traffic Capture Toolset
Using the Traffic Capture Tool Bar
Hiding or Showing the Traffic Capture Tool Bar
Configuring Traffic Capture Filters
Configuring Advanced IP Filters
Configuring TCP Advanced Filters
Configuring Advanced UDP Filters
Configuring Advanced Novell Netware IPX Filters
Configuring Advanced SNA Filters
Configuring an Advanced SNA Filter Based on FID Type
Configuring a FID2 Transmission Header Filter
Configuring an FID3 Transmission Header Filter
Configuring an FID4 Transmission Header Filter
Configuring an FIDF Transmission Header Filter
Configuring Advanced Filters for Other Protocols
Decoding and Displaying Captured Traffic
Setting the Traffic Capture Decode Options
Saving and Retrieving Packet Traces
Traffic Capture
Use the Traffic Capture Toolset to capture and analyze packet traces on a targeted access line. You configure the appropriate ASE to capture traffic important to your monitoring efforts. The ASE captures this traffic to its buffer until a specified stop time or when a stop is triggered. At your request, the ASE forwards the captured traffic to the PAC for decoding. Decoded traffic appears in the Traffic Capture window.
Note
Throughout the Cisco WAPMS documentation, the term ASE refers to Cisco routers running SAA-ATM/FR and/or Visual Networks ASE probes.
Topics in this chapter include:
•
•
•
•
•
•
Using the Traffic Capture Toolset
This section describes the Traffic Capture interface.
Opening the Traffic Capture Toolset
Step 1
(See the "Connecting to a Domain" section.)
Step 2
(See the "Using the Network Selector" section.)
Step 3
When Traffic Capture is unavailable, either you have not selected a network element or your user ID does not have permission to perform traffic capture. Contact your PAM administrator.
Figure 7-1 Traffic Capture Window - Frame Relay and HDLC Example
The Traffic Capture window displays, from top to bottom, the Traffic Capture Tool bar, the Summary Decode pane, the Details Decode pane, and the Network Selector pane. All but the Network Selector pane are blank until you configure for traffic capture and then decode and display the captured traffic. (See the "Configuring Traffic Capture" section and the "Decoding and Displaying Captured Traffic" section.)
Using the Traffic Capture Tool Bar
The Traffic Capture Tool bar appears at the top of the window, as shown in Figure 7-2 for Frame Relay and HDLC networks and Figure 7-3 for ATM networks.
Figure 7-2 Traffic Capture Tool Bar - Frame Relay and HDLC
Figure 7-3 Traffic Capture Tool Bar - ATM
Table 7-1 describes the Traffic Capture Tool bar components.
Hiding or Showing the Traffic Capture Tool Bar
From the Traffic Capture Toolset, choose View > Traffic Capture Toolbar.
Configuring Traffic Capture
You can create up to eight filters to define what network traffic is captured by the ASE, when capture starts, and when capture stops.
The ASE retains the last traffic capture configuration saved to it. It captures traffic based on that configuration until you save a different configuration in the ASE. The amount of ASE memory (RAM) determines the maximum amount of traffic the ASE can capture and decode. All Frame Relay and HDLC ASE models truncate captured frames exceeding the maximum octets per frame. For detailed information on supported ASEs, see Table D-2.
To determine an ASE's RAM, you can also use the ID command from the ASE's administrative interface.
Step 1
See the "Using the Network Selector" section.
Step 2
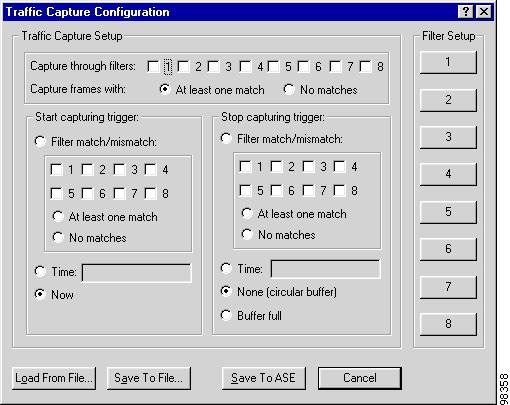
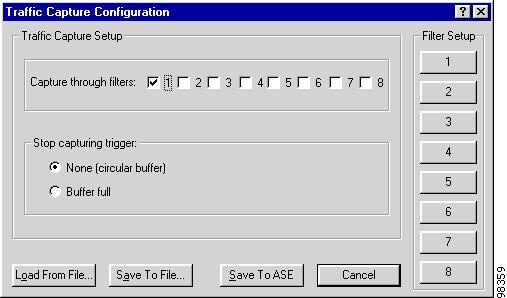
The Traffic Capture Configuration window appears. Window options vary by the network link layer. See Figure 7-4 for Frame Relay and HDLC. See Figure 7-5 for ATM.
Figure 7-4 Frame Relay and HDLC Traffic Capture Window
Figure 7-5 ATM Traffic Capture Window
The Traffic Capture Configuration window settings and those in all configuration windows opened from it reflect the most recent traffic capture configuration saved to the ASE.
Step 3
Table 7-2 describes the options.
Step 4
The Traffic Capture window appears and the ASE begins capturing packets using any filtering criteria you saved to it. On the Traffic Capture Tool bar, Frames/Cells Captured increments while capturing is in progress, and the State is set to On.
Table 7-2 Traffic Capture Configuration Window Options
Capture through filters
Identify the filters (configured in the Filter Setup pane) through which traffic is captured.
Capture frames with1
(Frame Relay or HDLC only) Identify how frames are captured:
At least one match—frames are captured that match at least one of the selected filters.
No matches—frames are captured that do not match any of the selected filters.
Start capturing trigger2
(Frame Relay or HDLC only) Determine when traffic capture starts:
Filter match/mismatch—start traffic capture when there is at least one match or no matches (depending on the option you choose) to the checked filter numbers.
Time—to start traffic capture at a specific time, enter the date and time in the following format: MM/DD/YY HH/MM/SS AM or PM. For example:
1/17/03 11:00:00 AM.Now—start traffic capture immediately.
Stop capturing trigger
Determine when traffic capture stops. Options vary by network type:
(Frame Relay or HDLC only)
Filter match/mismatch—stop traffic capture when there is at least one match or no matches (depending on the option you choose) to the checked filter numbers.
Time—to stop traffic capture at a specific time, enter the date and time in the following format: MM/DD/YY HH/MM/SS AM or PM. For example:
1/17/03 11:00:00 AM.(All network types)
None—allow traffic capture to continue indefinitely with a circular buffer, deleting the oldest frames when the buffer is full.
Buffer full—stop traffic capture when the ASE's capture buffer is full.
Load from File
Load a previously saved traffic capture configuration from a file.
Save to File
Save a traffic capture configuration to a file for future use.
Save to ASE
Forward the current traffic capture configuration to the ASE and begins the capture process.
Filter Setup
Configure up to eight traffic filters. (For information on configuring filters, see the "Configuring Traffic Capture Filters" section.)
1 This option group is unavailable for ATM networks. By default, the setting in effect is At least one match.
2 This option group is unavailable for ATM networks. By default, the setting in effect is Now.
Configuring Traffic Capture Filters
You can create up to eight filters that define what network traffic the ASE captures. You can filter traffic based on combinations of the criteria listed in Table 7-3.
When defining filters based on upper layer protocol, only those protocols configured in the ASE through the Network Configuration Toolset (or the PAM Templates tool) are available.
Note
Configuring a Filter
Step 1
The Traffic Filter Setup window appears. This window varies by network type and link layer. Figure 7-6 shows Frame Relay; HDLC and ATM windows vary.
Figure 7-6 Frame Relay Traffic Filter Setup Window
Step 2
Options are defined in Table 7-4.
Table 7-4 Traffic Filter Setup Window Options
Upper Layer Protocol1
Filter frames that contain a specific upper layer protocol. Only the IP, IPX, SNA, AppleTalk, VINES, and DECnet are available.
Advanced Filter Setup*
(Frame Relay and HDLC) Configure and use advanced filtering options. (For more information, see the "Configuring Advanced Filters" section.)
Line Side
Filter traffic traveling to the network, from the network, or without regard to direction.
Frame Status
(Frame Relay and HDLC) Filter frames based on either FCS/Align Errored, Too Long, Too Short, or Aborted.
Header Bits
(Frame Relay) Filter frames based on how FECN, BECN, DE, or C/R bits are set in the header field.
DLCI
(Frame Relay) Filter on a specific DLCI number, on every DLCI number except a specific one, or on all DLCI numbers when Don't Care is selected.
VC
(ATM) Filters on a specific VPI/VCI number, or on all VPI/VCI numbers when Don't Care is selected.
1 Available for ASEs and partner devices equipped with upper layer protocol capability.
Configuring Advanced Filters
Use advanced filtering options to configure filters based on specific bit sequences in the link layer frame information field. To filter on a network address or protocol identifier, for example, you must configure an advanced filter. You can configure filters based on IP, IPX, SNA, AppleTalk, Banyan VINES, and DECnet IV protocols. For IP Transport ASEs, the IP Classification Attributes pane appears, as shown in Figure 7-7, in which you can choose the IP class of service to filter on. See Table 7-5 for details.
Note
The Advanced Filter windows include three-way toggle buttons that allow you to set masks for data elements:
•
•
•
Figure 7-7 Advanced Filter Window - IP Transport ASE Selected Example
Configuring Advanced IP Filters
The IP Advanced Filter Setup window provides a graphical representation of the information field for IP packets, thereby freeing you from having to manipulate data at the bit level.
Step 1
Step 2
Step 3
Step 4
Step 5
Table 7-5 IP Advanced Filter Setup Window Options
IP Class of Service
(IP Transport ASEs only) with classes of service assigned, choose a defined class from the menu. Leave the default, Any, when you do not want to filter on a specific class.
Source Address
IP address that originates a packet. When Bit-level edit is selected, use binary form; otherwise, use dotted-decimal notation. Use an asterisk (*) in place of a decimal or binary number to match a wildcard value.
Destination Address
IP address that is the destination of a packet. When Bit-level edit is selected, use binary form; otherwise, use dotted-decimal notation. Use an asterisk (*) in place of a decimal or binary number to match a wildcard value.
Protocol
Configure a filter based on the protocols TCP, UDP, EGP, ICMP, IGMP, or OSPF.
Time to Live
Number of router hops an IP packet can make before it is discarded.
Type of Service
Treatment of the data unit in its transmission through component networks. Enter the binary value on bit or bits to filter on. Enter an asterisk (*) for Don't Care.
More Fragment Bit
Specify whether the More flag, used for fragmentation (segmentation) and reassembly, is set.
Do Not Fragment Bit
Specify whether the Do Not Fragment bit, which disallows fragmentation, is set.
Fragment Offset
Specify where in the datagram the Fragment Offset belongs; measured in 64-bit units.
TCP Filter
Available when you configure a filter based on the TCP protocol. See the "Configuring TCP Advanced Filters".
UDP Filter
Available when you configure a filter based on the UDP protocol. See the "Configuring TCP Advanced Filters" section, below.
Configuring TCP Advanced Filters
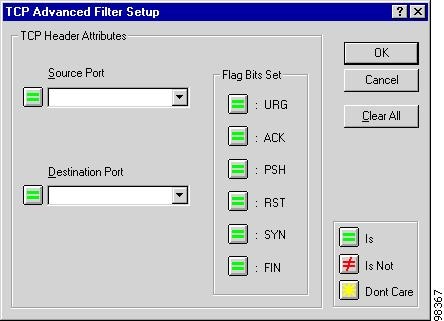
When configuring IP filters for TCP, you can customize your filter beyond what is described in Table 7-5.
Step 1
Step 2
The TCP Advanced Filter Setup window, as shown in Figure 7-8, appears.
Figure 7-8 TCP Advanced Filter Setup Window
Step 3
Below is a list of available protocols. To specify a protocol not on the list, type its decimal value.
Step 4
Choices are URG, ACK, PSH, RST, SYN, and FIN.
Step 5
Configuring Advanced UDP Filters
When configuring IP filters for user datagram protocols (UDP), you can customize your filter beyond those options described in Table 7-5.
Step 1
Step 2
The UDP Advanced Filter Setup window, shown in Figure 7-9, appears.
Figure 7-9 UDP Advanced Filter Setup Window
Step 3
See the "Configuring TCP Advanced Filters" section for a list of available protocols. To specify a protocol not on the list, type its decimal value.
Step 4
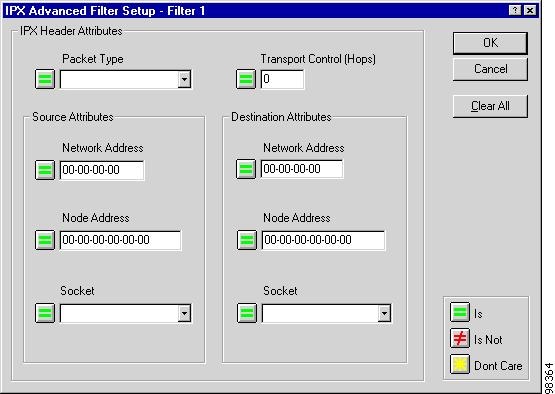
Configuring Advanced Novell Netware IPX Filters
Cisco WAPMS provides a graphical representation of the information field for IPX packets, so you do not have to manipulate data at the bit level.
Step 1
The Traffic Filter Setup window appears.
Step 2
Step 3
The IPX Advanced Filter Setup window, shown in Figure 7-10, appears.
Figure 7-10 IPX Advanced Filter Setup Window
Step 4
Step 5
Configuring Advanced SNA Filters
Cisco WAPMS provides a graphical representation of the information field for SNA packets, so you do not have to manipulate data at the bit level.
Step 1
The Traffic Filter Setup window appears.
Step 2
Step 3
The SNA Advanced Filter Setup window, shown in Figure 7-11, appears. See Table 7-7 for a description of available options.
Figure 7-11 SNA Advanced Filter Setup Window
Step 4
The button toggles to Is and all options in the window become enabled.
Step 5
Step 6
Table 7-7 SNA Advanced Filter Setup Window Options
FID Type
Format Identification (FID) SNA message. The layout of SNA packets varies according to FID type, therefore, you must select a FID type before making other filtering selections.
FID Filter button
Corresponds to the FID type selected. Table 7-8 describes the options available in the FID2 Filter window; Table 7-9 describes the options available in the FID3 Filter window; Table 7-9 describes available options in the FID4 Filter window; Table 7-10 describes available options in the FIDF Filter window.
Request/Response
Request/Response (Byte 0) header element used for transmission control and data flow control. Can be set to Response or Request.
Format Indicator
Request/Response (Byte 0) header element indicating which of two formats is used within the associated Request/Response Unit. Can be set to FM, NS Header Follows, or No FM Header.
Sense Data Indicator
Request/Response (Byte 0) header element indicating a 4-byte sense data field is included in the associated Request/Response Unit. Can be set to Sense Data Included or No Sense Data.
RU Category
Request/Response (Byte 0) header element identifying the categories to which a Request/ Response Unit belongs. Choices are: FM Data, Network Control, Data Flow Control, and Session Control.
Begin Chain Indicator
Request/Response (Byte 0) header element that determines when the Begin Chain Indicator is set to First in Chain or Not First in Chain.
End Chain Indicator
Request/Response (Byte 0) header element that determines when the End Chain Indicator is set to Last in Chain or Not Last in Chain.
Definite Response 1
Request/Response (Byte 1) header element that can be set to DR1I (definite response 1 indicator) or Not DR1I.
Definite Response 2
Request/Response (Byte 1) header element that can be set to DR2I (definite response 2 indicator) or Not DR2I.
Exception Response
Request/Response (Byte 1) header element that can be set to Exception or Normal.
Request Larger Window
Request/Response (Byte 1) header element that can be set to Requested or Not Requested.
Queued Response
Request/Response (Byte 1) header element that can be set to Enqueue in TC Queues or Bypasses TC Queues.
Pacing Indicator
Request/Response (Byte 1) header element that can be set to Pacing Request/Response or Not a Pacing/Request Response.
Begin Bracket
Request/Response (Byte 2) header element that can be set to BB (Begin Bracket) or Not BB.
End Bracket
Request/Response (Byte 2) header element that can be set to EB (End Bracket) or Not EB.
Change Direction
Request/Response (Byte 2) header element that can be set to Change Direction or Do Not Change.
Code Selection
Request/Response (Byte 2) header element that can be set to Code 0 or Code 1. One of two codes, ASCII or EBCDIC, can be used. Each code is assigned a number 0 or 1 at session activation.
Enciphered Data
Request/Response (Byte 2) header element that can be set to Enciphered or Not Enciphered; used for session-level cryptography.
Conditional End Bracket
Request/Response (Byte 2) header element that can be set to Conditional or Not Conditional.
Padded Data
Request/Response (Byte 2) header element that can be set to RU is Padded or RU is Not Padded; indicates whether the RU (Request/Response Unit) has been padded to the next integral multiple of 8 bytes in length.
Configuring an Advanced SNA Filter Based on FID Type
Step 1
The button toggles to Is and all window options become active.
Step 2
Step 3
The window displayed depends on the value of the FID Type selected.
Step 4
(See below sections for FID2, FID3, FID4, and FIDF transmission header filter configuration procedures.)
Step 5
Configuring a FID2 Transmission Header Filter
Step 1
The FID2 Filter Setup window, shown in Figure 7-12, appears.
Figure 7-12 FID2 Filter Setup Window
Step 2
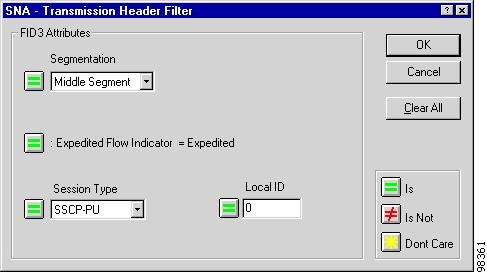
Configuring an FID3 Transmission Header Filter
Step 1
The FID3 Filter Setup window, shown in Figure 7-13, appears.
Figure 7-13 FID3 Filter Setup Window
Step 2
Configuring an FID4 Transmission Header Filter
Step 1
The FID4 Filter Setup window, shown in Figure 7-14, appears.
Figure 7-14 FID4 Filter Setup Window
Step 2
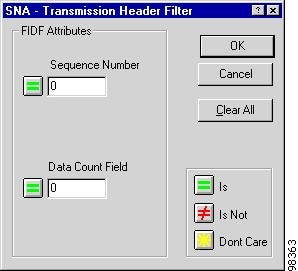
Configuring an FIDF Transmission Header Filter
Step 1
The FID2 Filter Setup window, shown in Figure 7-15, appears.
Figure 7-15 FIDF Filter Setup Window
Step 2
Table 7-11 FIDF Transmission Header Filter Window Options
Sequence Number
16-bit sequence number.
Data Count Field
16-bit field specifying the length of the data that follows.
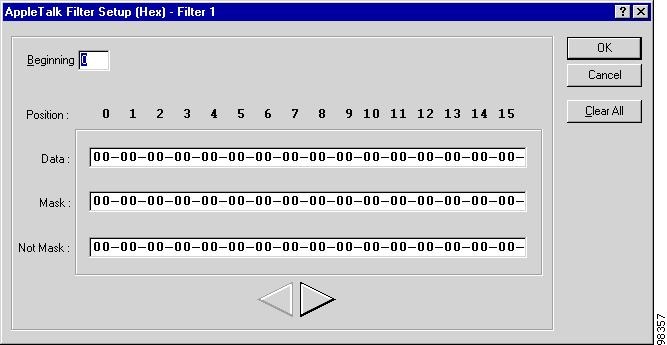
Configuring Advanced Filters for Other Protocols
Configuring advanced filters for AppleTalk, Banyan VINES, DECnet IV, or any unsupported protocol requires manipulating bit sequences directly. Therefore, to configure advanced filters for these protocols, you must know the layout of their respective information fields.
Step 1
Step 2
Step 3
The <Protocol_Type> Filter Setup Window, shown in Figure 7-16, appears.
Figure 7-16 <Protocol_Type> Filter Setup Window
Step 4
Decoding and Displaying Captured Traffic
After you create a traffic capture configuration and save it to your ASE, the ASE begins capturing traffic from the access line to which it is connected. You then decode and display the captured traffic, as shown in Figure 7-17.
Figure 7-17 ASE Traffic Capture Window
Step 1
(See the "Configuring Traffic Capture" section.)
Step 2
Step 3
The Traffic Capture window displays the captured traffic. Table 7-13 describes the elements appearing in this window.
Step 4
Click on any summary frame decode to view its detailed decoding below in the Decode pane.
Setting the Traffic Capture Decode Options
By default, Cisco WAPMS automatically selects the code set to use for displaying traffic capture data based on the decoded protocol. In most cases, you should leave the default setting. You can specify decode options while you are viewing traffic capture data.
Step 1
The Decode Options window, shown in Figure 7-18, appears.
Figure 7-18 Decode Options Window
Step 2
•
•
•
Step 3
Choose this option to display only data in hexadecimal format; this setting may be useful when you are capturing traffic on newer protocols the system does not recognize.
Step 4
Saving and Retrieving Packet Traces
You may want to save the results of a packet trace for future analysis. You can save the Cisco WAPMS decode of captured data either in a formatted text file or in a capture file for viewing, post-filtering, or printing.
Saving a Packet Trace
Step 1
See the "Decoding and Displaying Captured Traffic" section.
Step 2
The Save As window, shown in Figure 7-19, appears.
Figure 7-19 Save As Window
Step 3
•
•
•
Step 4
•
•
Step 5
Step 6
Retrieving a Packet Trace
Step 1
Step 2
The packet trace file appears in the Traffic Capture window.
Note
Post Filtering
Use post filtering to refilter captured data. It is a convenient way for you to analyze captured data to get several different views. You can perform upper-layer protocol post filtering on ATM-type partner devices equipped with upper layer link capability.
Post filtered packets can be printed or saved like any other collection of packets.
Refiltering Captured Data
Step 1
Step 2
Step 3
Figure 7-20 Post-Filter Configuration Window—Frame Relay and HDLC Circuits
Figure 7-21 Post-Filter Configuration Window—ATM Circuits
Step 4
Step 5
The Post-filtering window, shown in Figure 7-22, appears, showing the number of processed and matched frames/PDUs in the Traffic Capture window.
Figure 7-22 Post-Filtering Window
A Status bar and status message indicates the progress of the filtering.
Step 6
Table 7-14 Post-Filter Configuration Window Options
Display through filters
Identify which post-filters you configured in the Filter Setup pane the traffic post-filtering process will use.
Filter Setup
Configure up to eight post-filters. For information on configuring traffic filters, see the "Configuring Traffic Capture" section.
Display frames with1
(Frame Relay and HDLC) When At least one match is selected, then post-filtered frames match at least one of the selected filters. When No matches is selected, then post-filtered frames do not match any selected filter.
Apply post-filtering to packets
Apply post-filtering to either a selective subset of or to all previously captured packets.
Load from File
Load a previously saved traffic capture configuration file.
Save to File
Save a traffic capture configuration to a file for future use.
Apply filtering
Apply the post-filtering criteria defined in this pane to previously captured packets.
Count
Maximum number of packets available for post-filtering.
1 This option is not available for ATM networks. By default, the setting in effect is At least one match.
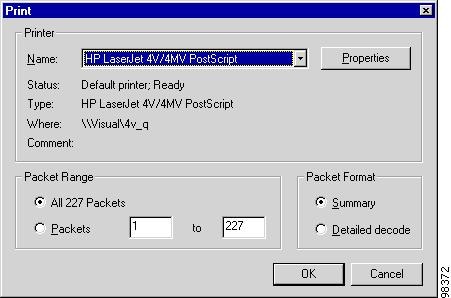
Printing Captured Packets
You can print captured packets appearing in the Traffic Capture window.
Step 1
The Print window, shown in Figure 7-23, appears.
Figure 7-23 Print Window
Step 2
Step 3
Step 4