Cisco Prime Collaboration Assurance and Analytics - Business Guide, 11.6
Bias-Free Language
The documentation set for this product strives to use bias-free language. For the purposes of this documentation set, bias-free is defined as language that does not imply discrimination based on age, disability, gender, racial identity, ethnic identity, sexual orientation, socioeconomic status, and intersectionality. Exceptions may be present in the documentation due to language that is hardcoded in the user interfaces of the product software, language used based on RFP documentation, or language that is used by a referenced third-party product. Learn more about how Cisco is using Inclusive Language.
- Updated:
- January 16, 2017
Chapter: Manage Inventory
Manage Inventory
- View Inventory Details
- Device Status Summary
- Update and Collect Inventory Details
- Suspend and Resume Managed Devices
- Delete Devices
- Performance Graphs
- Unified CM Device Search
- SNMP Query
View Inventory Details
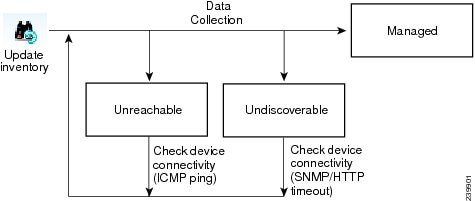
Cisco Prime Collaboration performs continuous, real-time discovery of inventory. You need to periodically update the inventory so that you have up-to-date information about your network. You can schedule how often you want to update inventory.
When you update inventory, the inventory synchronizes with the Cisco Prime Collaboration database. The Cisco Prime Collaboration inventory reflects every addition, deletion, and modification that occurs in the network after update.
In Cisco Prime Collaboration, devices are grouped based on the device type. The Device Group pane is available in the , Diagnostics (as a filter), Endpoint Diagnostics, and Alarms and Events pages. You can select devices or endpoints from the groups you are interested in, to check inventory details.
You can hover over the device host name column in the inventory table, and click the Device 360 ° view to see device details, such as alarms, interfaces, ports, environments, modules and other device-specific capabilities of that device. For more information, see Device 360 ° View.
In addition to the inventory table, the page contains System Information, Access Information, Interface Information, and Event Settings panes that appear below the inventory table. All of these panes are populated based on the last polled data. A device must be in the Managed state at least once for these details to be displayed.
Inventory Pane
The current inventory table is available in the Inventory page.
Each device that is managed by Cisco Prime Collaboration is modeled to display the physical inventory of a device (interface and peripherals). To view the inventory details for a device, click on a row in the Current Inventory pane.
To select multiple devices (first 500 entries), use the check box available on the top left corner of the Current Inventory pane.
You can modify the credentials and rediscover devices using the Modify Credentials option. Click on Job Progress in the confirmation message window and cross launch to the Jobs Management page to see the details of the discovery job.
You can suspend and resume the management of the device using the Suspend and Resume options. Inventory is not updated for devices in the Suspended state.
You can use the show drop-down list on the inventory table to filter devices based on the device type and state. For example, if you want to rediscover all deleted devices in your network, select Deleted from the show drop-down list. The inventory table will list all deleted devices. Perform rediscovery to discover these devices.
There are options such as Quick Filters, Advanced Filters to filter devices based on the device criteria.
The Total field in the upper right corner of the inventory table displays the device count. To view the number of devices in a group, select the group.
For example, to view the number of phone endpoints, select the Endpoints group in Device Group. The number of endpoints will be updated in the Total field. For more information on the device count, see the Field Descriptions for the Current Inventory table.
This table describes the fields on the Inventory table. Not all columns of the inventory table appear by default. To see all the columns, click the Settings option on the top right corner. You can export the inventory table as a CSV or a PDF file by clicking the Export icon at the upper right corner of the inventory table.
Device 360° View
You can get a concise summary information regarding any device through its 360° view. Rest your mouse over a device IP address, then click the quick view icon to launch the Device 360° View window. You can also do a global search for a device to see the device details in the Device 360° View.
In addition to viewing device information such as status, location, you can also view modules, alarms, and interfaces on the device, invoke tools like ping, and traceroute for that device.
 Note | If you are using Internet Explorer 10 and 11, ensure that you have the recommended browser settings to view the Device 360° View window. Press F12 in your browser and set the following: Launch the browser again to view the Device 360° view window. |
The 360° Device View window contains the following device details:
|
State |
You can hover on the State icon to know the state of the device. Different colors of the icon represent different states. |
||
|
Status Reason |
You can hover over the icon to know the status reason of the device and any additional activities you need to perform to make all features work. Different colors of the icon correspond to the state the device is in. |
||
|
You can click the IP address to launch the device management page. To log into routers and switches, ensure that you click on the IP address and associate a terminal client application, such as TELNET or SSH. |
|||
|
MAC Address |
MAC address of the device. |
||
|
The device type or primary role or capability of the device is mentioned on the right corner below the hostname row. For example, Finesse, Unified CM or Unity Connection. |
|||
|
Cluster ID |
Cluster ID of the cluster the device belongs to. You can click on the cluster ID to launch the Cluster Details page. |
||
|
— |
Click the support community icon to open the Cisco Support Community Dialog box which has the related posts and discussions filtered for the device. You can post a question for that device. You can go to the support pages of other devices, and also visit the support community page of Cisco Prime Collaboration. To visit the Cisco Prime Collaboration page, click Visit the Cisco Support Community, click on Navigate to a Community Topic and Post pane, then click Collaboration, Voice and Video. In the Collaboration, Voice and Video Communities table, click Prime Collaboration Management. You can post questions in the Cisco Prime Collaboration Community forum, and look for related questions or information in existing discussions, videos, and additional documents for your issues. For business impacting technical issues, we recommend that you open a service request with Cisco TAC for timely support. |
||
|
— |
Click the ping icon to ping the device and get ping statistics, such as the number of packets transmitted and received, packet loss (in percentage), and the time taken to reach the device by ping in milliseconds (ms). |
||
|
— |
Click the traceroute icon to know the route to reach the device, the number of hops to reach the device, and the time elapsed at each hop in milliseconds (ms). |
||
|
— |
|
Other device-specific information is as follows:
Note | The fields displayed depend on the device you have selected. |
Metric Charts
You can view metric charts for voice devices (excluding phones) and CTS. These charts appear only for devices in managed state and for which at least one poling cycle is over.
These charts display values for CPU, Memory and Hard Disk utilization etc. You can view maximum, minimum and current value (in percentage or bytes in MB) of the last hour. Each bar on the metric chart denotes a period of four minutes, thus there are 15 bars, each denoting the value for four minutes. The figures in brown represent the minimum value, and the figures in blue represent the maximum value for the last hour.
You can click See More to launch performance graphs for some devices.
Global Search Options for Cisco Prime Collaboration
The following table describes the Global Search options for Cisco Prime Collaboration.
|
Search |
Variable |
Sample String Format |
Exceptions and Allowed Search Strings |
|
|---|---|---|---|---|
|
Endpoint |
DN |
10002|1000*| 100*| 1*| *0002 |
Alphanumeric characters, dash, period, and underscore. |
|
|
IP |
10.64.101.162 | 10.64.101.* | * 10.78.22.77| . | 10.78.22.*| 10.78.*.*| 10.*.*.*| *. |
Alphanumeric characters, dash, period, and underscore. The special character % does not retrieve results. Ampersand (&) and blank space are not allowed. |
||
|
MAC |
00260bd75cf8| 00260bd75cf*| 00260bd*| 0*| 00* |
Dash, period, underscore, are not allowed. Alphanumeric and blank space are allowed.
|
||
|
Endpoint Name |
San Jose |
- |
||
|
Device |
IP |
10.78.22.129| 10.78.22.*| 10.* |
Alphanumeric characters, dash, period, underscore, and space. |
|
|
DNS |
cussmtest-15.cisco.com |
If the domain name is not resolvable, the IP address is displayed in the search results. |
||
|
User |
First Name or Last Name |
HS John |
Alphanumeric characters, dash, underscore, and blank space are not allowed. |
Search Results
|
Search Parameter |
Search Result |
||
|
Endpoint |
Endpoint Name, Directory Number, IP Address, IPv6 Address, MAC Address, Model, Cluster Name, Software Version, Registration Status, and Status Reason. When you perform an endpoint search, all phones and Cisco TelePresence endpoints are also included in the search. You can click on the icon next to the IP address to launch the Endpoint 360° View for that endpoint. |
||
|
Device |
Name, IP Address, Status, and Device Type. When you perform a device search, all phones and Cisco TelePresence endpoints are also included in the search. You can click on the icon next to the device name to launch the Endpoint or Device 360° View for that device.
|
||
|
User |
First Name, and Last Name. You can click on the icon next to the user name to launch the User 360° View for that user. |
Note |
|
Search Use Cases
|
To search for... |
Perform/Use |
|
All devices belonging to a particular customer. |
Select the customer from the global customer selection drop-down list at the top right of your screen, select Device search, and then enter the search string *. |
|
Cisco Jabber |
Endpoint Search |
|
E20 |
Endpoint Search |
|
Infrastructure devices |
Device Search |
|
IP address of a device with a partial IP address. |
Device Search - For example search with a string such as 10.* |
|
List of all users associated with a particular customer. |
Select the customer from the global customer selection drop-down list at the top right of your screen, select User search, and then enter the search string *. |
Device Status Summary
The Device Status Summary lists the count of devices based on the device state. The counts does not include Phones & Unknown devices. The device count is available as a cross-launch to the Inventory table in Inventory Management. When you click on any count, you will be directed to the Inventory table, where you can see all the devices in that particular state. You can filter count based on Customer/Assurance Domain. The Device Status Summary data is refreshed every 30 seconds.
The Device Status Summary is available under . The Devices column displays the total number of devices in a particular state. The Status column displays the status of the devices. When you click on Discovery Jobs, you will be directed to Job Management page and where you can see the status of the discovery job.
You can view the following device status. For more information on status, see Discovery Life Cycle.
When you hover your mouse over Partially Managed, Inaccessible, or Undiscoverable states, you can view a tool tip with an explanation.
You can view Unmanaged device count in the global summary bar, adjacent to Inventory Summary. When you click on the count, you will be directed to Device Status Summary page.
| Displays the device discovery status. | |
|
Devices Discovery In-Progress <count> |
Displays the number of devices for which discovery is in progress. Devices Discovery In-Progress <count> is not displayed, if there are no discovery is in progress. |
Inventory Status Error Messages
The credential verification error messages are tabulated below.
|
Error Message |
Condition |
Possible Solutions |
||
|---|---|---|---|---|
|
SNMP_ERROR |
|
|
||
|
UNKNOWN_ERROR |
Error in discovering the device. |
Perform a re-discovery. If issue persists, contact TAC for assistance. |
||
|
INSUFFICIENT_INV_COLLECTION |
The device is taking a longer time to respond than expected, may be due to the network latency. |
Verify the the SNMP/HTTP(S) response time and perform a rediscovery. If the issue persists, contact TAC for assistance. |
||
|
HTTP_ERROR |
HTTP access has failed.
|
|
||
|
JTAPI_ERROR |
JTAPI access has failed. Firewall settings blocking the port. |
|
||
|
UNSUPPORTED_DEVICE |
Device is unsupported |
Verify the supported devices from Supported Devices for Cisco Prime Collaboration Assurance. |
||
|
UNDISCOVERABLE |
Error while persisting |
Perform a re-discovery. If issue persists, contact TAC for assistance. |
||
|
DISCOVERY_FAIL_TOO_MANY_DB_CONNECTIONS |
Error while persisting |
Perform a re-discovery. If issue persists, contact TAC for assistance. |
Update and Collect Inventory Details
Updating and collecting inventory details depend on the type of network deployed: voice, video or both. It also depends on the data you want to collect at a given point. The following table recommends when to update inventory based on your network.
|
If you have both voice and video endpoints deployed in your network, and want to collect data on both. |
Perform Update Inventory (choose ). For more information, see Update Inventory. |
|
If you have both voice and video endpoints deployed in your network, and you want to collect data on video endpoints only. |
Perform Update Inventory (choose ). For more information, see Update Inventory. |
|
If you have both voice and video endpoints deployed in your network, and you want to collect data on voice endpoints only. |
Perform IP Phone Inventory Collection and Cluster Data Discovery (choose Alarm & Report Administration). For more information, see Inventory Details Collection. |
|
Perform IP Phone Inventory Collection and Cluster Data Discovery (choose Alarm & Report Administration). For more information, see Inventory Details Collection. |
|
|
Perform Update Inventory (choose ). For more information, see Update Inventory. |
Update Inventory
The Update Inventory task helps you to synchronize the Cisco Prime Collaboration inventory database with the network. During this task, accessibility verification is not performed (see the Update Inventory Lifecycle chart).
Perform the Update Inventory task when:
-
You want to synchronize the database for all devices managed in your network. However, you can update the configuration details for specific devices based on the device status criteria.
-
You want to define a periodic Update Inventory job to keep the Cisco Prime Collaboration database up-to-date.
-
There are any changes in the network devices’ interfaces.
Note
The new devices that are added to the network will not be identified.
We recommend that you define a periodic Update Inventory job to keep the Cisco Prime Collaboration database up-to-date.
| Step 1 | Choose . |
| Step 2 | In the Inventory Management page, click Update Inventory. |
| Step 3 | If you want to update the
inventory based on device status, check the Update devices based on device
criteria check box in the Update Inventory window and select the desired device
criteria from the drop-down list.
If you choose to update the inventory based on device status, an accessibility information check is performed. If you do not, the inventory is updated with all devices in the Managed state. Device accessibility is not checked. To schedule a periodic update inventory job, go to Step 4. To run the job immediately, go to Step 5. |
| Step 4 | Enter the job name and the scheduling details. See Job Schedule - Field Descriptions for field descriptions. |
| Step 5 | Click Run Now to immediately run the update inventory job, or click Schedule to schedule the periodic update inventory job at a later time. |
| Step 6 | Check the status of your job
by doing one of the following:
|
Job Schedule - Field Descriptions
Inventory Details Collection
Cisco Prime Collaboration supports on-demand inventory update for managed devices by collecting and updating data about the devices and the phones registered to them.
All additions, deletions, and modifications of phones, XML phones, and clusters are reflected in the inventory. There are separate inventory collection schedules for phones and clusters. For details on cluster discovery, see Cluster Data Discovery Settings.
You cannot create additional schedules; you can only edit an existing schedule. For phones, you can create multiple inventory collection schedules.
Note | You can schedule periodic discovery of Cisco Unified CM clusters only. Phones registered with other clusters are not discovered. For more information, see Cluster Data Discovery Settings. |
As Cisco Prime Collaboration performs inventory collection of phones and Cisco Unified CM clusters, these phones and clusters pass through various device states until they are fully recognized by Cisco Prime Collaboration. See Discovery Life Cycle for details.
You can specify how often to collect information about the phones and clusters that are managed in Inventory Collection. To schedule Inventory Collection, choose . For an overview of inventory collection tasks, see the following table.
|
Choose to add, edit, or delete the IP phone discovery schedules (For more information, see IP Phone Discovery Schedule). |
|
|
Choose to add, edit, or delete the IP phone discovery schedules (For more information, see IP Phone Discovery Schedule). |
|
|
Choose to add, edit, or delete the cluster device discovery schedules (For more information, see Cluster Data Discovery Settings). |
IP Phone Discovery Schedule
When you choose , you can perform the following tasks:
View and Add an IP Phone Collection Status
To view IP phone collection status, choose .
The IP Phone Collection Status pane displays the information mentioned in the following table.
|
Displays the status of the discovery process. The status could be any one of the following: |
|
Add an IP Phone Discovery Schedule
Cisco Prime Collaboration provides six default schedules for phone discovery. You can update or delete them; you can also add up to 10 phone discovery schedules.
IP Phone XML Discovery Schedule
The IP Phone XML Inventory Collection helps you get information on phone load, serial number, switch information (if applicable), device pool etc.
To schedule when phone discovery should take place, you can use the Phone XML Collection page. The default scheduled start for Phone XML discovery is daily at 3:00 p.m. Phone XML discovery collects serial number, load ID, and App ID for each phone.
Suspend and Resume Managed Devices
You can suspend a device that is in the Managed state. After the device is moved to the Suspended state, Cisco Prime Collaboration does not monitor this device. That is, conference, endpoint, and inventory details are not updated and alarms are not triggered for this device.
The following are behaviors for a device in the Suspended state:
-
If a device is in the Suspended state, Cisco Prime Collaboration does not poll the devices.
-
If a suspended endpoint joins a new conference, the endpoint is shown as Unknown in the Conference Topology pane.
-
If a suspended endpoint is already in an in-progress conference, the endpoint icon (in the Conference Topology pane) changes to Unknown immediately after the endpoint state is changed to Suspended.
-
If Cisco Unified CM publisher is suspended, Cisco Prime Collaboration does not poll the registered endpoints that belong to that corresponding Cisco Unified CM cluster.
-
If there are any active alarms, they are not cleared immediately. You can either manually clear the alarms; otherwise, they are cleared automatically after they expire (by default, in 24 hours). No new alarms are triggered for a suspended device.
-
If a device is suspended, the Endpoint Utilization report does not contain any data for this device.
Delete Devices
You can delete devices that are in the Unknown, Unreachable, Inaccessible, Undiscoverable, Suspended, and Unsupported states. You cannot delete devices in the Managed state.
After a device is deleted, it is not listed in the Current Inventory table, but the details are available in the Cisco Prime Collaboration server. To rediscover a deleted device, see Rediscover Devices. You can access the deleted device’s details as part of the past conference data.
| Step 1 | Choose . | ||
| Step 2 | From the Current Inventory
table, select devices to delete.
You can use the quick filter to get a list of devices in the desired state. | ||
| Step 3 | Click Delete. | ||
| Step 4 | In the confirmation message
box, click
OK.
|
Troubleshooting
Issue: Unable to delete a device that is in Managed state.
Recommended Action: Ensure that you suspend the device first, and then delete the device.
Performance Graphs
Cisco Prime Collaboration enables you to select and examine changes in network performance metrics. You can select, display, and chart network performance data using real time, as well as collected data.
Note | You can view performance graphs for voice devices (excluding phones) only. These graphs appear only for devices in managed state and for which at least one polling cycle is over. |
Performance Graphing Notes
This section contains information you should be aware of when working with performance graphs.
|
Summary |
Explanation |
|---|---|
|
Cisco recommends following these guidelines for optimal performance graph viewing. |
|
|
An MGCP gateway on a Catalyst 6000 switch. When you have all three capabilities (voice gateway, switch, and MGCP) performance graphing cannot graph all the data. Only the common metrics are available for graphing. |
When graphing performance metrics for a device that has these three capabilities (voice gateway, switch, and MGCP) you will only be able to graph the common metrics. In the Event Details page you cannot graph HighUtilization events. |
|
A voice gateway, MGCP, and H323 on a router. When you have all these capabilities on one device, each metric displays two graphs. |
When graphing performance metrics for a device that has these capabilities (voice gateway, MGCP, H323, and router), each metric displays two graphs. Also, when graphing multiple devices or devices that have multiple polling intervals, the least common multiple is used to plot the x axis. Real-time graphs will refresh at this common polling interval. |
|
Cisco Unity Express servers (CUES) graph real-time data and update in real-time. You can switch from line to bar charts and zoom in on specific data to troubleshoot and find peak utilization periods. |
Ensure Cisco Prime Collaboration is collecting data and is configured properly to receive this data. |
Launch a Performance Graph
- Device 360° View - Click on the Launch Tools icon, and then click on Performance Graph.
- Event Details page
- Diagnostics views—UCM Cluster Call Usage Summary in Server and Cluster views, UCM Resource Utilization Summary and UCM Cluster Location Summary in Cluster view, and trunk utilization can be accessed through the UCM Resource Utilization Summary portlet. in the Cluster view.
- Verify that Cisco Prime Collaboration is monitoring the devices for which you want to collect utilization statistics. This includes the Cisco Unified Communications Manager that the ports are registered to.
- Verify that voice utilization polling settings are enabled. Cisco Prime Collaboration uses the statistics gathered during voice utilization polling for charting network performance.
- Review the Performance Graphing Notes.
Performance Graph Window
Performance graphs provide real-time information and historical information.
When you launch a performance graph, one line graph is displayed for each metric that you select. Each line graph contains 16 data points displayed in real time. The following table provides details on the data options.
|
Graph Data Option |
Description |
|---|---|
|
Real Time |
When you launch a performance graph, it shows real time data by default. |
|
Hourly Average |
When you select Hourly Average, the performance graph shows average data for the hour. |
|
Hourly Max |
When you select Hourly Max, the performance graph shows peak data for the hour. |
|
Hourly Min |
When you select Hourly Min, the performance graph shows minimum data for the hour. |
|
History |
When you select History, the performance graph shows hourly average data for seven days. |
|
All |
Displays all data. Graphs display up to a maximum of 130 points. If data ranges in the Zoom/Pan view contain more than 130 points, then Cisco Prime Collaboration selects points at regular intervals and plots them in the graph. |
Troubleshooting Performance Graphs
This section contains information that will help you if you encounter problems generating performance graphs. If you encounter an error, it will likely appear either when you select Performance Graphing from the menu, or when Cisco Prime Collaboration is checking for the data file to graph. In the first case (when selecting Performance Graphing), you will see an error message that describes the problem and an action to take. The following table describes the errors and their possible causes, for both of these types of cases.
|
Error |
Possible Causes |
|---|---|
|
Cannot collect data. |
For a list of devices supported by Cisco Prime Collaboration Assurance and Analytics—Business 11.5, see Supported Devices for Prime Collaboration Business 11.5 |
|
|
|
|
|
For a list of devices supported by Cisco Prime Collaboration Assurance and Analytics—Business 11.5, see Supported Devices for Prime Collaboration Business 11.5 |
|
Cannot collect data from the device. The certificate hostname/IP Address cannot be mapped to the URL hostname/IP Address. |
The device is not in DNS. |
|
Incomplete data collected because an error occurred in communicating with the device. |
For a list of devices supported by Cisco Prime Collaboration Assurance and Analytics—Business 11.5, see Supported Devices for Prime Collaboration Business 11.5 |
|
|
|
|
Too many queries on a Cisco Unified CM 6.0 or later. Check the polling settings; they should not be less than three minutes. |
|
|
Query exceeded time limit on Cisco Unified CM 6.0 or later. |
|
|
Cisco Unity Express trunk utilization graphs are not working. |
Cisco Prime Collaboration must be configured properly using the maximum capacity. |
- If you are not able to collect performance data and you do not see an error message (either a popup message or a message in the log file) indicating the problem, you should verify the status of the device. To do so, use the View/Rediscover/Delete Devices page. If the device is in the Unreachable state, verify that the device's credentials are correct and rediscover the device.
- If a gray line or a gray area appears in a graph, hover your mouse over it to obtain a tool tip with an explanation.
Unified CM Device Search
You can search for devices within a cluster, based on the search criteria you specify.
To perform a device search, go to .You can view the devices based on the saved search criteria you select from the Saved Search drop-down list.
Note | The table displays only 200 entries. Therefore, we recommend that you use the filter criteria to the best use to ensure that you get the desired result. |
To create a new search criteria:
| Step 1 | Choose . | ||
| Step 2 | Click New Search. | ||
| Step 3 | Enter the
Criteria Name, Device Type, and Polling Interval
If you choose the devices only configured in the DB option, you cannot specify the polling interval or the other parameters, except the device type. This option displays the devices in the Unknown state. The same user cannot use the same search criteria name for the same cluster. The same user can have the criteria name for a different cluster. | ||
| Step 4 | For Custom
Search, specify the status within call Manager, Device Model, and the Search
with Name parameters.
The search criteria available vary based on the device type you chose. | ||
| Step 5 | Click
Search.
The search results are displayed in the page. The results get refreshed based on the polling interval you specify. You can launch the Unified CM from the IP address link available in the IP Address column. The search results also provides the following information:
This search does not get saved in the database and cannot be retrieved after you log out, unless you save the search. To save the search, click the save icon. You can also edit a search that you had saved. You can delete a search that you had created, even if it is unsaved. Use the edit or delete icon to edit/delete the search. Fields that you cannot edit are disabled.
|
SNMP Query
The SNMP query feature helps you to troubleshoot devices in your network.
Prerequisite - Devices should be supported by Cisco Prime Collaboration.
For a list of devices supported by Cisco Prime Collaboration Assurance and Analytics—Business 11.5, see Supported Devices for Prime Collaboration Business 11.5.
-
Choose .
-
Enter the IP Address, select and OID type from the OID drop-down list, and then do one of the following: -
Click the GET button - To know the return value of a particular OID. For example to know the Interface Name or Interface Status.
Credentials are required to perform this task. If the device information is available in the Cisco Prime Collaboration database, the details are auto-populated on the screen. Else, check the Enter the Credentials check box, select an SNMP version from the version drop-down list, and enter the details on the fields that appear. -
Click the Walk button - To get detailed information on the MIB of that device.
Credentials are required to perform this task. If the device information is available in the Cisco Prime Collaboration database, the details are auto-populated on the screen. Else, check the Enter the Credentials check box, select an SNMP version from the version drop-down list, and enter the details on the fields that appear.
-
 Feedback