Cisco Modeling Labs Corporate Edition User Guide, Release 1.2
Bias-Free Language
The documentation set for this product strives to use bias-free language. For the purposes of this documentation set, bias-free is defined as language that does not imply discrimination based on age, disability, gender, racial identity, ethnic identity, sexual orientation, socioeconomic status, and intersectionality. Exceptions may be present in the documentation due to language that is hardcoded in the user interfaces of the product software, language used based on RFP documentation, or language that is used by a referenced third-party product. Learn more about how Cisco is using Inclusive Language.
- Updated:
- July 10, 2016
Chapter: Visualizing the Topology
Visualizing the
Topology
AutoNetkit Visualization
The AutoNetkit visualization phase allows you to see how the nodes interact in terms of routing protocol connectivity, autonomous system (AS) numbers, Open Shortest Path First (OSPF) area, and so on. Before entering the AutoNetkit visualization phase, you must have designed the topology and generated the node configurations using parameters defined in AutoNetkit.
 Note | AutoNetkit visualization is available before a simulation is launched. A valid Cisco Modeling Labs license is not required to run AutoNetkit visualization. AutoNetkit visualization is only viewable on an external Web browser; internal Web browsers are not supported. |
Access AutoNetkit Visualization
To access AutoNetkit visualization, complete the following steps:
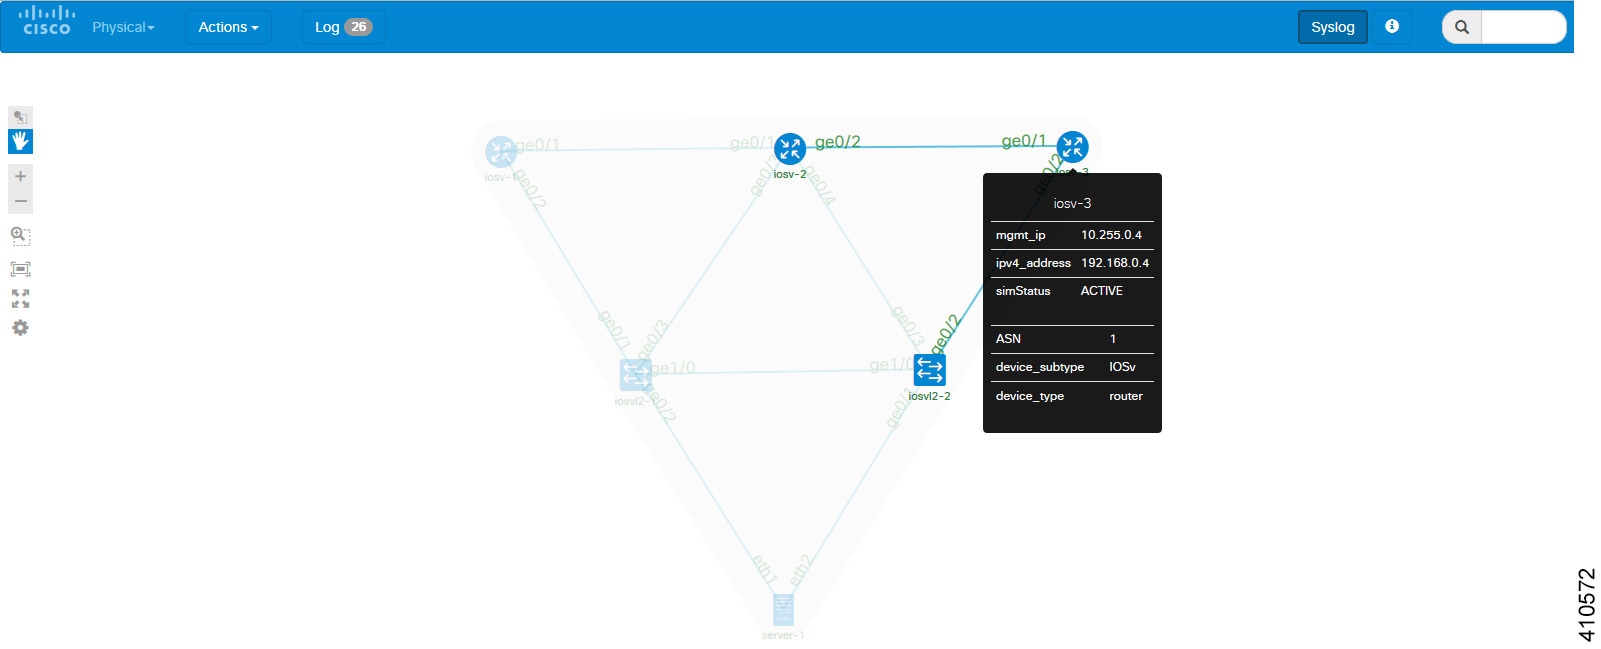
AutoNetkit View Options
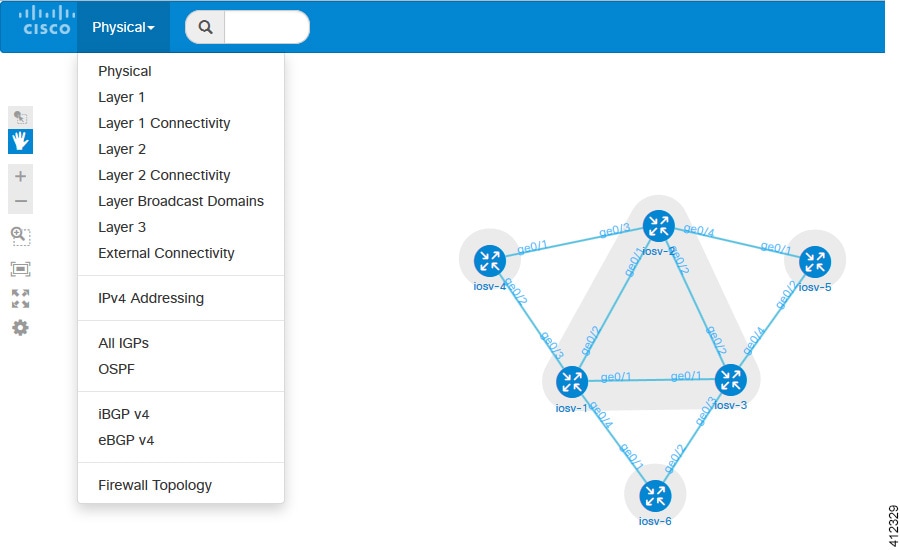
Note | You can also hover over the connections to see connection details. |
You can continue to select different protocol views to see how the protocol-centric view changes. In a complex topology, you can use the Physical views to verify that the protocols, nodes, and connections meet the design requirements.
Live Visualization
Note | In order to use the Live Visualization feature, the topology must use an LXC management node when launched. Under , check the Use an LXC Management Node check box when designing your topology. Then generate the node configurations using parameters defined in AutoNetkit. |
For the running simulation, you can see the LXC management node in the Simulations view.
Live Visualization runs in an separate, external Web browser window. Ensure that you use a compatible browser, as described in Cisco Modeling Labs Server Requirements for the version of Cisco Modeling Labs that you are using.
Note | Live Visualization is independent of AutoNetkit. It does not require AutoNetkit to run. However, a valid Cisco Modeling Labs license is required in order to use this feature. Also, ensure that each node has started up successfully and has applied its configuration before attempting to run a Live Visualization. A running node is displayed in green on the canvas and is displayed in green with [ACTIVE] in the Simulations view. |
View the Live Visualization
To access the Live Visualization for a running simulation, complete the following steps:
Note | The simulation must be configured to use an LXC management node when launched. This is enabled under view by checking the Use an LXC Management Node check box. Then generate the node configurations using AutoNetkit. |
| Step 1 | In the Simulations view, right-click the simulation name. | ||
| Step 2 | From the
drop-down list displayed, click
Launch Live
Visualization.
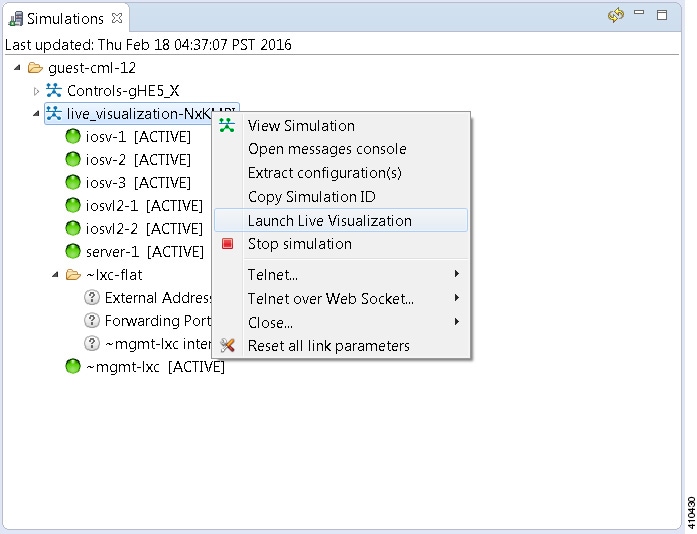 A web browser opens. | ||
| Step 3 | Enter your username and password and click Log In. | ||
| Step 4 | From the
Simulation
ID drop-down list displayed, choose the applicable simulation to launch.
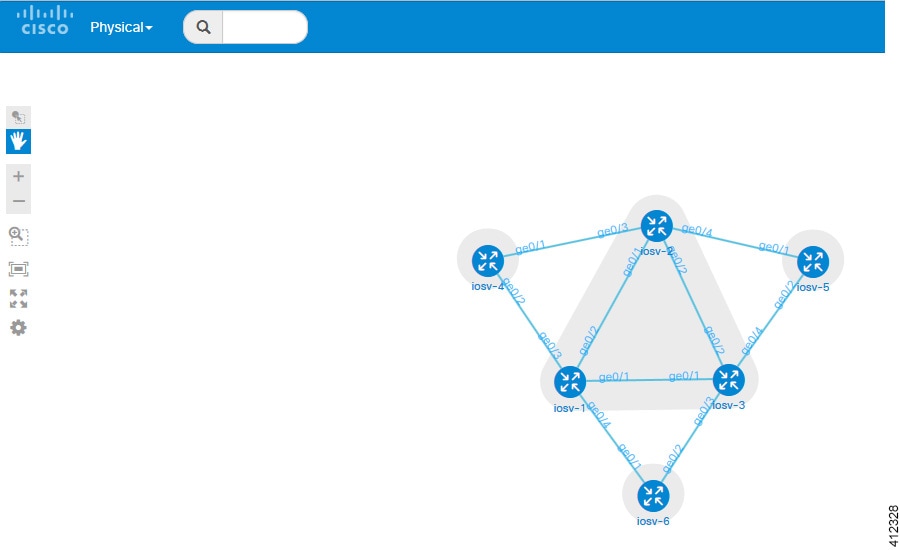
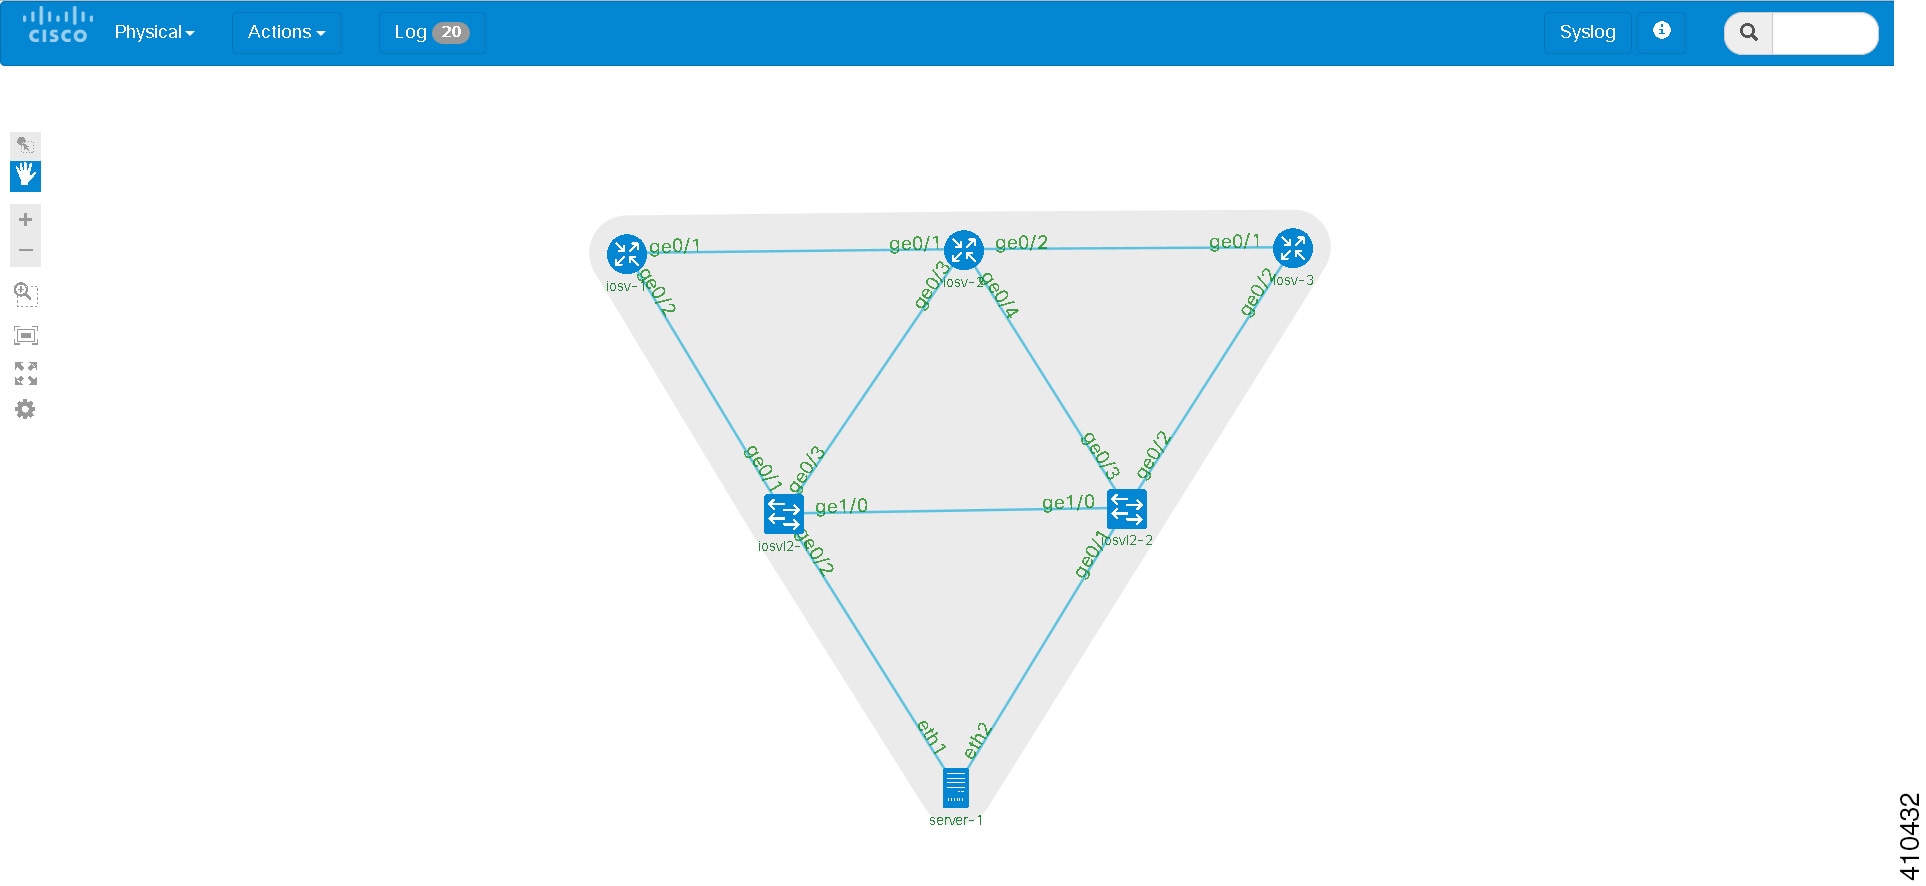
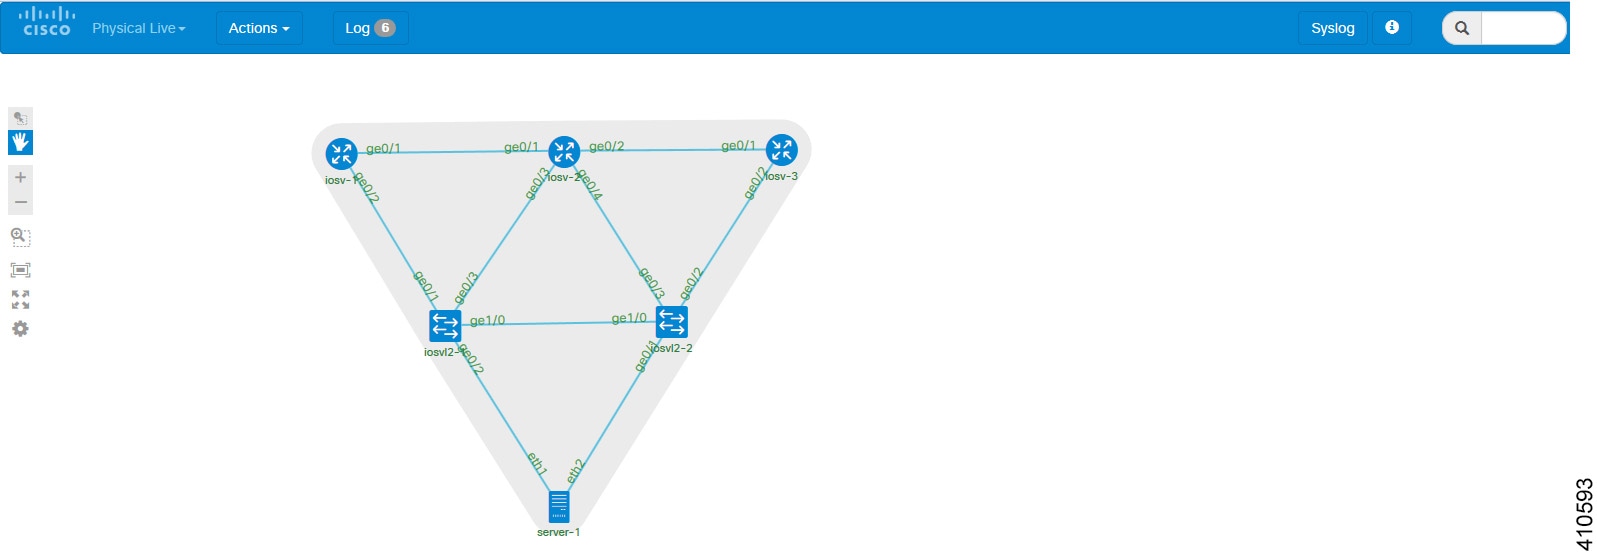
The Live
Visualization opens in a web browser as shown.
| ||
| Step 5 | You can also access the Live Visualization for a running
simulation from the User Workspace Management interface. In the User Workspace
Management interface, login and under
My Simulations, choose the applicable running simulation.
The details page for the running simulation is displayed.
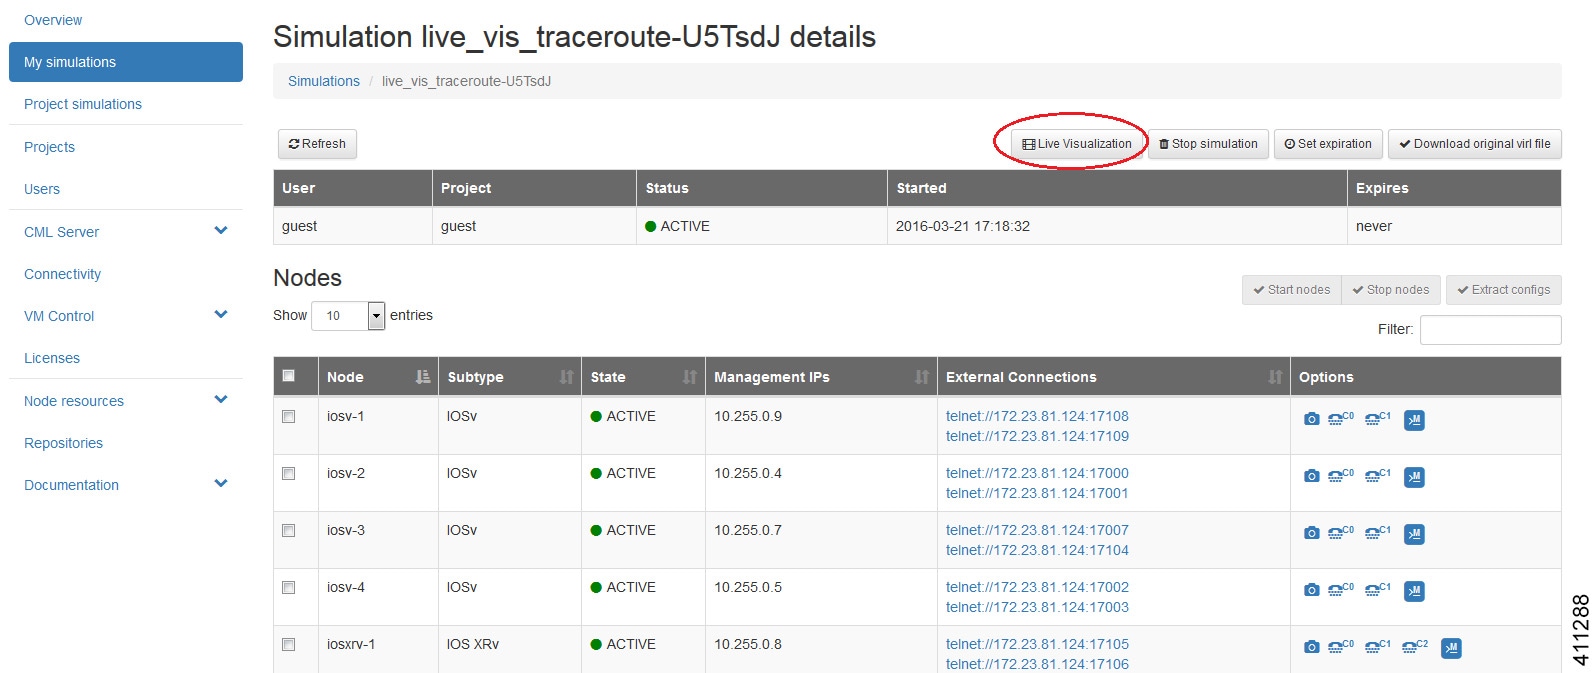 | ||
| Step 6 | Choose Live Visualization to launch the Live Visualization for the running simulation in a new web browser. |
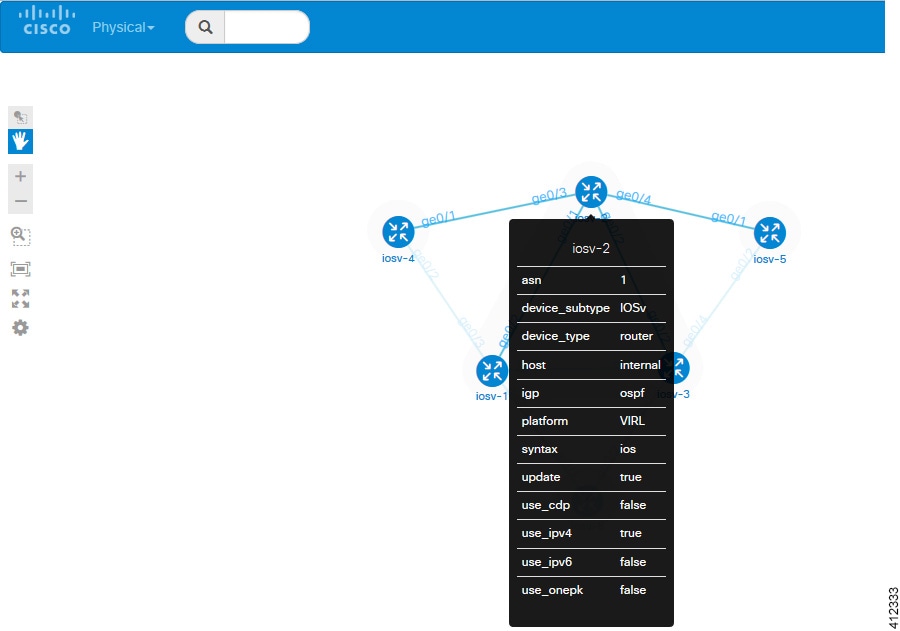
Live Visualization Overlay Options
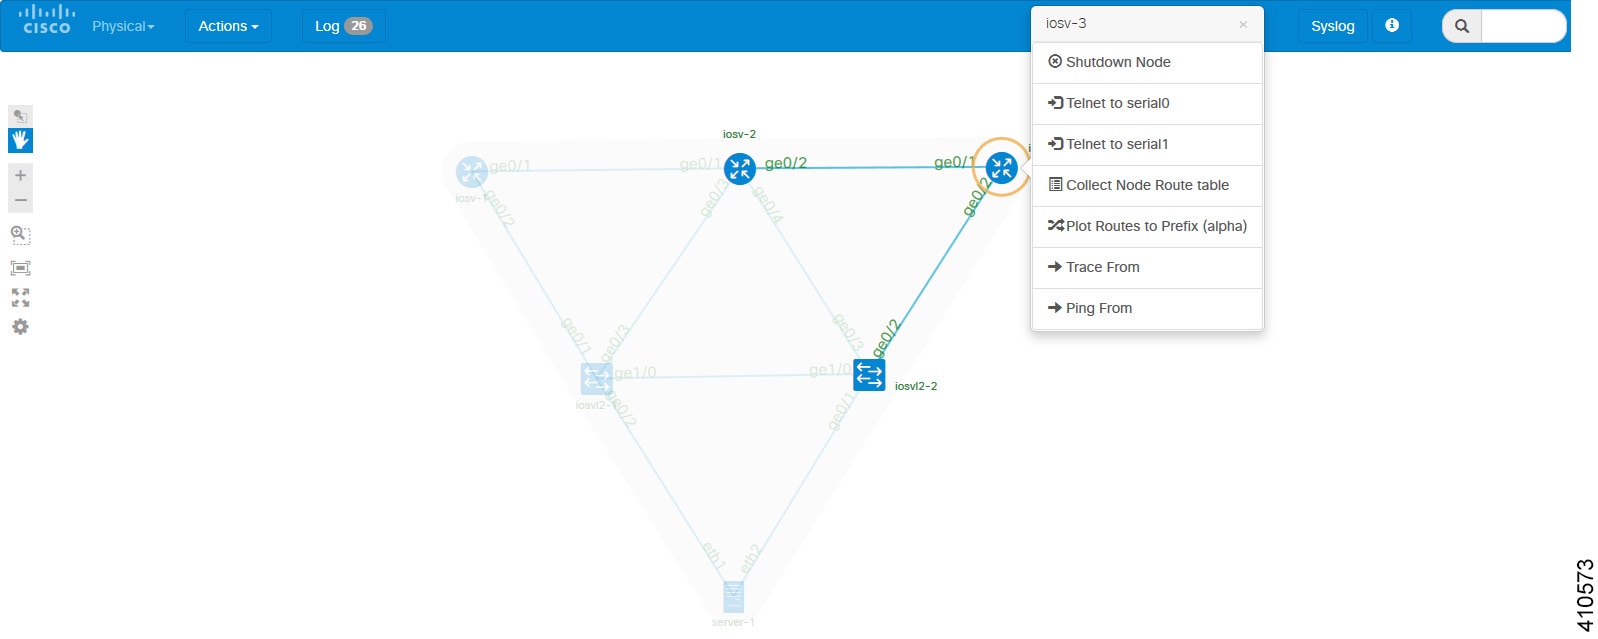
Available options are:
-
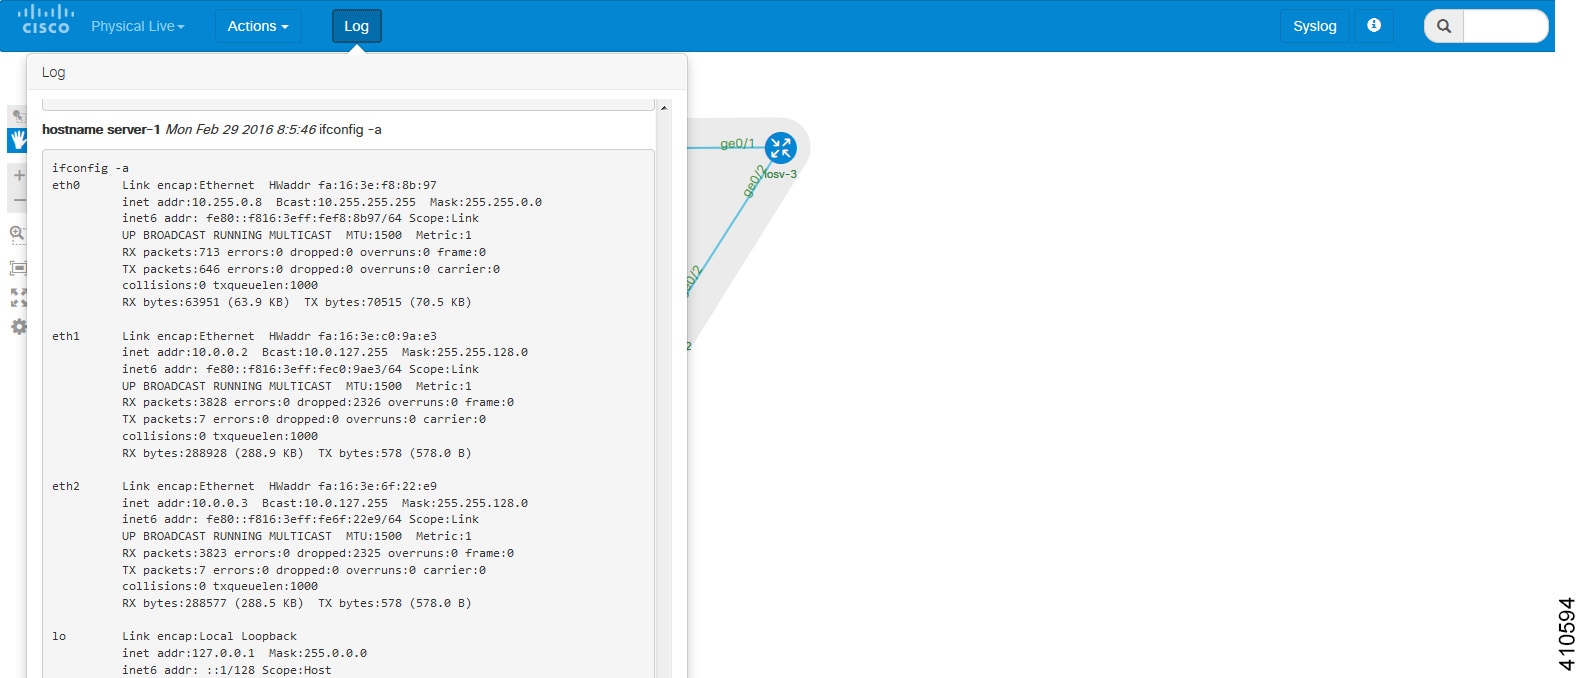
Shutdown Node: Allows you to shutdown a running node, with the results reported in the Log view.
-
Telnet to Serial0/Serial1: Allows you to Telnet to a node's serial ports 0 and 1. Opens a console port to serial or aux ports from within the web browser.
-
Collect Node Route Table: Allows you to collect the route table from every node in the simulation, with the results reported in the Log view.
-
Plot Routes to Prefix (alpha): Allows you to select a node and the system will show the next hops taken by traffic to this node's loopback address. This only work for nodes that are Cisco IOSv instances.
-
Ping From/To: Allows you to ping from one node to another node. A five packet ping is triggered from source to destination, with the results reported in the Log view.
-
Trace From/To: Allows you to execute a traceroute between nodes, with the results reported in the Log view.
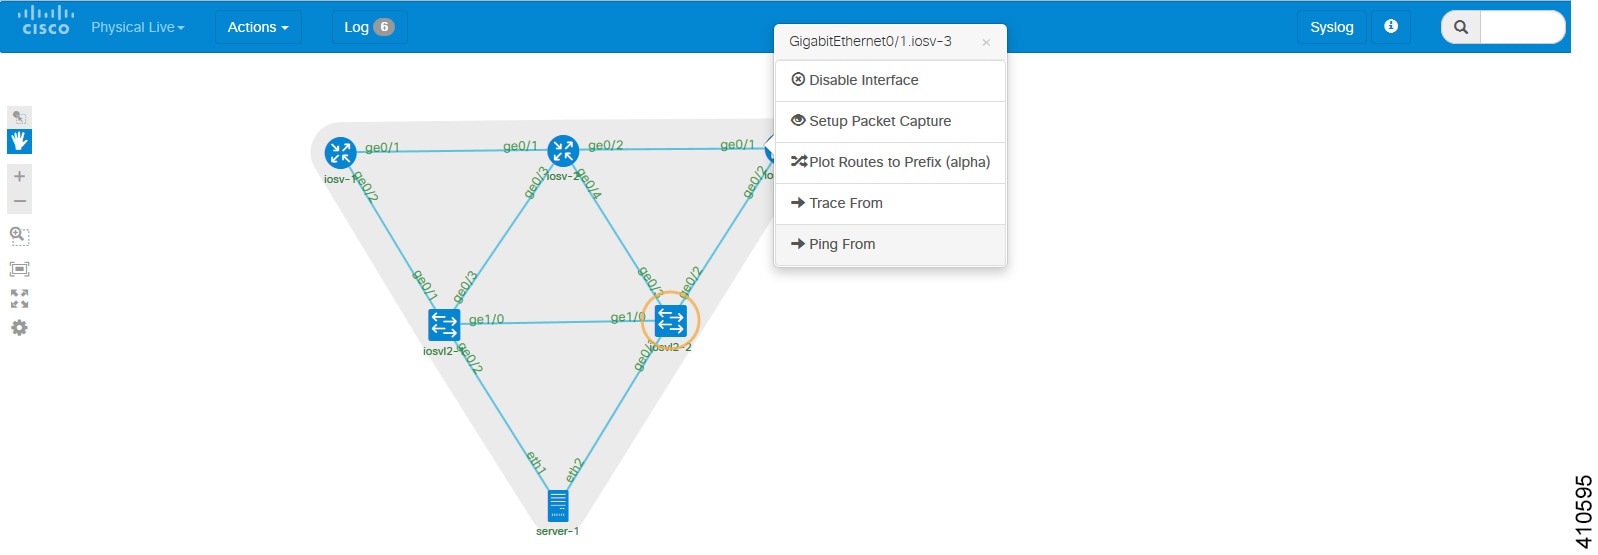
-
Disable/Enable Interface: Allows you to disable an interface, with the results reported in the Log view.
-
Setup Packet Capture: Allows you to start a packet capture. Opens the User Workspace Management interface in a new web browser, where you can set the required capture limits.
-
Plot Routes to Prefix (alpha): Allows you to select an interface and the system will show the next hops taken by traffic to this interface's loopback address.
-
Trace From/To:Allows you to execute a traceroute between interfaces, with the results reported in the Log view.
-
Ping From/To: Allows you to ping from one interface to another interface, with the results reported in the Log view.
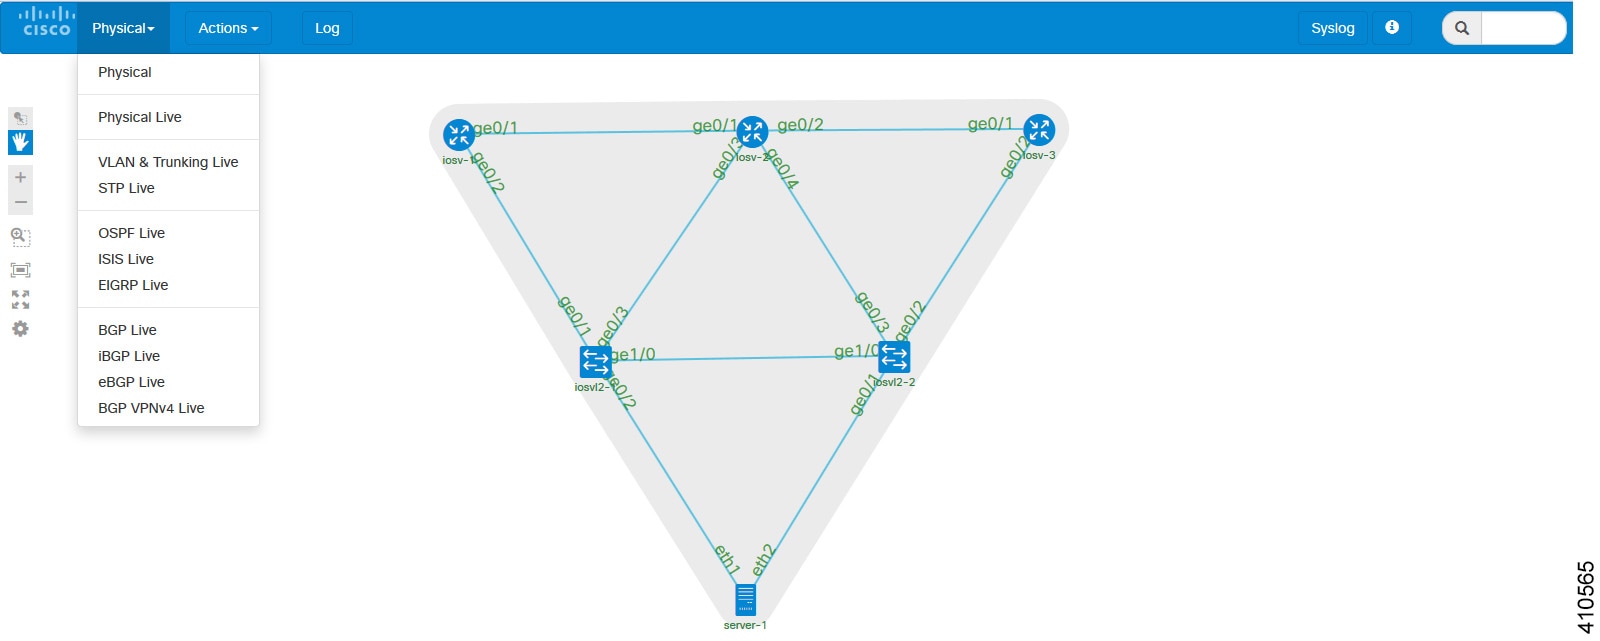
Physical Connections
Note | The collect interfaces action is run automatically when a Live Visualization session is first loaded. |
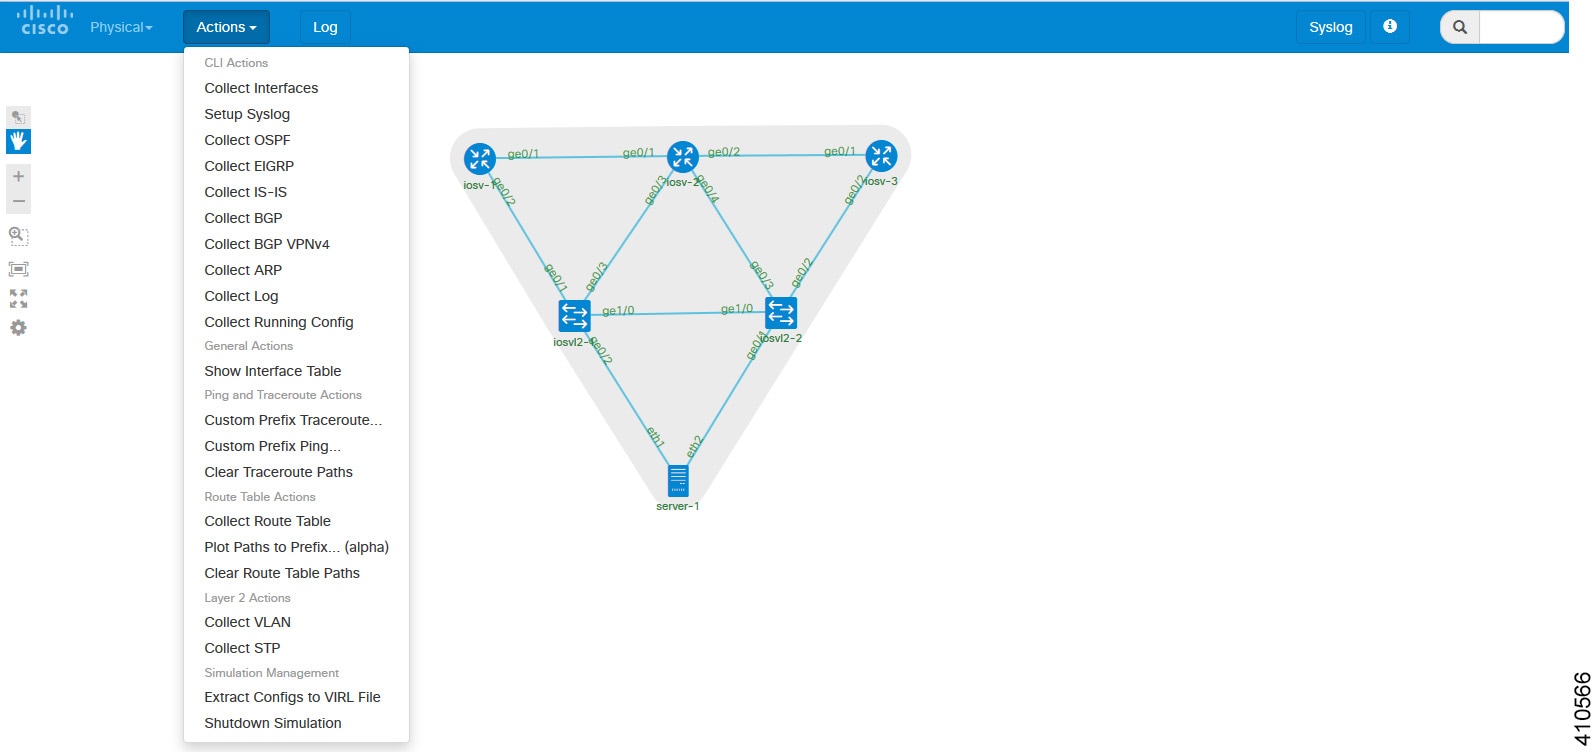
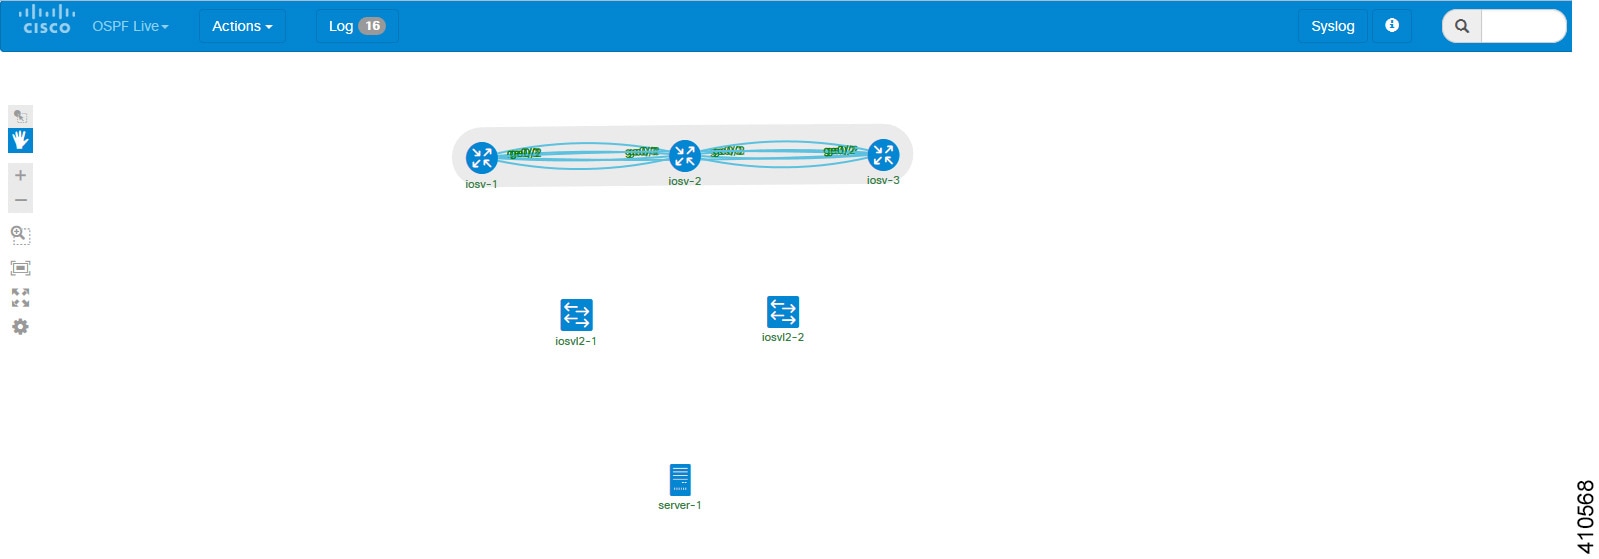
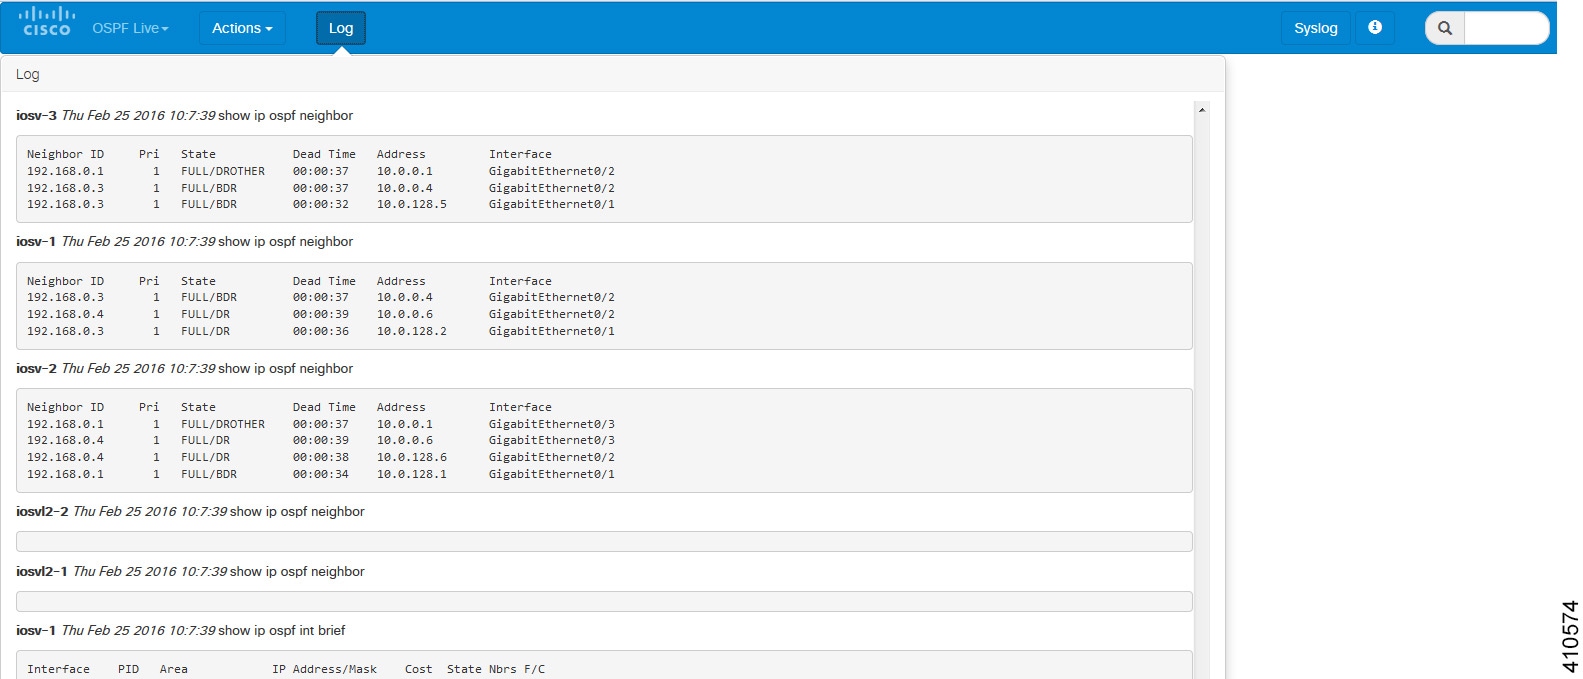
OSPF
-
Choose from the drop-down list; or
-
Choose . For both options, the Collect OSPF action runs the relevant show OSPF command on the nodes and then triggers the processor to parse and build the connectivity. The results are shown as adjacencies on the topology.
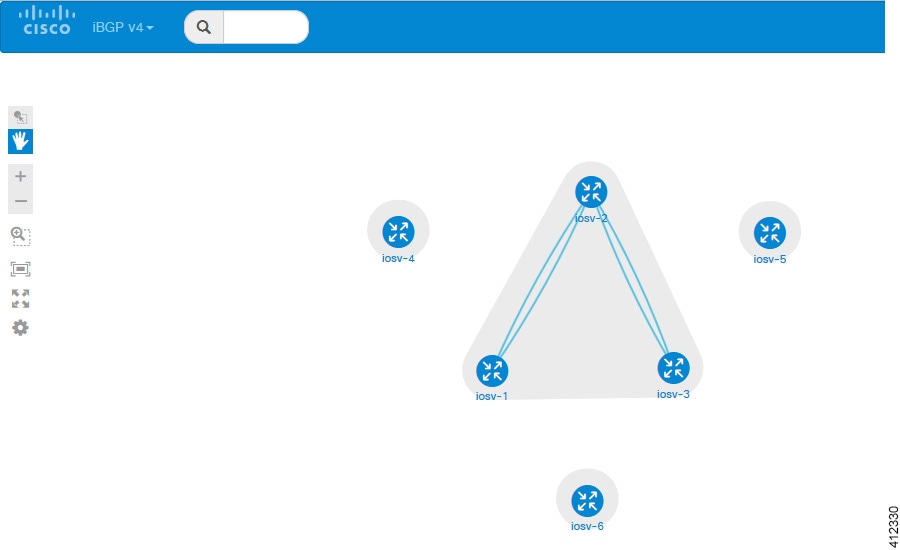
iBGP
-
Choose from the drop-down list; or
-
Choose . For both options, the Collect BGP action runs the relevant show BGP command on the nodes and then triggers the processor to parse and build the connectivity. The results are shown as adjacencies on the topology.
Figure 27. iBGP Live Overlay 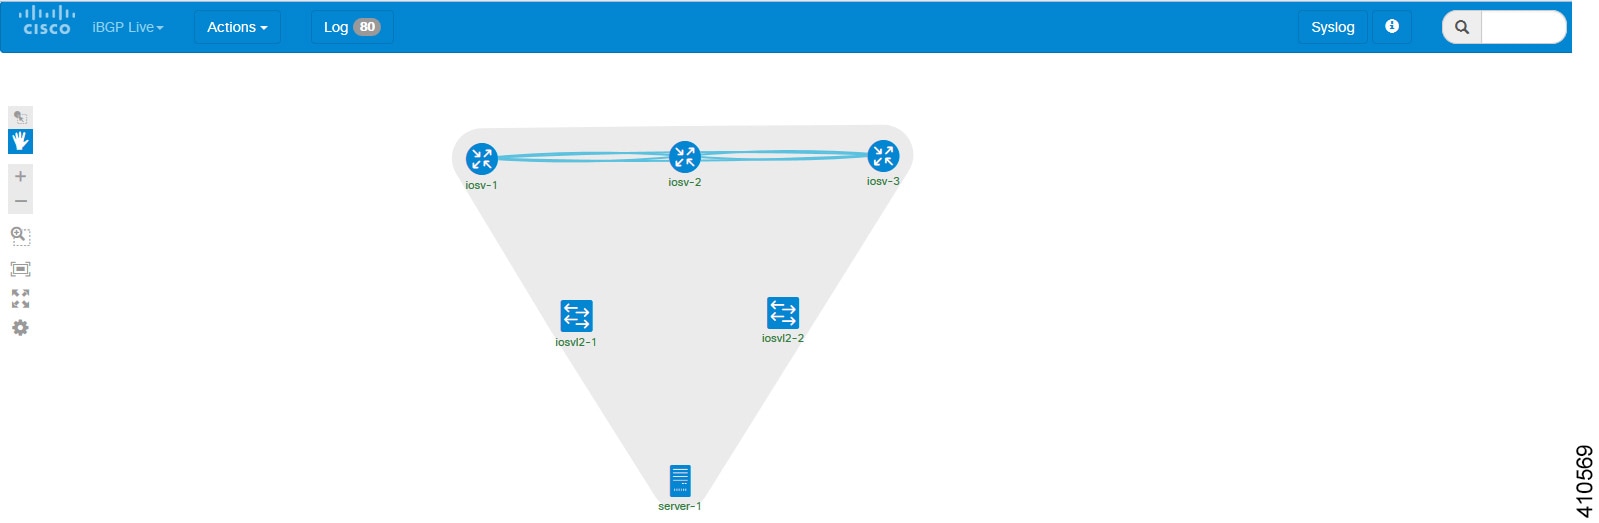
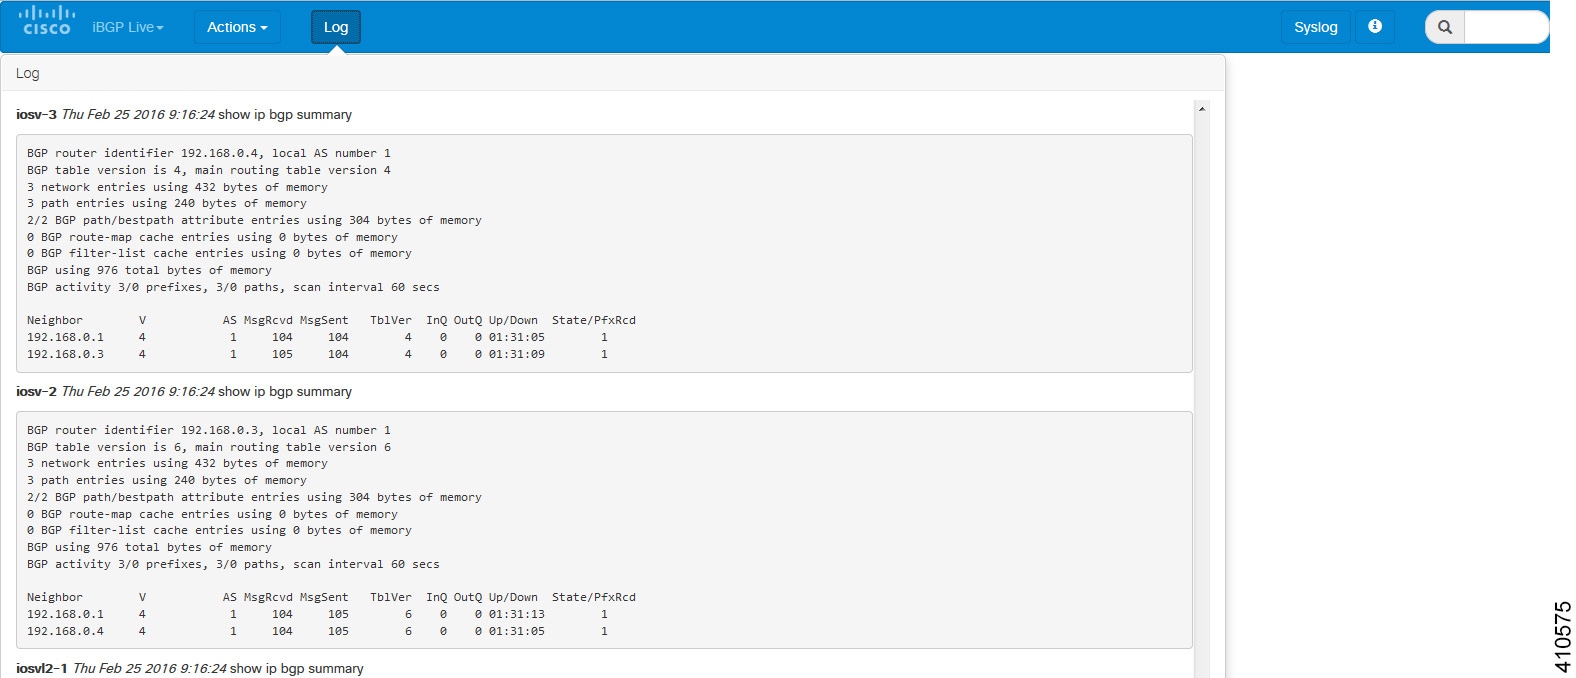
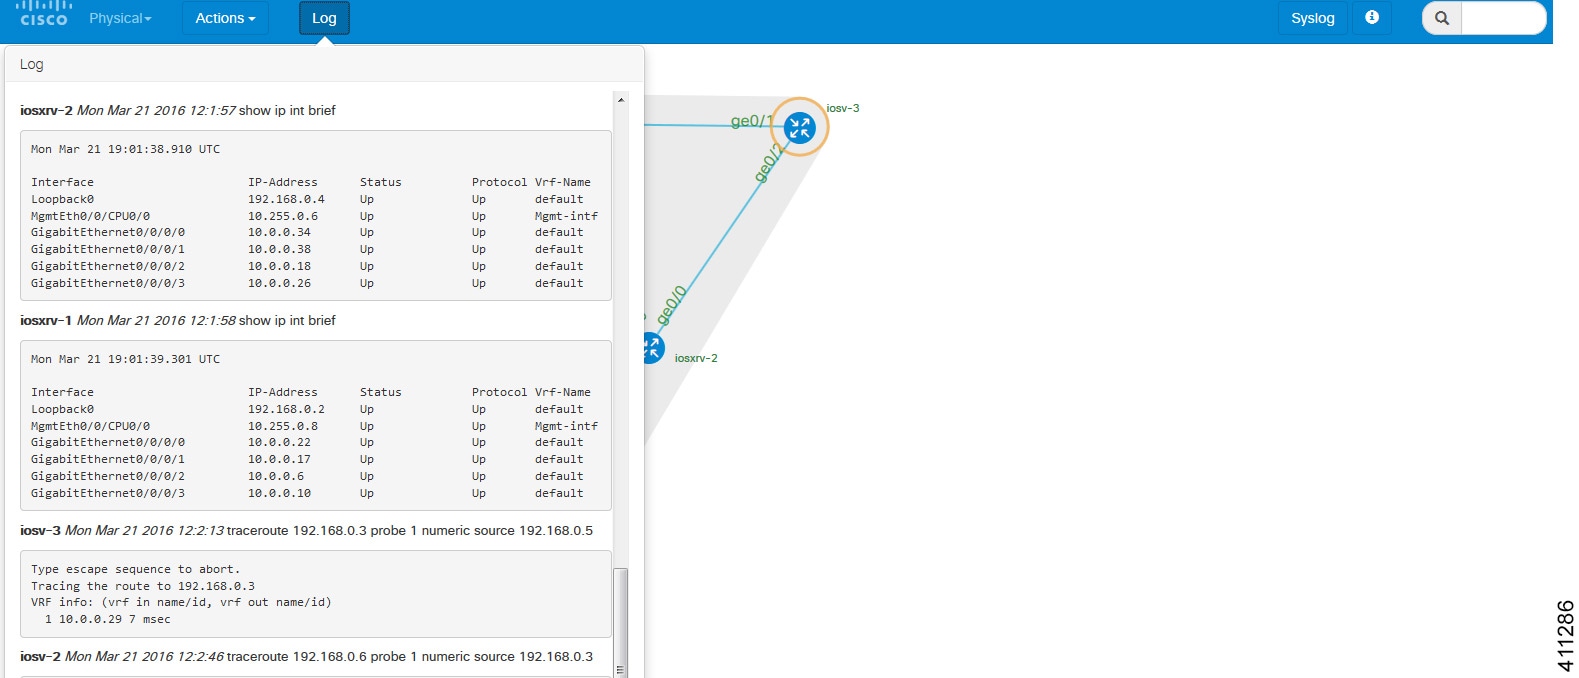
You can view the show command applied in the Log view. Figure 28. iBGP Live Log Output
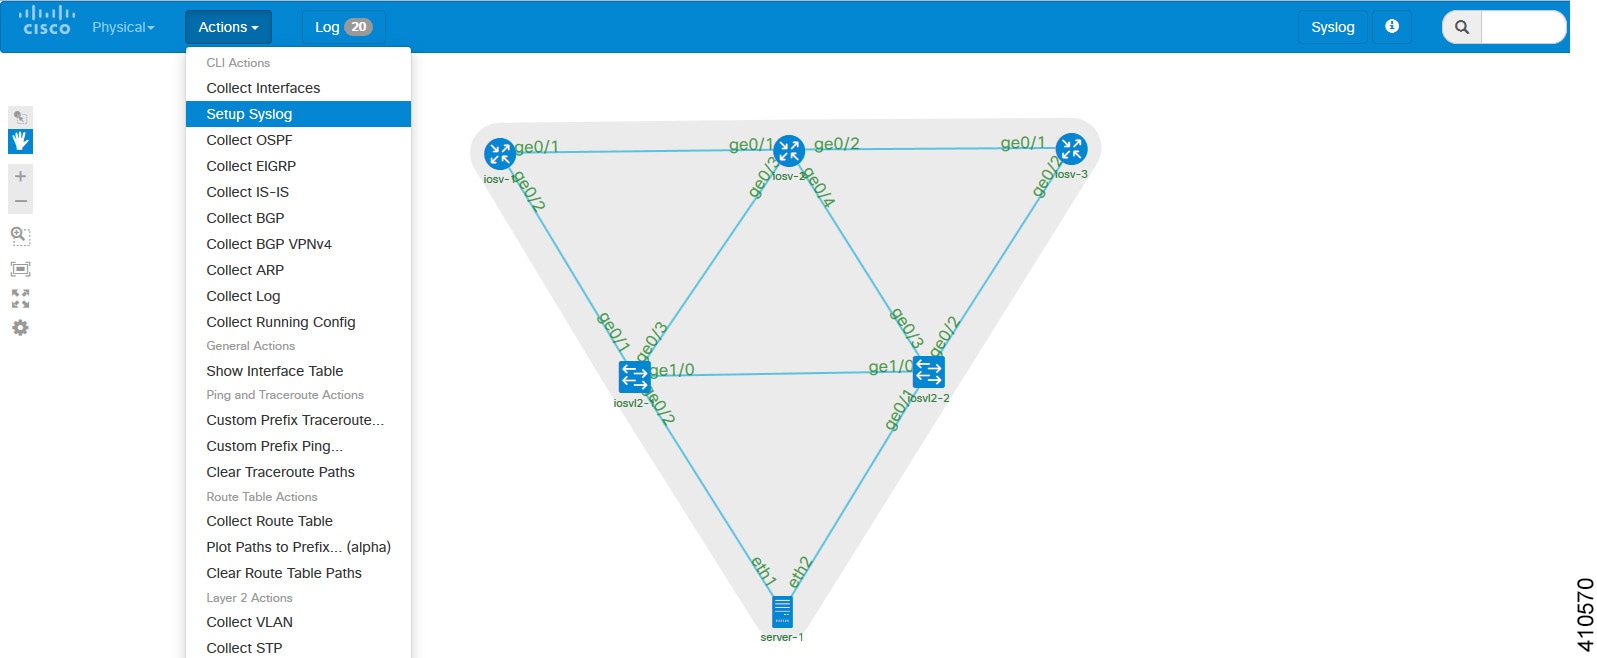
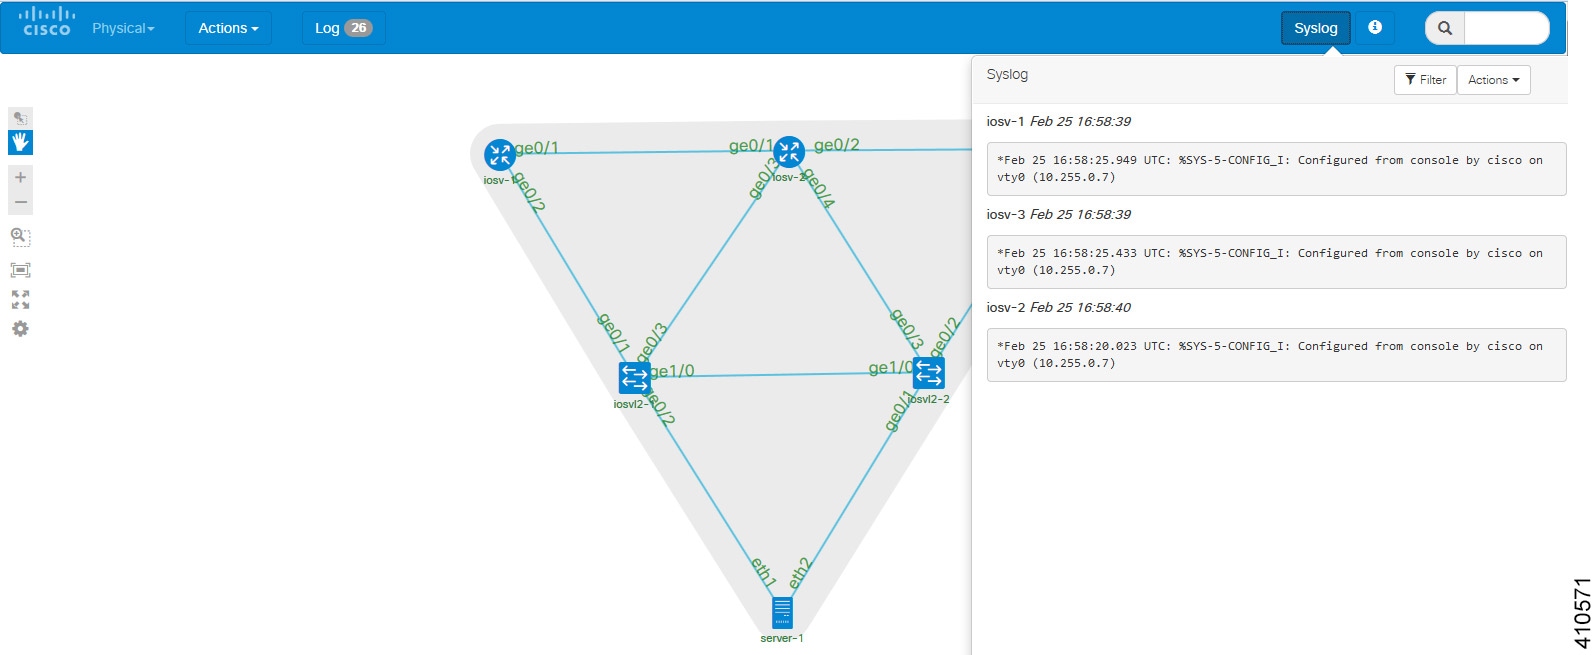
SYSLOG
Live Visualization Traceroute
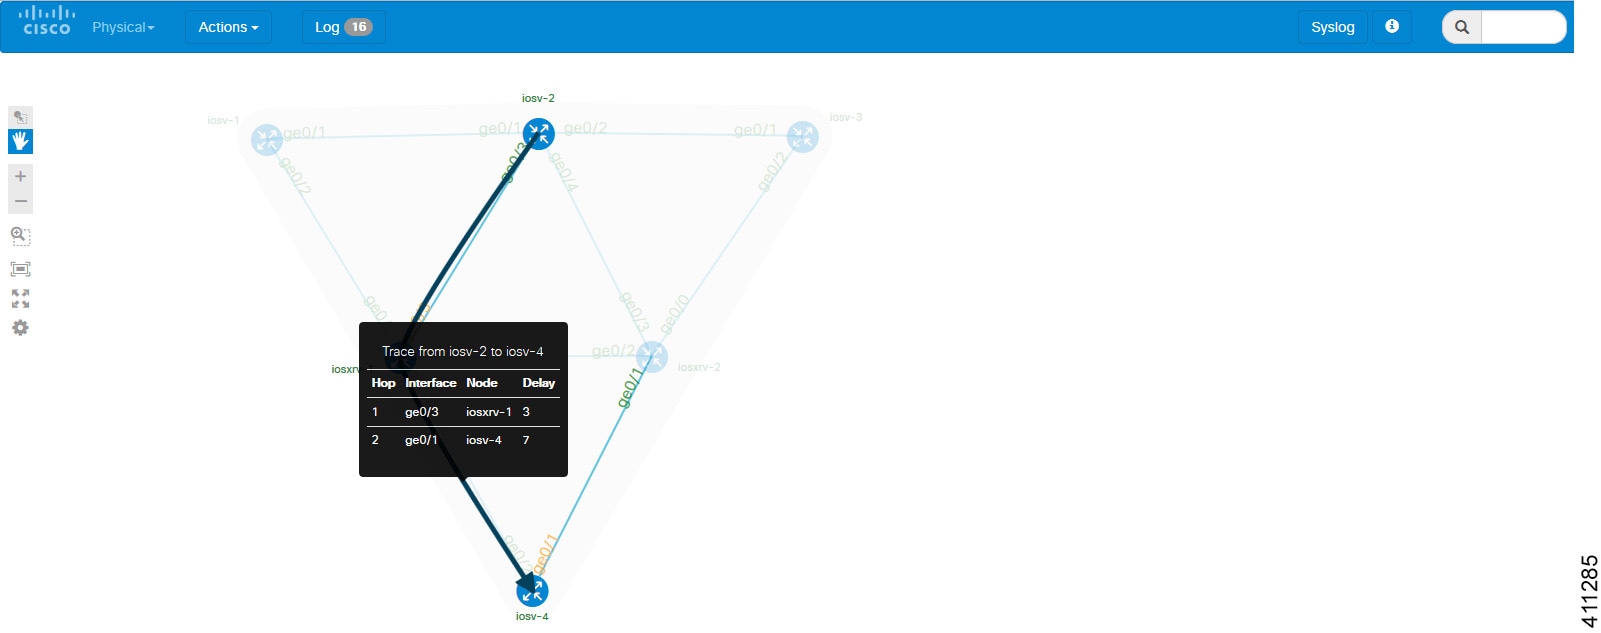
The traceroute functionality allows you to view the different routes used between the nodes in your topology.
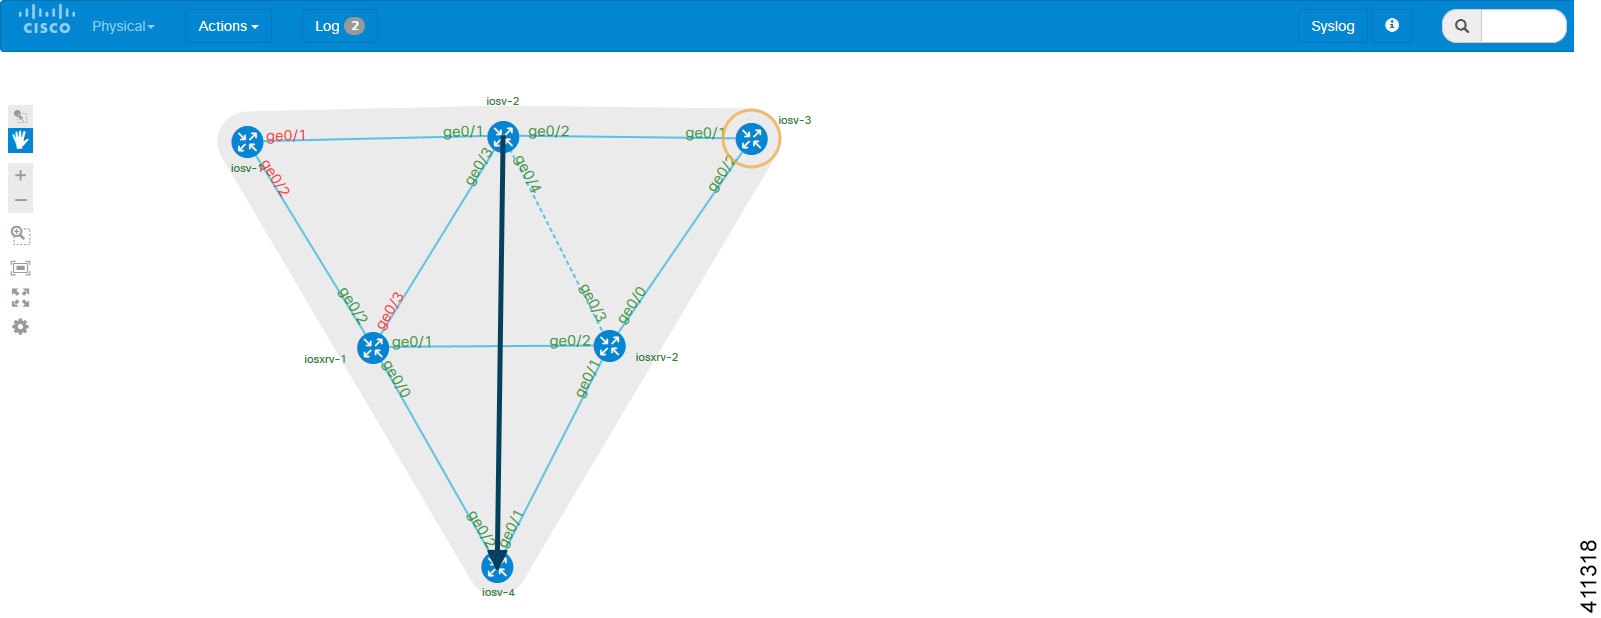
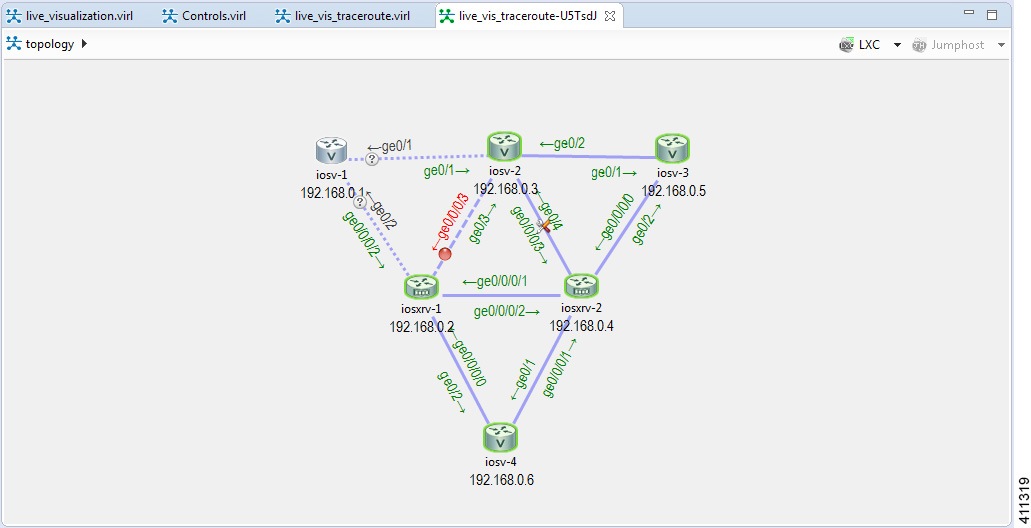
Next choose a destination node (for the loopback), or destination interface and from the drop-down menu, choose Trace To.
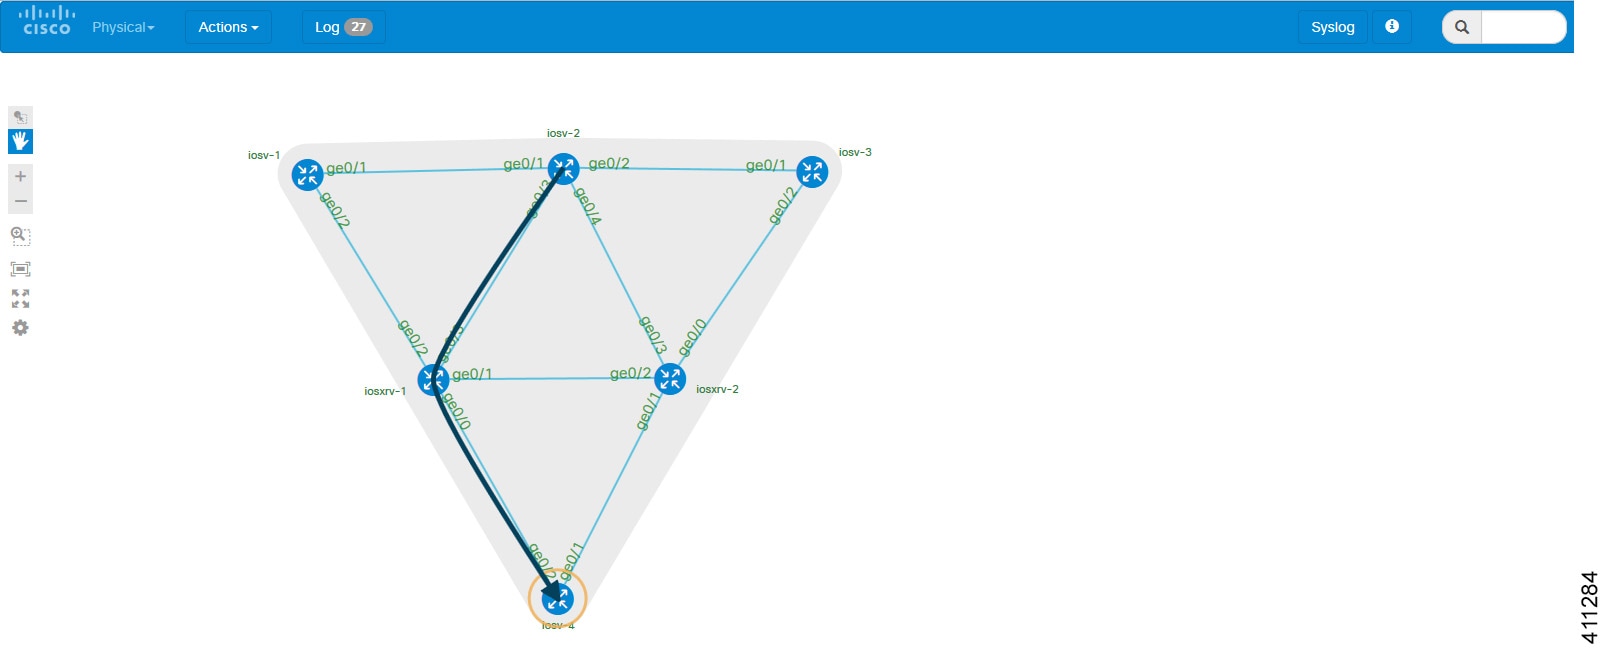
When an interface is disabled in the Live Visualization, the disabled interface name is shown in red. For a disabled node, all its interface names are shown in red. An interface that has link parameters set is displayed as a dashed line.
In the following example, the interface ge0/3 has been disabled so the path is rerouted. The interfaces ge0/1 and ge0/2 for node iosv-1 indicate that the node is disabled.
The interfaces ge0/4 and ge0/3 connecting nodes iosv-2 and iosxrv-2 indicate that link parameters have been set for this link.
 Feedback