- About This Guide
- Before You Begin
- Getting Started with Cisco Vision Dynamic Signage Director Operation
- Working with TV Displays
- Working with Zones, Groups, and Locations
- Working with Content Deployment
- Working with Screen Templates in Cisco Vision Director
- Working with Content in Cisco Vision Director
- Working with Playlists in Cisco Vision Director
- Working with Video Walls
- Working with Event Scripts
- Monitoring Media Player Operation During an Event Using Device Management
- Troubleshooting Event Operations in Cisco Vision Director
- Managing System Services in Cisco Vision Director
- Managing Server Resources in Cisco Vision Director
- Managing Media Player Operation in Cisco Vision Director
- Managing Backups in Cisco Vision Director
- Glossary of Terms
Release 6.3: Cisco Vision Dynamic Signage Director Operations Guide
Bias-Free Language
The documentation set for this product strives to use bias-free language. For the purposes of this documentation set, bias-free is defined as language that does not imply discrimination based on age, disability, gender, racial identity, ethnic identity, sexual orientation, socioeconomic status, and intersectionality. Exceptions may be present in the documentation due to language that is hardcoded in the user interfaces of the product software, language used based on RFP documentation, or language that is used by a referenced third-party product. Learn more about how Cisco is using Inclusive Language.
- Updated:
- September 19, 2019
Chapter: Monitoring Media Player Operation During an Event Using Device Management
Monitoring Media Player Operation During an Event Using Device Management
User Role: Administrator / Help Desk/ Support / Venue Operator / Venue Administrator
This module describes how to monitor operation of media players using Device Management in Cisco Vision Director.
Information About Device Management
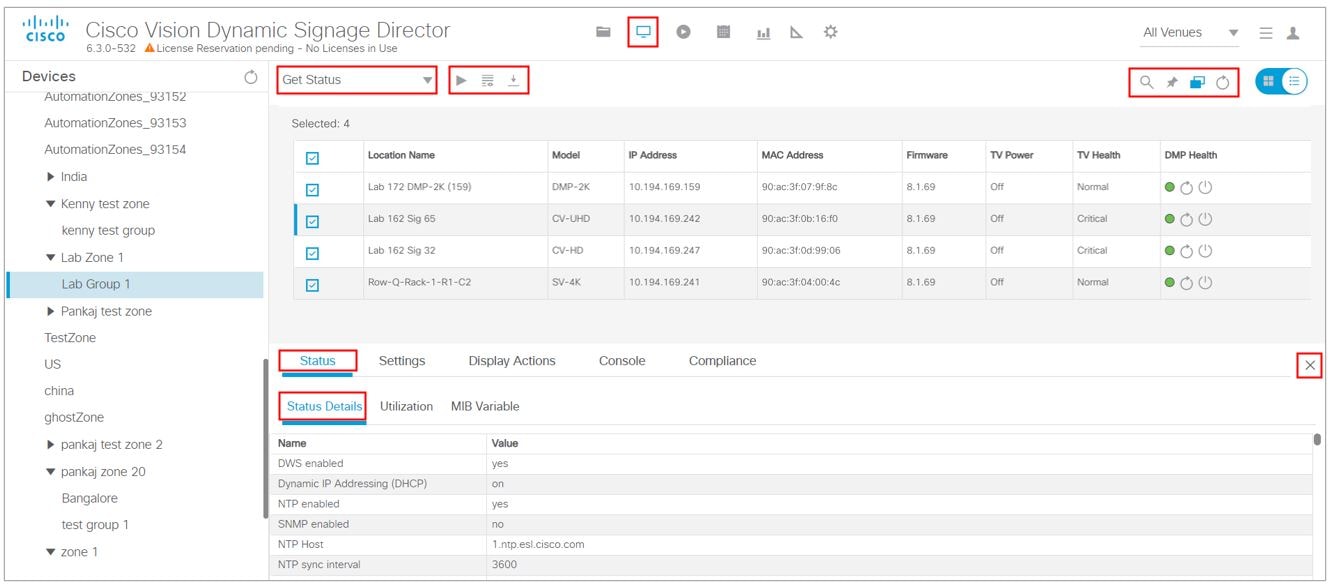
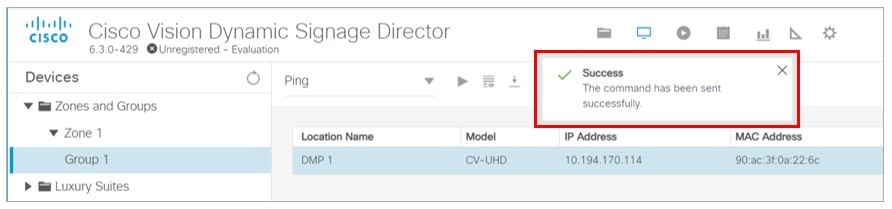
The Device Management application shows at-a-glance device status information for media players and their attached TV displays during an event (Figure 31).c
Figure 31 Accessing the Device Management Application
Device Management Highlights
■![]() Is accessible from the Cisco Vision Director Main Menu.
Is accessible from the Cisco Vision Director Main Menu.
■![]() Supports multi-venue site selection.
Supports multi-venue site selection.
■![]() Polls media players every 120 seconds (default) and auto-refreshes the monitoring display.
Polls media players every 120 seconds (default) and auto-refreshes the monitoring display.
■![]() Supports different ways to view device status.
Supports different ways to view device status.
■![]() Allows you to select media players that you want to monitor by:
Allows you to select media players that you want to monitor by:
■![]() Provides icon for Administrator to Refresh or Restart a digital media player.
Provides icon for Administrator to Refresh or Restart a digital media player.
■![]() Displays the folder structure in the Devices panel into Zones and Groups, Luxury Suites, the Auto Registered Devices, and All Devices.
Displays the folder structure in the Devices panel into Zones and Groups, Luxury Suites, the Auto Registered Devices, and All Devices.
Device Management Roles
Note : The Administrator is the only role that can restart media players within the Device Management interface, or change the polling interval.
Device Management can be used by the following Cisco Vision Director user roles:
Device Management Views
Device Management supports three monitoring views of device status:
■![]() Thumbnail View—Provides the Devices Panel and the thumbnail of the devices or toggles to only List view.
Thumbnail View—Provides the Devices Panel and the thumbnail of the devices or toggles to only List view.
■![]() List View —Provides detailed device status information in a tabular format.
List View —Provides detailed device status information in a tabular format.
Enhancements to Device Management
When the Management Dashboard interface got completely redesigned for Release 6.3, we moved the capabilities of the Monitor and Status of the devices and the DMP and TV Control drawers to Device Management. We upgraded the search/filter functions to allow you to quickly perform an action on large groups of DMPs. To make your search or filter functions additive, use the Pin (see red box in Figure 31).
■![]() Hover over the icons in the top right for functions.
Hover over the icons in the top right for functions.
■![]() Click the Refresh icon in the top right of the Devices panel to refresh your preview, without having to wait for the next auto-refresh cycle to show a preview. This works for multiple DMPs, too.
Click the Refresh icon in the top right of the Devices panel to refresh your preview, without having to wait for the next auto-refresh cycle to show a preview. This works for multiple DMPs, too.
■![]() Within a Zone or Group, you can use Pinning mode (see Pinning Mode) to select multiple DMPs within a set and perform a function (such as Turn TV On).
Within a Zone or Group, you can use Pinning mode (see Pinning Mode) to select multiple DMPs within a set and perform a function (such as Turn TV On).
■![]() Provides Status, Settings Display Actions, Console, and Compliance tabs data—each with their own sub set of tabs for read-only information (ported from Management Dashboard)
Provides Status, Settings Display Actions, Console, and Compliance tabs data—each with their own sub set of tabs for read-only information (ported from Management Dashboard)
Note: Thumbnail view for the Auto Registered and All Devices folders is not supported.
Pinning Mode
We added a new feature and a Pin icon. Using Pin allows you to build “sets” or groups of DMPs on which you want to take an action, such as Start Streaming (Figure 34). Pinning mode works in conjunction with Search/Filter and allows you to “pin” your results to the previous Search/Filter criteria. This makes your searches additive, allowing you to build groupings more effectively. See Device Management Filters to use Pin and Search/Filter modes.
Note: When in Pinning Mode, if you toggle back and forth from Listview to Thumbnail View, all your list criteria is lost.
Status of the DMPs
The Status functions are available in Device Management. This interface allows you to view device information.
Check Status of the Devices
To see device status information:
2.![]() Select a device from the folders in the Devices panel. The main panel displays.
Select a device from the folders in the Devices panel. The main panel displays.
3.![]() Select a device from the main panel and five Status tabs appears below (Figure 32).
Select a device from the main panel and five Status tabs appears below (Figure 32).
Figure 32 Device Status Information Panel
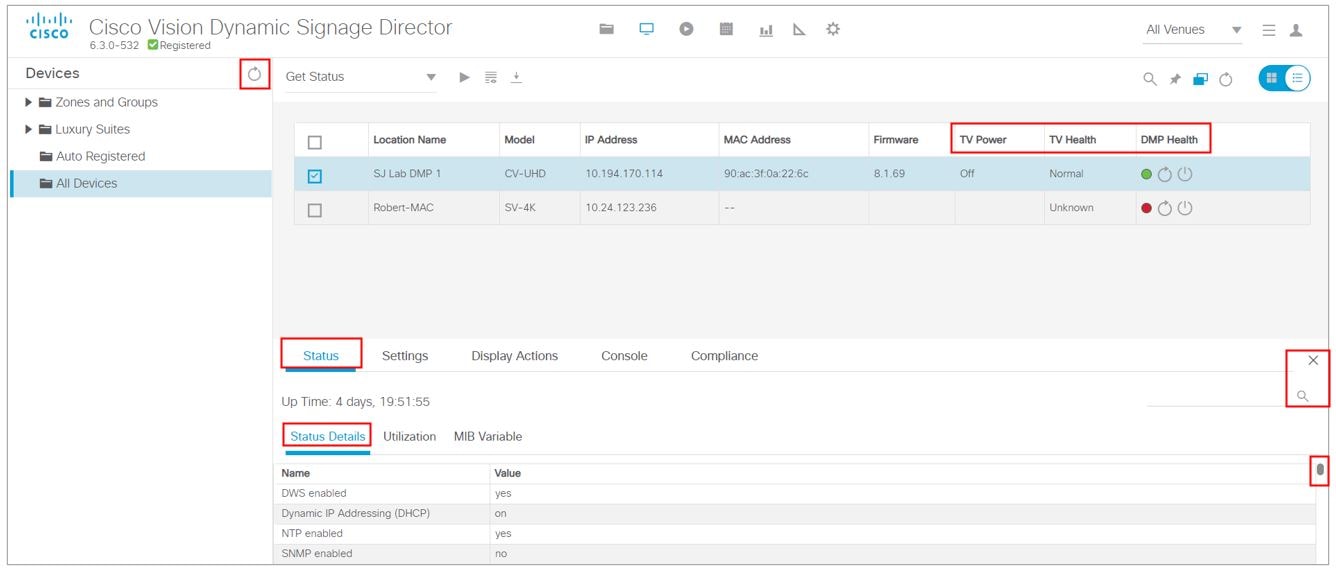
The top row of tabs determine what the lower row of tabs display. All of the columns are searchable. Start typing in the search field and the information updates.
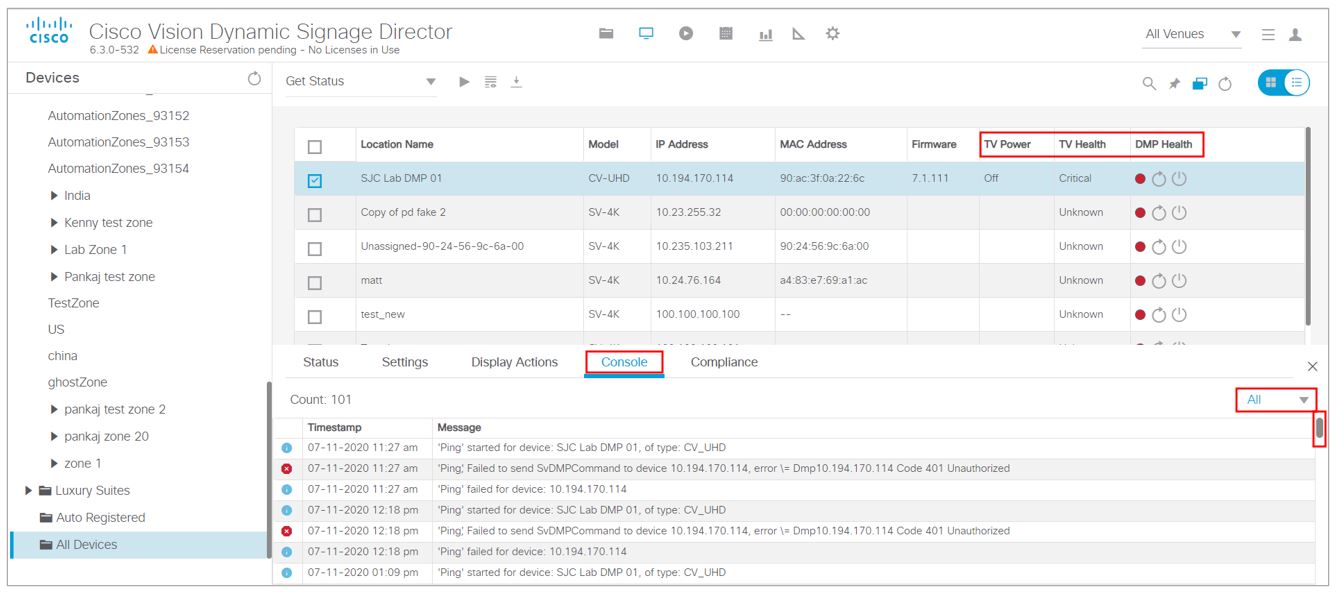
Check the Console Information
1.![]() Click the Console tab (Figure 33). The display option default is All messages.
Click the Console tab (Figure 33). The display option default is All messages.
2.![]() Click the down arrow to choose one of the following criteria to filter to:
Click the down arrow to choose one of the following criteria to filter to:
Figure 33 Console Information on the Devices
DMP and TV Controls
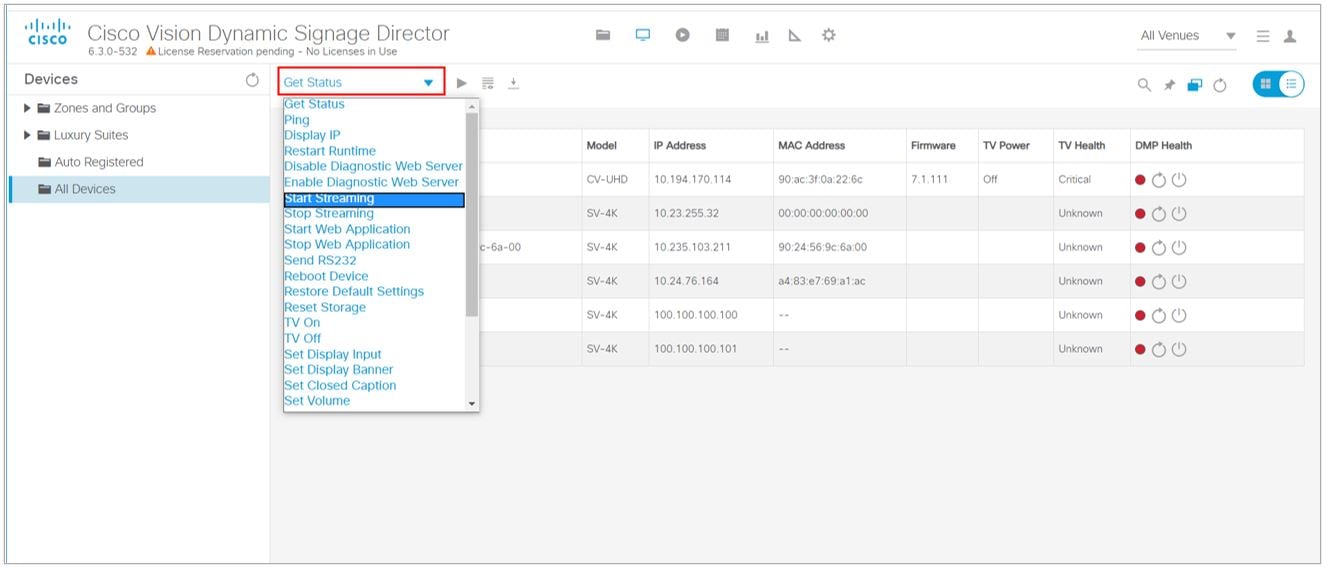
The DMP and TV Controls drawer of Management Dashboard is now available in Device Management. All the available commands and controls to choose from are under the Get Status drop-down arrow.
To perform an action on the DMPs:
1.![]() Select all DMPs from your folders in the Devices panel. The devices appear in the center list.
Select all DMPs from your folders in the Devices panel. The devices appear in the center list.
Note: To search / find DMPs, see Device Management Filters.
2.![]() Select the devices from the center panel. They are highlighted and the Status and Console tabs panel appear at the bottom portion of your screen.
Select the devices from the center panel. They are highlighted and the Status and Console tabs panel appear at the bottom portion of your screen.
3.![]() Click the down arrow near Get Status and select an action from the list (Figure 34).
Click the down arrow near Get Status and select an action from the list (Figure 34).
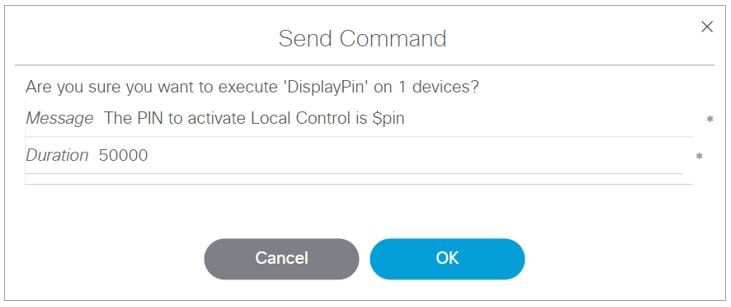
4.![]() Click the Play icon (Send Command) on the device(s) to perform the action. The Send Command dialog box appears (Figure 35). The Send Command box shows data applicable to the action you chose from the Get Status pull-down. Some fields are editable.
Click the Play icon (Send Command) on the device(s) to perform the action. The Send Command dialog box appears (Figure 35). The Send Command box shows data applicable to the action you chose from the Get Status pull-down. Some fields are editable.
Figure 35 Send Command Dialog Box
5.![]() Click OK. A confirmation of the command appears.
Click OK. A confirmation of the command appears.
Check Status of the Command
To check the status of the command you just sent:
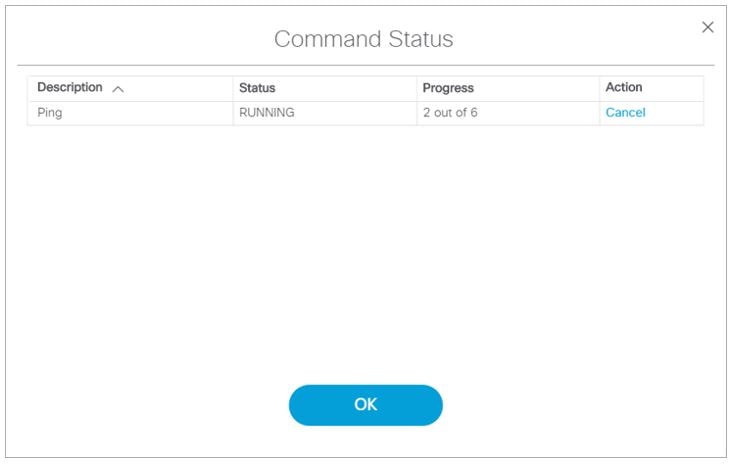
1.![]() Click the Command Status icon (see icons in red box Figure 31). The Command Status dialog box appears showing your selected devices and their status (Figure 36). Depending on what action you chose (in the Description column, you can stop the Action, shown in the far right column). This dialog shows only “in-progress” commands. Completed commands are not shown in the Command Status dialog box. This control is similar to the DMP and TV Control drawer from Release 6.2 Management Dashboard.
Click the Command Status icon (see icons in red box Figure 31). The Command Status dialog box appears showing your selected devices and their status (Figure 36). Depending on what action you chose (in the Description column, you can stop the Action, shown in the far right column). This dialog shows only “in-progress” commands. Completed commands are not shown in the Command Status dialog box. This control is similar to the DMP and TV Control drawer from Release 6.2 Management Dashboard.
Figure 36 Command Status Dialog Box
To export the punch list on the selected device(s):
1.![]() Click the Export icon (Figure 31). The data downloads.
Click the Export icon (Figure 31). The data downloads.
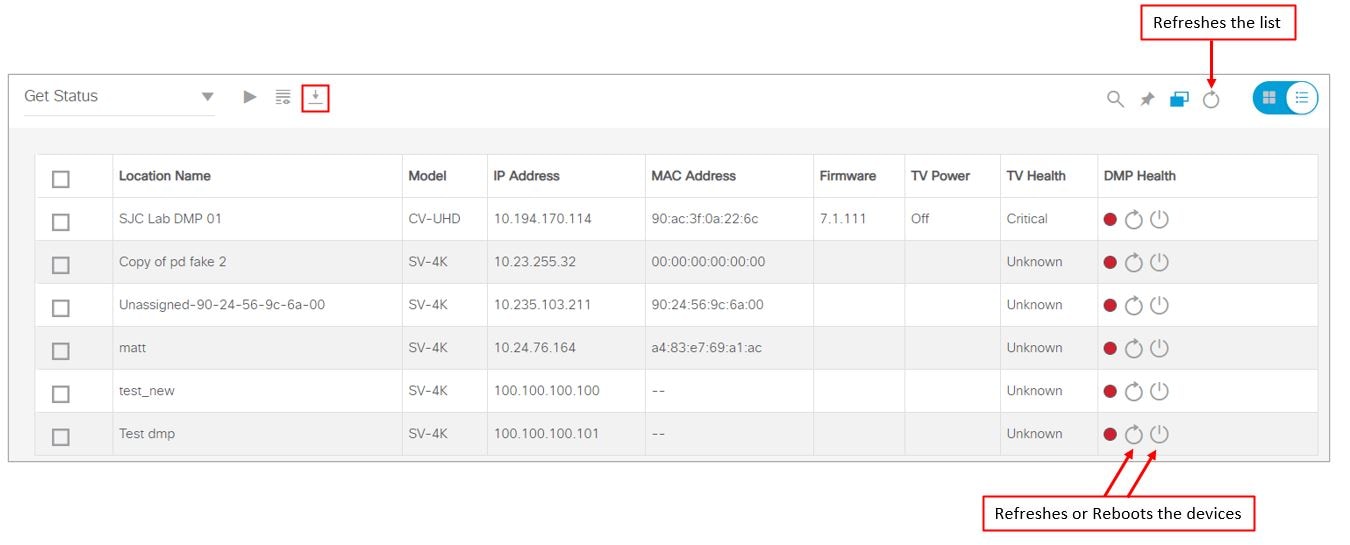
To refresh or reboot the devices or the screen:
1.![]() Click the Refresh or Reboot icons (Figure 37).
Click the Refresh or Reboot icons (Figure 37).
Figure 37 Refresh or Reboot Devices
DMP and TV Control
1.![]() Select all DMPs from your folders in the Devices panel. The devices appear in the center list.
Select all DMPs from your folders in the Devices panel. The devices appear in the center list.
Note: To search / find DMPs, see Device Management Filters.
2.![]() Select the devices from the center panel.
Select the devices from the center panel.
3.![]() Use the Pin to add more devices from other sets or groups.
Use the Pin to add more devices from other sets or groups.
4.![]() Use the check boxes to select or deselect.
Use the check boxes to select or deselect.
5.![]() Click the down arrow near Get Status and select an action from the list (Figure 34).
Click the down arrow near Get Status and select an action from the list (Figure 34).
6.![]() Click the Play icon (Send Command) on the device(s) to perform the action. The Send Command dialog box appears.
Click the Play icon (Send Command) on the device(s) to perform the action. The Send Command dialog box appears.
To turn on/off TVs or set channel numbers:
1.![]() Select all DMPs from your folders in the Devices panel. The devices appear in the center list.
Select all DMPs from your folders in the Devices panel. The devices appear in the center list.
Note: To search / find DMPs, see Device Management Filters.
2.![]() Select the devices from the center panel.
Select the devices from the center panel.
3.![]() Use the Pin to add more devices from other sets or groups.
Use the Pin to add more devices from other sets or groups.
4.![]() Use the check boxes to select or deselect.
Use the check boxes to select or deselect.
Note: You must have the devices set in zones to turn off multiple devices. Also, you must have privileges to perform this action.
5.![]() Select the TVs with the check boxes.
Select the TVs with the check boxes.
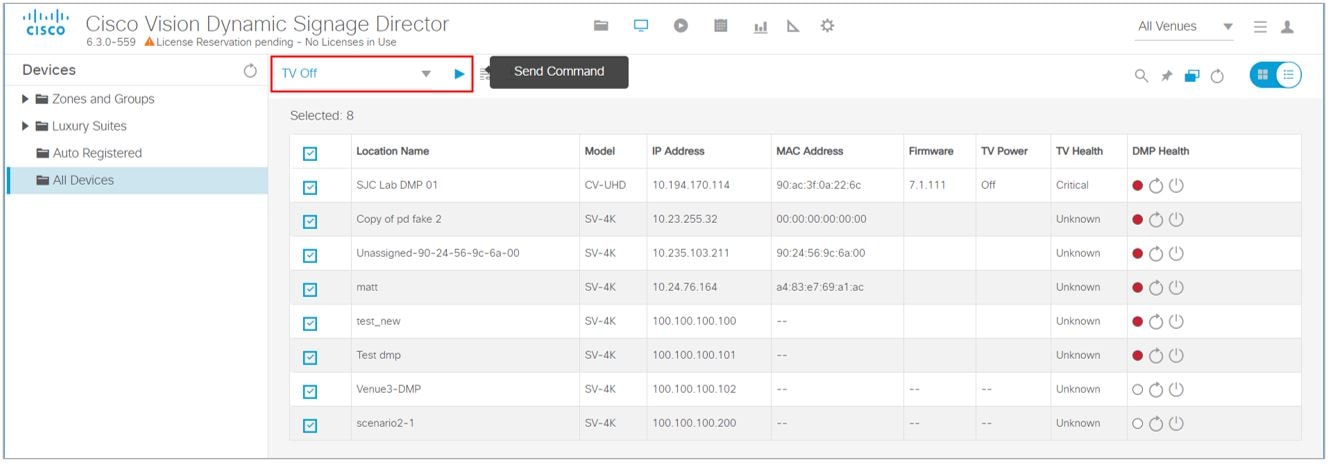
6.![]() Use the action down arrow to select > TV Off (Figure 34).
Use the action down arrow to select > TV Off (Figure 34).
7.![]() Click Send Command (Figure 38).
Click Send Command (Figure 38).
Figure 38 Send Command to Turn TVs Off in Set
1.![]() Change the action pull down to Set Video Channel for the devices you selected (checked).
Change the action pull down to Set Video Channel for the devices you selected (checked).
2.![]() Click Send Command confirmation box appears (Figure 39).
Click Send Command confirmation box appears (Figure 39).
Figure 39 Send Command Confirmation
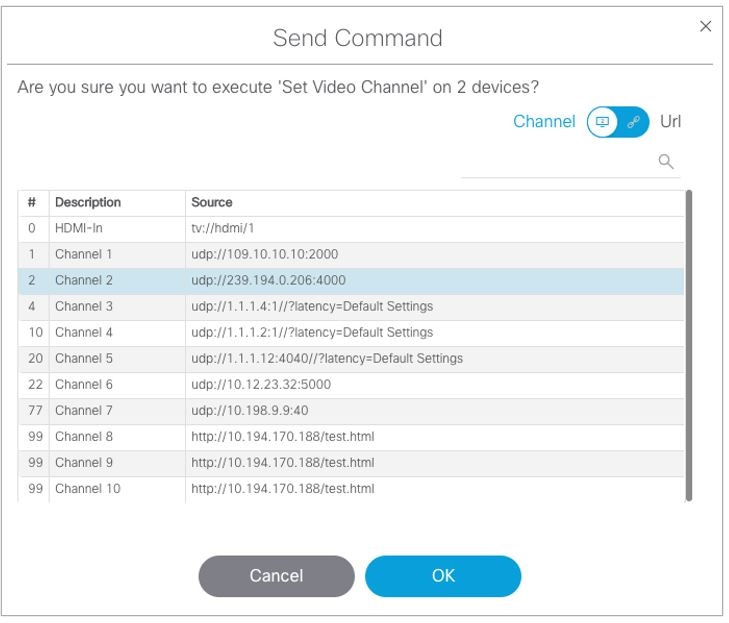
You can choose a channel from the list of channels from the channel guide or a URL channel. Use the toggle.
For acting on a single device:
–![]() Toggle to thumbnail view. Click an image in the view and the screen changes to show DMP summary and Configuration tab at bottom (Figure 40).
Toggle to thumbnail view. Click an image in the view and the screen changes to show DMP summary and Configuration tab at bottom (Figure 40).
Figure 40 TV Control Dialog Box
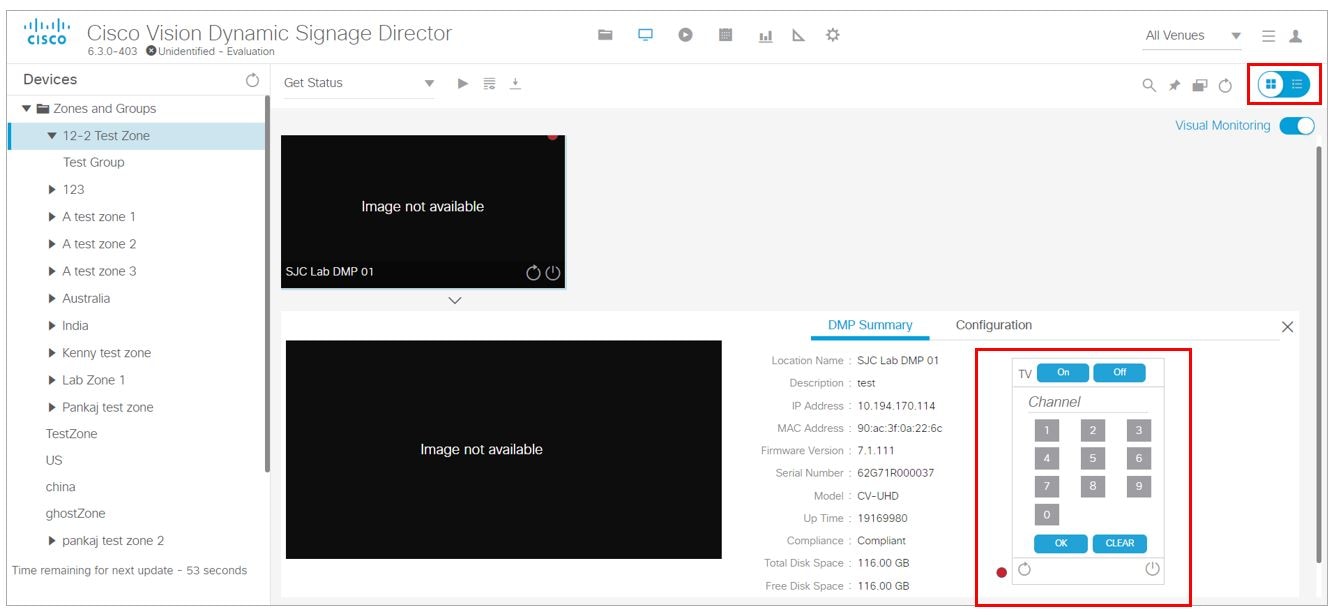
–![]() Turn the selected devices on, off, set the Channel number, or refresh. To turn TVs off, a confirmation dialog box appears.
Turn the selected devices on, off, set the Channel number, or refresh. To turn TVs off, a confirmation dialog box appears.
Device Management Filters
Filter allows you to apply filter criteria to the devices list so you see devices with specific characteristics or conditions:
1.![]() Select the device criteria from the Devices panel on the left.
Select the device criteria from the Devices panel on the left.
2.![]() Click Search and the Find Devices dialog box appears (Figure 41). Toggle to Filter.
Click Search and the Find Devices dialog box appears (Figure 41). Toggle to Filter.
3.![]() Search by Field or Value. Once you select the Field criteria from the bullet list above, the Value options update so only the options corresponding to the Field value display.
Search by Field or Value. Once you select the Field criteria from the bullet list above, the Value options update so only the options corresponding to the Field value display.
4.![]() Click OK. The criteria appear in the list of devices.
Click OK. The criteria appear in the list of devices.
Figure 41 Find Devices Dialog Box

Filter Devices Options and Criteria
Table 3 lists the filtering criteria. To Find or Filter on your devices, choose a Field option, then the available options display in the Value field. This is particularly useful when building sets of DMPs on which to act.
Field |
Value |
|---|---|
Normal |
|
To add to (pin) your filter criteria and retain already searched or filtered devices:
2.![]() Select different search/find criteria.
Select different search/find criteria.
3.![]() Click OK. The new information adds to your previous list. The check boxes allow you to deselect a device that you DON’T want to perform an action on.
Click OK. The new information adds to your previous list. The check boxes allow you to deselect a device that you DON’T want to perform an action on.
Cisco Vision Director checks the set and does not duplicate entries in case of overlapping criteria.
Best Practices for Device Management
When working with Device Management, consider the following best practices:
■![]() Do not change the DMP polling interval to less than the 120000 ms (2 minutes) default.
Do not change the DMP polling interval to less than the 120000 ms (2 minutes) default.
■![]() To reduce network traffic, only enable monitoring for the DMPs that you want to observe for the event.
To reduce network traffic, only enable monitoring for the DMPs that you want to observe for the event.
How to Use Device Management
This section includes the following topics:
■![]() Prerequisites for Device Management
Prerequisites for Device Management
■![]() Restrictions for Device Management
Restrictions for Device Management
■![]() Enabling Visual Monitoring of Devices in Device Management
Enabling Visual Monitoring of Devices in Device Management
■![]() Enabling Visual Monitoring of Devices in Device Management
Enabling Visual Monitoring of Devices in Device Management
■![]() Viewing DMP Details in Device Management
Viewing DMP Details in Device Management
■![]() Rebooting DMPs in Device Management
Rebooting DMPs in Device Management
■![]() Changing the Device Management Polling Period
Changing the Device Management Polling Period
Prerequisites for Device Management
Before you configure Device Management, be sure that the following conditions are met:
Restrictions for Device Management
Before you use Device Management, consider the following restrictions:
■![]() Only users with role of Administrator can reboot DMPs from Device Management.
Only users with role of Administrator can reboot DMPs from Device Management.
Enabling Visual Monitoring of Devices in Device Management
User Role: Administrator / Help Desk / Support / Venue Operator / Venue Administrator
By default, monitoring of devices in Device Management is disabled.
Note: Visual Monitoring is supported for the DMPs in the Zones and Groups and Luxury Suites folders only.
To enable monitoring of devices in Device Management:
1.![]() From the Device Management screen, select a Zones and Groups or Luxury Suites folder and drill down to the device you want to see.
From the Device Management screen, select a Zones and Groups or Luxury Suites folder and drill down to the device you want to see.
2.![]() Switch the view to thumb nail. The images appear.
Switch the view to thumb nail. The images appear.
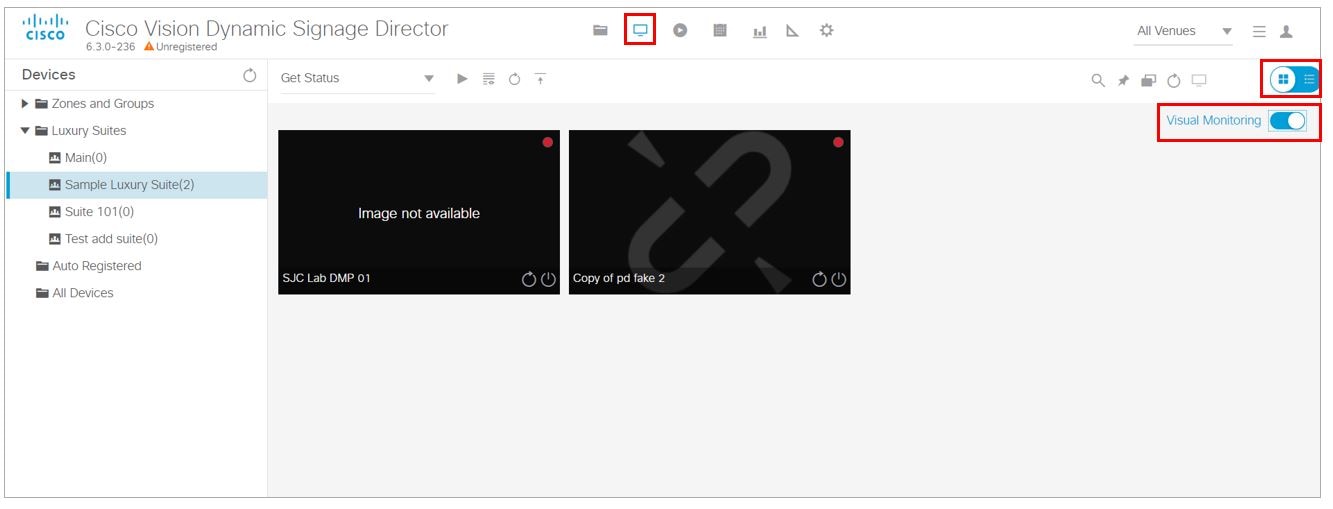
TIP: Disabled DMPs display “Non Monitorable” on the screen when you select them ( Figure 42).
3.![]() Select the DMP(s) that you want to enable for monitoring and select the Visual Monitoring slider to ON ( Figure 42).
Select the DMP(s) that you want to enable for monitoring and select the Visual Monitoring slider to ON ( Figure 42).
Figure 42 Visual Monitoring Checkbox
Viewing DMP Details in Device Management
User Role: Administrator / Help Desk Support / Venue Operator / Venue Administrator
You can view a lot of information about DMPs from Device Management including addressing information, firmware version, disk space and configuration.
To view DMP details in Device Management:
2.![]() Click Search / Filter find the DMP that you want information about.
Click Search / Filter find the DMP that you want information about.
3.![]() Click the thumbnail of the DMP. The DMP Summary page displays ( Figure 43).
Click the thumbnail of the DMP. The DMP Summary page displays ( Figure 43).
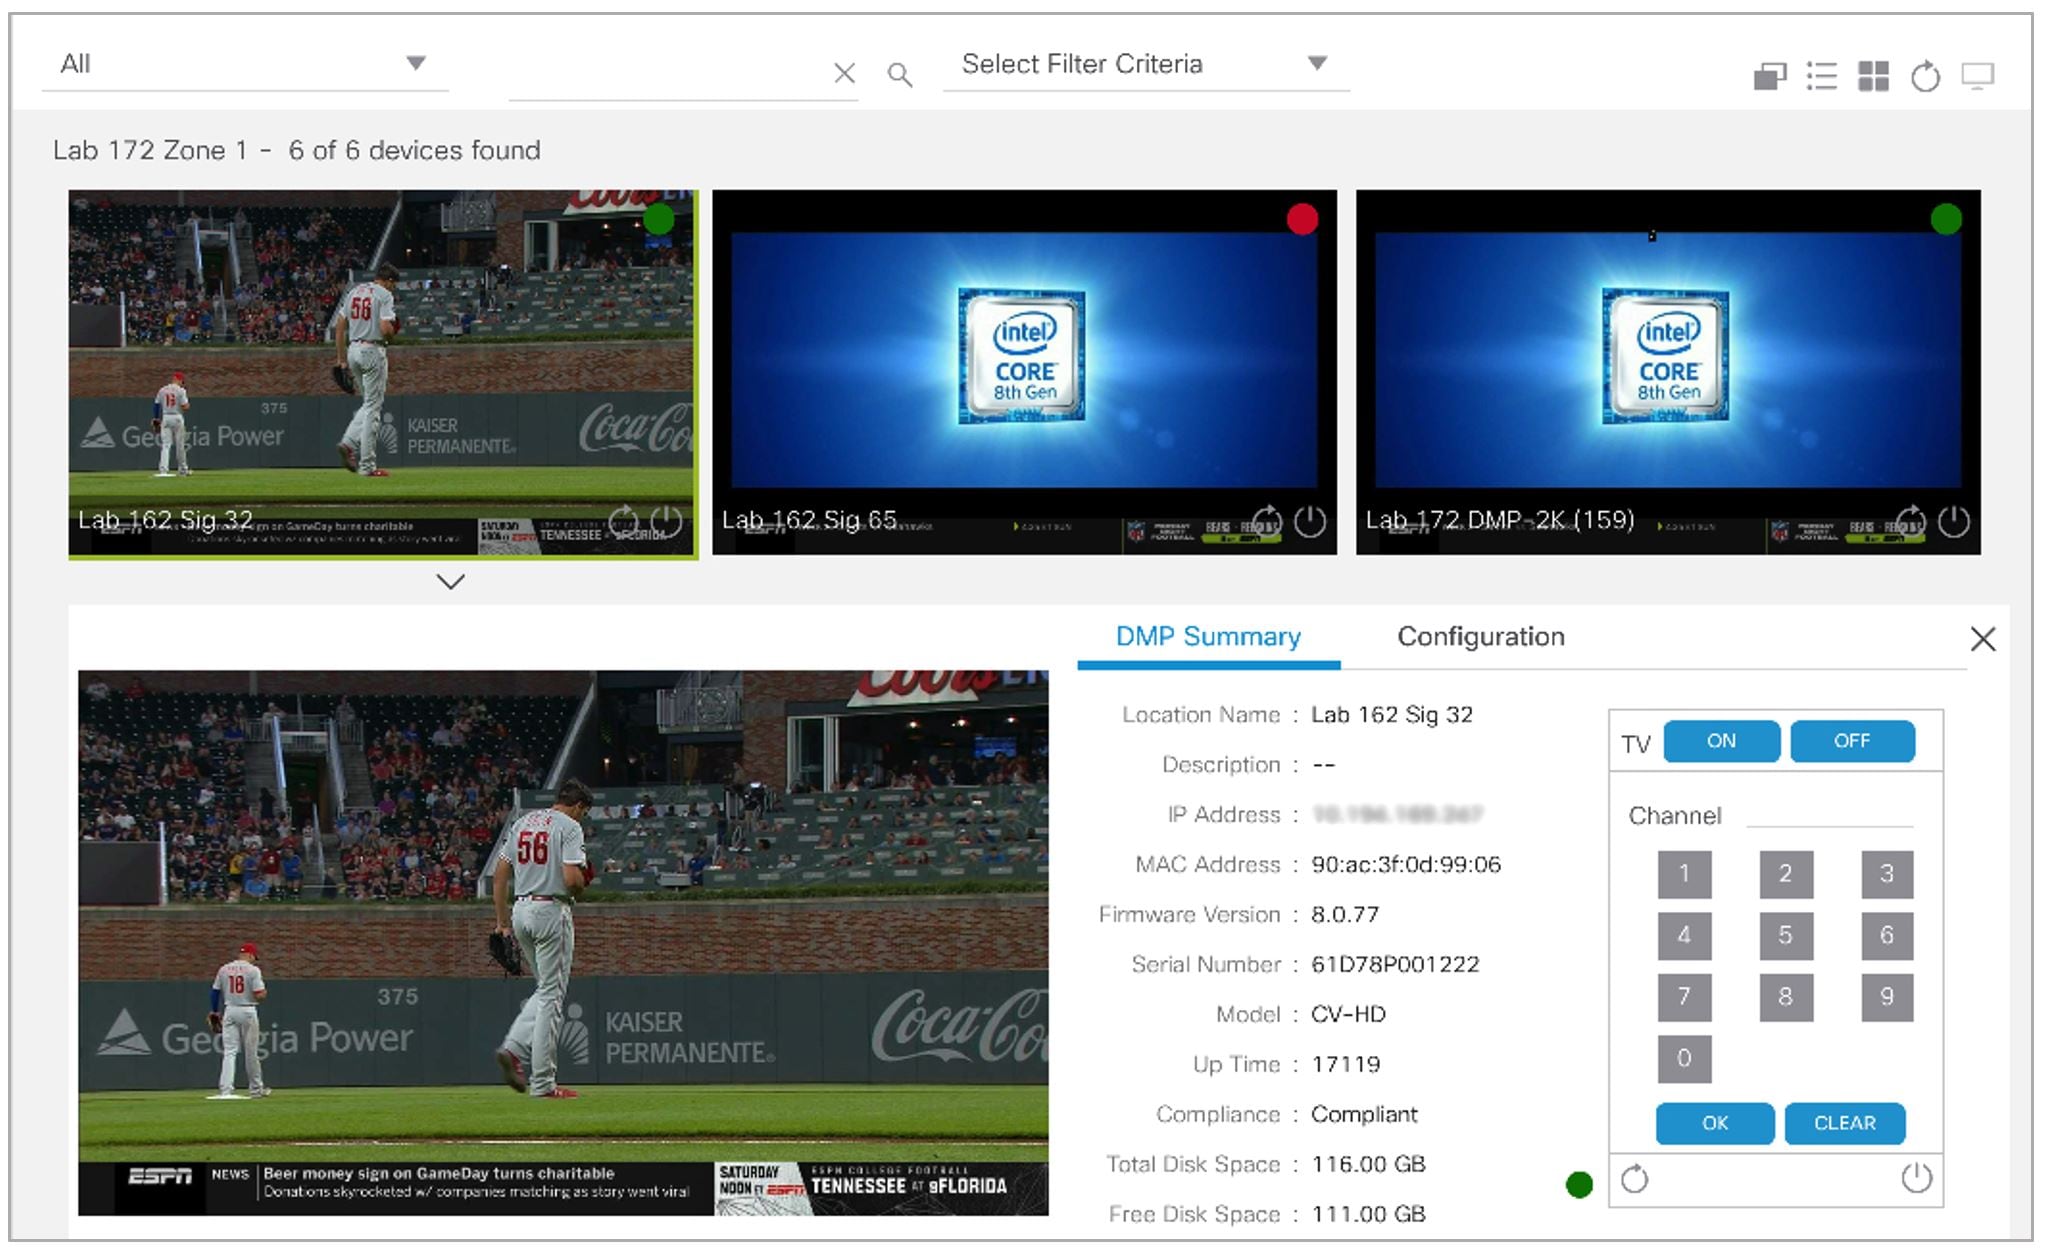
From here, there are TV controls you can manage such as:
Note: In thumbnail view, Refresh only updates the devices you see on your screen, not the entire list of DMPs in the selected zone.
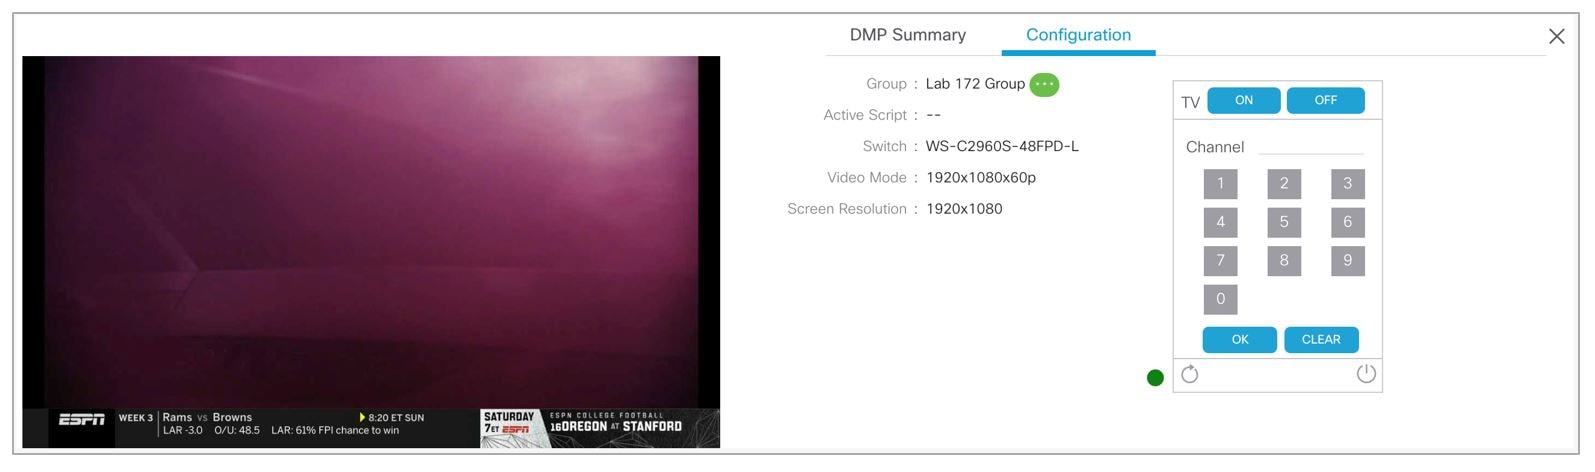
4.![]() To see configuration information such as switch and script information, click Configuration. The DMP Configuration page displays ( Figure 44).
To see configuration information such as switch and script information, click Configuration. The DMP Configuration page displays ( Figure 44).
From here, there are TV controls you can manage such as:
Figure 44 DMP Configuration Panel
Rebooting DMPs in Device Management
User Role: Administrator / Venue Administrator
ONLY users with the Administrator role can reboot DMPs from within Device Management.
The reboot devices button can be used from either the grid view ( Figure 37) or list view.
Changing the Device Management Polling Period
User Role: Administrator / Venue Administrator
By default, Device Management polls devices to update status every 120 seconds.
To change the Device Management polling period:
1.![]() Click Configuration > System Configuration > Management Dashboard > DMP Health Poller.
Click Configuration > System Configuration > Management Dashboard > DMP Health Poller.
2.![]() In the Configuration Property box, select Normal Poll Interval in seconds.
In the Configuration Property box, select Normal Poll Interval in seconds.
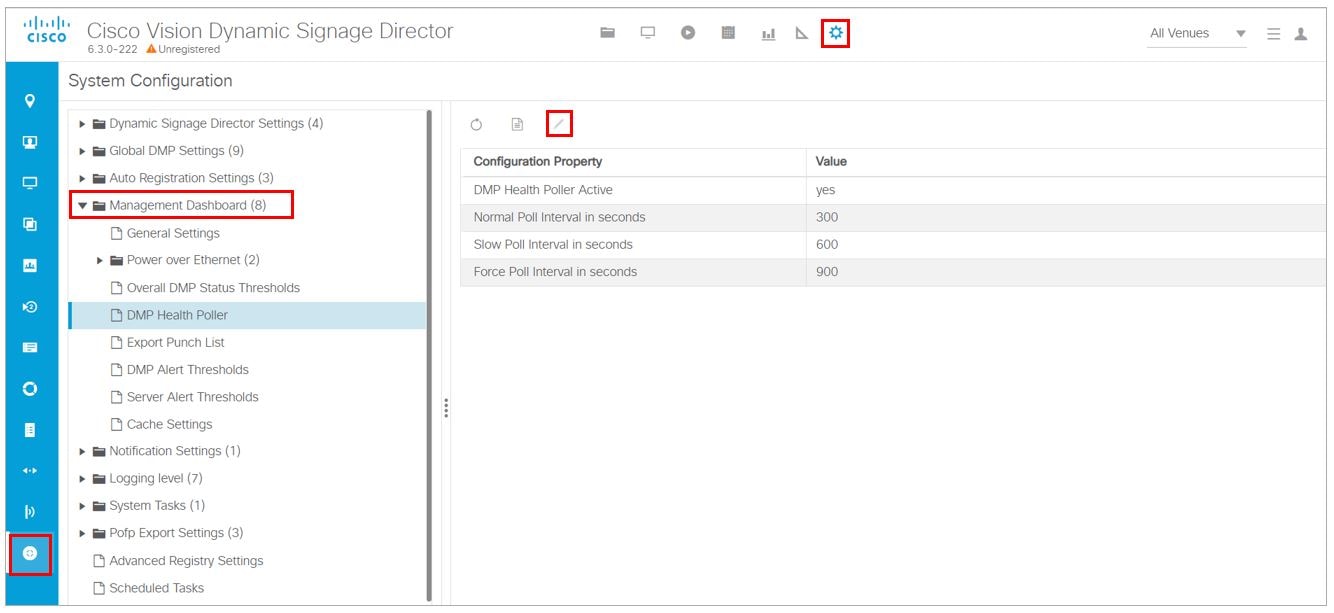
3.![]() Click Edit. The Edit - Configuration Setting dialog box appears.
Click Edit. The Edit - Configuration Setting dialog box appears.
4.![]() In the Value field, type the time period in ms.
In the Value field, type the time period in ms.
TIP: You do not need to reset the DMPs to apply the new value. Whenever a script starts, the media player retrieves the global settings.
Note: In Listview, polling occurs every 60 seconds for cached data.
 Feedback